. 2020 Jun 8;8(1):88.
doi: 10.1186/s40168-020-00868-z.

Bacteroides thetaiotaomicron-derived outer membrane vesicles promote regulatory dendritic cell responses in health but not in inflammatory bowel disease

Affiliations

Bacteroides thetaiotaomicron-derived outer membrane vesicles promote regulatory dendritic cell responses in health but not in inflammatory bowel disease

Lydia Durant et al. Microbiome. .

Abstract

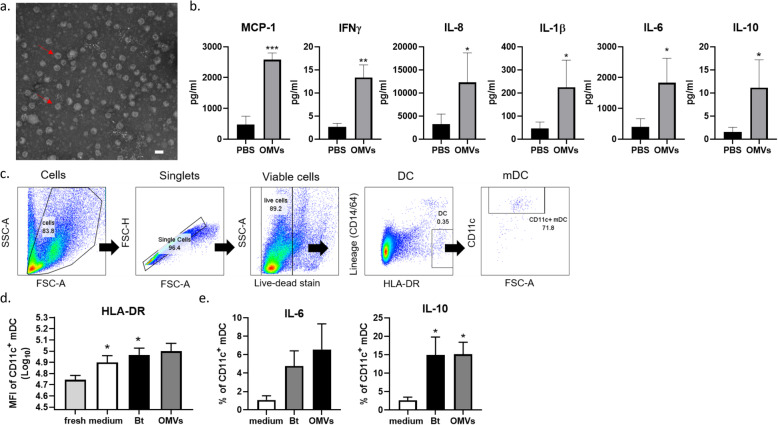
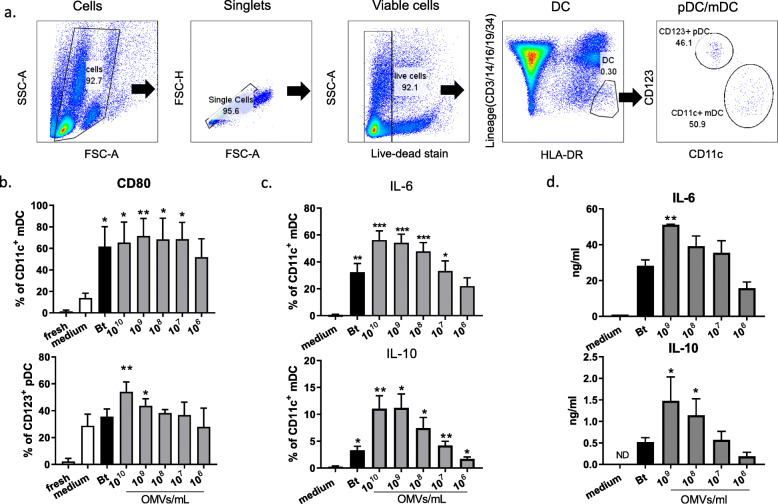
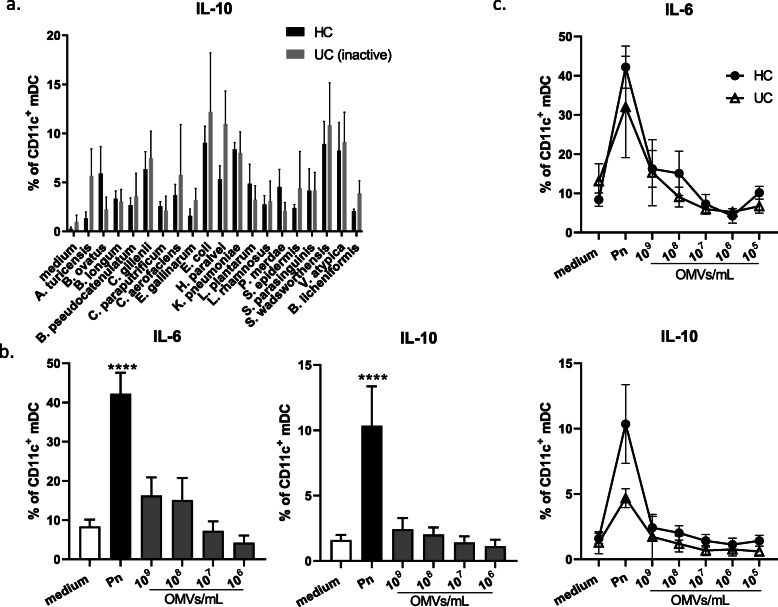
Background: Bacteroides thetaiotaomicron (Bt) is a prominent member of the human intestinal microbiota that, like all gram-negative bacteria, naturally generates nanosized outer membrane vesicles (OMVs) which bud off from the cell surface. Importantly, OMVs can cross the intestinal epithelial barrier to mediate microbe-host cell crosstalk involving both epithelial and immune cells to help maintain intestinal homeostasis. Here, we have examined the interaction between Bt OMVs and blood or colonic mucosa-derived dendritic cells (DC) from healthy individuals and patients with Crohn's disease (CD) or ulcerative colitis (UC).

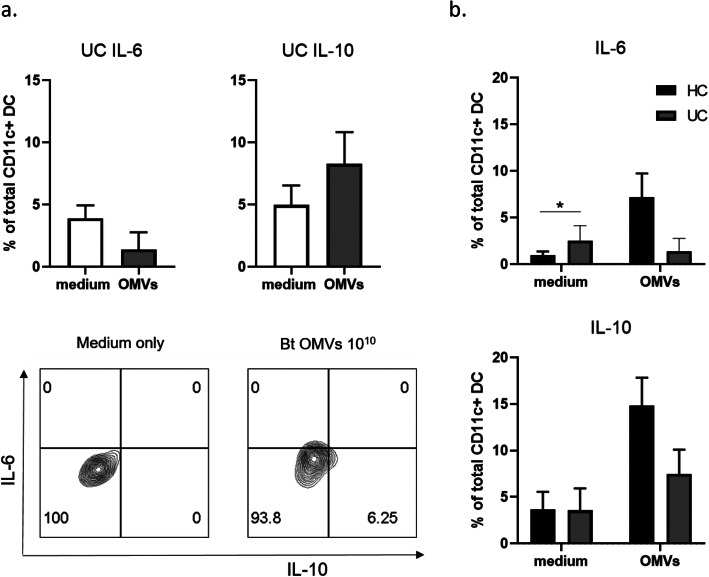
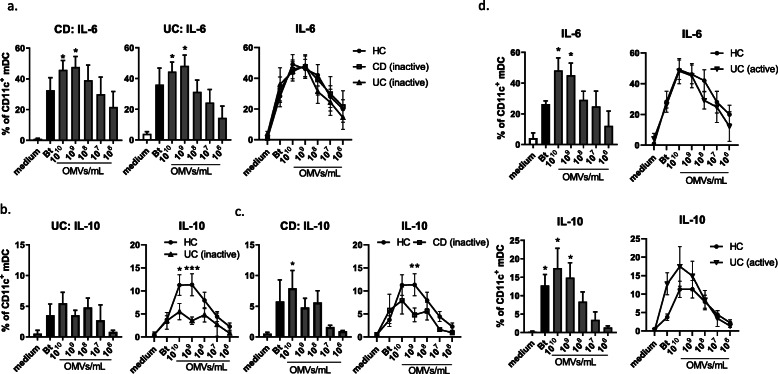
Results: In healthy individuals, Bt OMVs stimulated significant (p < 0.05) IL-10 expression by colonic DC, whereas in peripheral blood-derived DC they also stimulated significant (p < 0.001 and p < 0.01, respectively) expression of IL-6 and the activation marker CD80. Conversely, in UC Bt OMVs were unable to elicit IL-10 expression by colonic DC. There were also reduced numbers of CD103+ DC in the colon of both UC and CD patients compared to controls, supporting a loss of regulatory DC in both diseases. Furthermore, in CD and UC, Bt OMVs elicited a significantly lower proportion of DC which expressed IL-10 (p < 0.01 and p < 0.001, respectively) in blood compared to controls. These alterations in DC responses to Bt OMVs were seen in patients with inactive disease, and thus are indicative of intrinsic defects in immune responses to this commensal in inflammatory bowel disease (IBD).

Conclusions: Overall, our findings suggest a key role for OMVs generated by the commensal gut bacterium Bt in directing a balanced immune response to constituents of the microbiota locally and systemically during health which is altered in IBD patients. Video Abstract.

Keywords: Bacteroides thetaiotaomicron; Dendritic cells; Inflammatory bowel disease; Interleukin-10; Outer membrane vesicles.


Conflict of interest statement

The authors declare that they have no competing interests.

Figures

Fig. 1
Fig. 1
Bt OMVs stimulate production of immunoregulatory IL-10 from whole colonic biopsies and colonic LP DC. During normal anaerobic growth, Bt cells produce and release OMVs into the external milieu. a Electron microscope photograph of OMVs collected by sterile filtration of Bt culture supernatants through 0.22 μm membranes. Red arrows point to spherical nanostructures consisting of lipid bilayer. Scale bar, ~ 100 nm. Colonic biopsies taken from the rectosigmoid junction of healthy individuals were grown in a pIVOC system mucosal side up within Snapwell inserts for 6 h in IVOC medium with or without 108-109 Bt OMVs. b Following culture, biopsies were snap-frozen and cytokines and chemokines were measured within tissue lysates by LEGENDplex cytokine bead array. Amounts of MCP-1, IFN-γ, IL-8, IL-1β, IL-6, and IL-10 shown are mean ± SEM values from n = 4 healthy controls with two experimental replicates each. Statistical significance was determined using nonparametric Mann-Whitney U tests; *p < 0.05; **p < 0.01; ***p < 0.001. Five biopsies each from proximal and distal colon of healthy individuals were washed with DTT/EDTA and digested with collagenase/liberase to obtain total LP cells. Cells were then cultured for 20 h in the presence of either killed 107 Bt/mL or 1010 Bt OMV/mL in complete RPMI medium, and mDC were examined by flow cytometry. c Identification of mDC within the total LP cells. d Mean fluorescence intensity of HLA-DR on total mDC in response to medium only, Bt or Bt OMVs. Statistical significance was determined by one-way ANOVA with Dunnett’s multiple comparisons test; *p < 0.05. e Proportion of mDC expressing IL-6 (top panel) and IL-10 (bottom panel) within the colonic LP. Pooled data from n = 6 HC. Statistical significance was determined using non-parametric Kruskal-Wallis ANOVA with Dunn’s multiple comparisons test; *p < 0.05
Fig. 2
Fig. 2
Bt OMVs activate and stimulate both IL-6 and IL-10 expression from healthy circulating DC. PBMC were prepared from healthy individuals. a Following 20 h culture in the presence of Bt or varying concentrations of Bt OMVs, DC were identified within live cells as HLA-DR+ Lineage (CD3/14/16/19/34) cells and further subdivided into CD11c+ myeloid DC or CD123+ pDC. b Pooled data (n = 4) showing proportion of mDC (top panel) and pDC (bottom panel) expressing activation marker CD80. Statistical significance was determined by ordinary one-way ANOVA with Dunnett’s multiple comparisons test; *p < 0.05; **p < 0.01. c Intracellular cytokine expression by mDC in response to Bt and OMVs is shown as a proportion of mDC expressing IL-6 (top panel) or IL-10 (bottom panel). Statistical significance was determined by one-way ANOVA with Brown-Forsyth and Welch corrections for unequal variance and with Dunnett’s T3 multiple comparisons tests; *p < 0.05; **p < 0.01; ***p < 0.001. d Total amounts of secreted IL-6 (top panel) and IL-10 (bottom panel) were measured by ELISA in culture supernatants taken at 20 h. Data shown is pooled from n = 3-4 HC. Statistical significance was determined by ordinary one-way ANOVA with Dunnett’s multiple comparisons test (IL-10) or non-parametric Kruskal-Wallis ANOVA with Dunn’s multiple comparisons test (IL-6); *p < 0.05, **p < 0.01
Fig. 3
Fig. 3
Lack of IL-10 response from colonic DC to Bt OMVs in ulcerative colitis. Following 20 h culture of LP cells from five proximal and five distal colon biopsies from UC patients with Bt OMVs 1010/mL or medium only, DC cytokine responses were examined by FACS. a Pooled data (n = 3) showing proportions of mDC expressing IL-6 (top left) and IL-10 (top right) and representative FACS plots from one UC patient (bottom). b Comparison of proportions of mDC expressing IL-6 (top) and IL-10 (bottom) in UC (n = 3) to HC (n = 6). Statistical significance was determined using unpaired t tests; *p < 0.05
Fig. 4
Fig. 4
Loss of immunoregulatory IL-10 response by circulating DC to Bt OMVs in CD and UC. Whole PBMC were separated from blood of individuals with inactive Crohn’s Disease (CD) or inactive or active ulcerative colitis (UC) and intracellular cytokine analysis of mDC was examined by FACS. a Pooled data from inactive UC (n = 5) and CD (n = 5) patients show proportions of mDC expressing (a) IL-6 in response to Bt and Bt OMVs and compared to HC. b Pooled data from inactive UC (n = 5) show proportions of mDC expressing IL-10 in response to Bt and Bt OMVs and compared to HC. c Pooled data from inactive CD (n = 5) show proportions of mDC expressing IL-10 in response to Bt and Bt OMVs and compared to HC. Statistical significance was determined by Brown-Forsythe and Welch ANOVA for unequal variance with Dunnett’s T3 multiple comparisons test or two-way ANOVA with Holm Sidak’s multiple comparisons test; *p < 0.05, **p < 0.01, ***p < 0.001. d Pooled data from active UC (n = 3) showing proportions of mDC expressing IL-6 (top) or IL-10 (bottom) and comparison to HC. Statistical significance was determined by non-parametric Kruskal-Wallis ANOVA with Dunn’s multiple comparison test; *p < 0.05
Fig. 5
Fig. 5
Normal IL-10 response to other commensal bacterial species or OMVs in inactive UC. Whole PBMC from healthy individuals (n = 4) or individuals with inactive UC (n = 3) were cultured for 20 h in the presence of 19 species of killed commensal bacteria. a Pooled data showing proportions of mDC expressing IL-10 are shown as mean (+/− SEM). PBMC from healthy individuals (HC, n = 4-5) or inactive UC patients (n = 3) were cultured for 20 h in the presence of Pn and Pn OMVs at varying concentrations. b The proportion of mDC expressing IL-6 or IL-10 from HC is shown. c Proportions of mDC expressing IL-6 (top) and IL-10 (bottom) from inactive UC and compared to HC are shown. Statistical significance was determined by ordinary one-way ANOVA with Dunnett’s multiple comparisons test or two-way ANOVA with Holm Sidak’s multiple comparisons test; ****p < 0.0001

References

    1. Sender R, Fuchs S, Milo R. Revised estimates for the number of human and bacteria cells in the body. PLOS Biol. 2016;14:e1002533. - PMC - PubMed
    1. Luckey TD. Introduction to intestinal microecology. Am. J. Clin. Nutr. 1972;25:1292–1294. - PubMed
    1. Thursby E, Juge N. Introduction to the human gut microbiota. Biochem. J. 2017;474:1823–1836. - PMC - PubMed
    1. Moore WE, Holdeman LV. Human fecal flora: the normal flora of 20 Japanese-Hawaiians. Appl. Microbiol. 1974;27:961–979. - PMC - PubMed
    1. Human Microbiome Consortium Project. Structure, function and diversity of the healthy human microbiome. Nature. 2012;486:207–14. - PMC - PubMed

Publication types

LinkOut - more resources