. 2020 Jun 23;117(25):14331-14341.
doi: 10.1073/pnas.1916206117. Epub 2020 Jun 8.

Reversible suppression of T cell function in the bone marrow microenvironment of acute myeloid leukemia

Affiliations

Reversible suppression of T cell function in the bone marrow microenvironment of acute myeloid leukemia

Adam J Lamble et al. Proc Natl Acad Sci U S A. .

Abstract

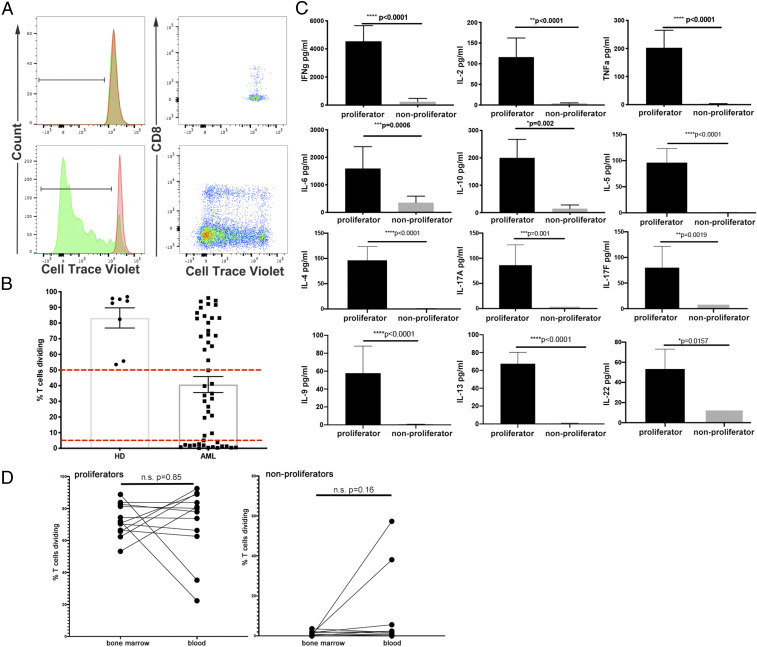
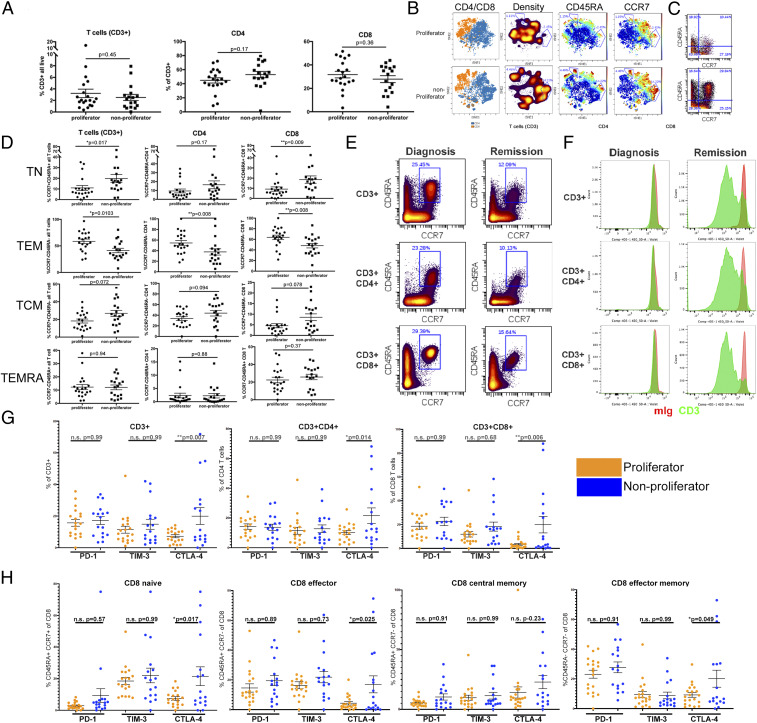
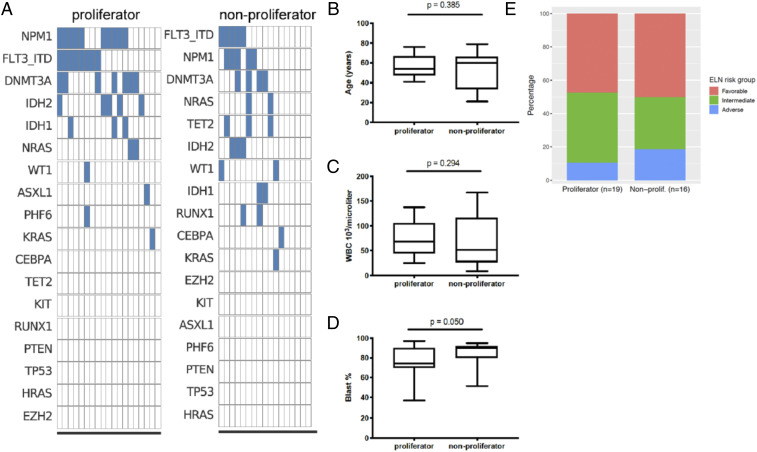
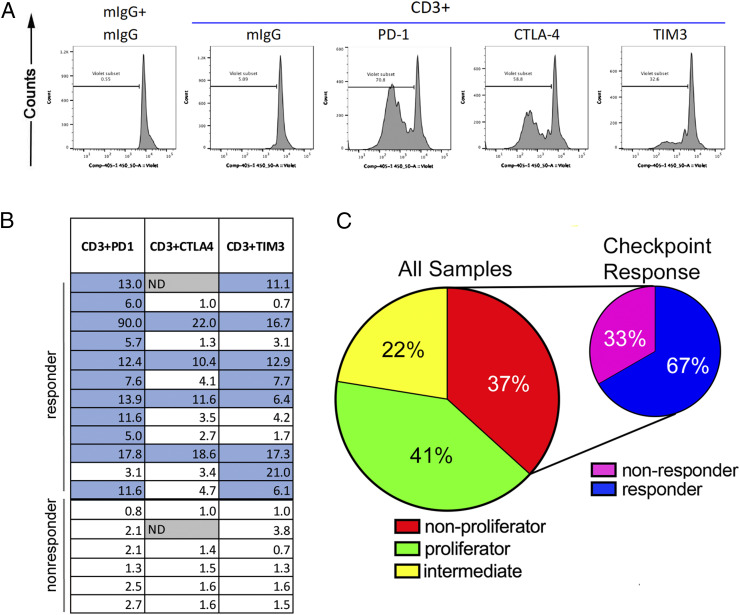
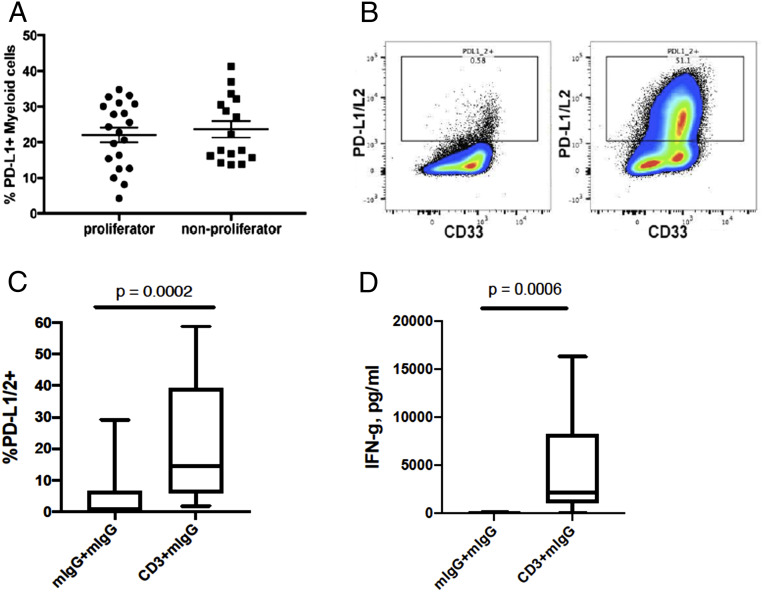
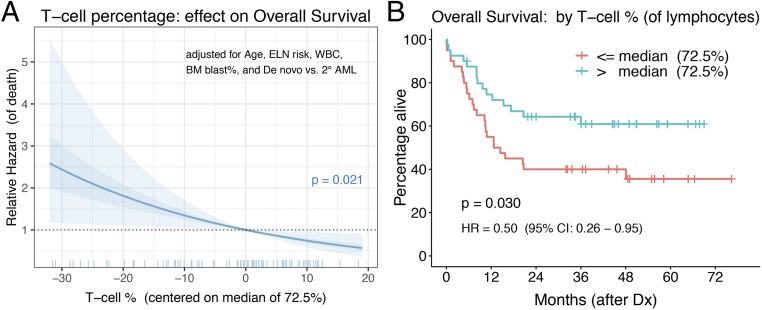
Acute myeloid leukemia (AML) is the most common acute leukemia in adults, with approximately four new cases per 100,000 persons per year. Standard treatment for AML consists of induction chemotherapy with remission achieved in 50 to 75% of cases. Unfortunately, most patients will relapse and die from their disease, as 5-y survival is roughly 29%. Therefore, other treatment options are urgently needed. In recent years, immune-based therapies have led to unprecedented rates of survival among patients with some advanced cancers. Suppression of T cell function in the tumor microenvironment is commonly observed and may play a role in AML. We found that there is a significant association between T cell infiltration in the bone marrow microenvironment of newly diagnosed patients with AML and increased overall survival. Functional studies aimed at establishing the degree of T cell suppression in patients with AML revealed impaired T cell function in many patients. In most cases, T cell proliferation could be restored by blocking the immune checkpoint molecules PD-1, CTLA-4, or TIM3. Our data demonstrate that AML establishes an immune suppressive environment in the bone marrow, in part through T cell checkpoint function.

Keywords: AML; T cell; checkpoint blockade; immune microenvironment; leukemia.


Conflict of interest statement

Competing interest statement: L.K.B., F.H., D.S., and H.A. are employees of Janssen Pharmaceuticals R&D, LLC. D.S. is currently an employee and holds stock in Genmab. C.V.L is an employee of Lab Connect LLC. J.N.S. receives research support form Kyn Therapeutics. B.J.D. has the following disclosures: Scientific Advisory Board for Aileron Therapeutics, ALLCRON, Cepheid, Vivid Biosciences, Celgene, RUNX1 Research Program, EnLiven Therapeutics, Gilead Sciences (inactive), Baxalta (inactive), Monojul (inactive); Scientific Advisory Board and Stock: Aptose Biosciences, Blueprint Medicines, Beta Cat, Iterion Therapeutics, Third Coast Therapeutics, GRAIL (inactive), CTI BioPharma (inactive); Scientific Founder: MolecularMD (inactive, acquired by ICON); Board of Directors and Stock: Amgen; Board of Directors: Burroughs Wellcome Fund, CureOne; Joint Steering Committee: Beat AML LLS; Founder: VB Therapeutics; Clinical Trial Funding: Novartis, Bristol-Myers Squibb, Pfizer; royalties from Patent 6958335 (Novartis exclusive license) and Oregon Health & Science University and Dana-Farber Cancer Institute (one Merck exclusive license). J.W.T. receives research support from Aptose, Array, AstraZeneca, Constellation, Genentech, Gilead, Incyte, Janssen, Petra, Seattle Genetics, Syros, and Takeda. J.W.T. is a cofounder of Leap Oncology. E.F.L. receives research support from Janssen Pharmaceuticals, Celgene Amgen, and Kyn Therapeutics.

Figures

Fig. 1.
Fig. 1.
Impaired T cell proliferation and cytokine production in response to TCR stimulation in a subset of patients with AML. (A) Proliferation of T cells from two representative AML samples. CTV dilution by T cells is shown as histograms (mIgG, red; anti-CD3, green) or dot plots (CTV vs. CD8) of a nonproliferator (Upper) or a proliferator (Lower). (B) Summary of T cell proliferation data for all AML (n = 49) and healthy donor (n = 8) samples from the functional assay cohort. Dashed horizontal lines indicate cutoffs for the proliferator group (proliferation value > 50%, n = 20) and the nonproliferator group (proliferation value < 5%, n = 18). (C) Cytokine measurements from supernatants of cultures incubated with anti-CD3 + mIgG, categorized as proliferators or nonproliferators (error bars = SEM). P values shown are from a Student’s t test between groups and have not been adjusted for multiple comparisons. (D) Comparison of T cell proliferation in matched blood and bone marrow samples. Data shown are percentage of T cells diluting CTV as in B. Samples are grouped into proliferators (Left, n = 12) and nonproliferators (Right, n = 10) as defined in B. Statistical test for D is paired Student’s t test.
Fig. 2.
Fig. 2.
Impaired T cell proliferation is associated with an increase in naïve CCR7+ CD45RA+ T cell phenotype. (A) Frequency of T cells of all live cells (Left) and frequency of CD4+ (Center) or CD8+ (Right) of T cells. (B) Concatenated files representing all samples in the proliferator group (Upper) or nonproliferator group (Lower) projected in tSNE after gating on CD3+ cells. Distribution of CD4+ and CD8+ T cell subsets is shown in blue and orange, respectively (first column). Density plots show regions with reduced representation in the proliferator samples (second column). Intensity of CD45RA and CCR7 are mapped to the projections (third and fourth columns). (C) Representative plots of CCR7 vs. CD45RA staining from a sample in each group. (D) Percentages of T cell subpopulations gated on all T cells (Left column), CD4+ T cells (Center column), or CD8+ T cells (Right column). Differences in phenotypic distribution of TN (CCR7+ CD45RA+, Upper), TEM (CCR7 CD45RA, second row), TCM (CCR7+ CD45RA, third row), and TEMRA (CCR7 CD45RA+, Lower) T cell subsets. (E) T cell phenotype in an individual patient at diagnosis and after chemotherapy-induced remission. Frequency of CCR7+ CD45RA+ for indicated T cell subsets at the time of diagnosis (Left column) and remission (Right column). (F) CTV dilution from sample in E in response to incubation with mIgG + mIgG (red histogram) or anti-CD3 + mIgG (green histogram). (G) Frequency of T cells positive for PD-1, TIM-3, and CTLA-4 as a percentage of all CD3+ (Left), and CD4+ (Center) or CD8+ (Right) T cells, comparing proliferators (orange) and nonproliferators (blue). (H) Percentage of cells positive for PD-1, TIM-3, and CTLA-4 on CD8+ TN, TEM, TCM, and TEMRA subsets as defined in D. Bars represent mean ± SEM. Statistical tests are Student’s t test for A and D, one-way ANOVA with multiple comparisons of groups shown. Bonferroni correction for multiple testing was used.
Fig. 3.
Fig. 3.
Comparison of clinical characteristics of proliferator and nonproliferator samples. (A) Mutations from whole exome sequencing, ranked in order of prevalence. (BD) Box-and-whisker plots denoting medians and interquartile ranges of (B) age of patient at time of sample collection, (C) WBC count in peripheral blood and (D) blast percentage in the bone marrow. P values are from the Kruskal–Wallis test. (E) ELN risk group distribution.
Fig. 4.
Fig. 4.
Impaired T cell proliferation in response to TCR ligation can be reversed by immune checkpoint blockade in a subset of patients. (A) A representative “checkpoint responder” showing CTV dilution with the addition of antibodies against PD-1, CTLA-4, and TIM3. (B) A summary of the responses of all nonproliferators to checkpoint molecule blockade. Numbers within boxes represent the fold-change in proliferation, as determined by the proliferation measured with anti-CD3 and PD-1, CTLA-4, or TIM3 antibody treatment divided by the proliferation with anti-CD3 + mIgG. Blue-shaded boxes indicate checkpoint responders, defined as samples with at least a five-fold increase in proliferation value when comparing anti-CD3 + checkpoint antibody to anti-CD3 + mIgG. (C) Summary of results from the the patient cohort assayed for T cell function (n = 49).
Fig. 5.
Fig. 5.
Induction of checkpoint molecules in response to T cell proliferation and IFN-γ production. (A) PD-L1 expression on myeloid cells (CD33+) from the bone marrow of patients with AML. (B) Representative PD-1 ligand staining of a proliferator sample after 5 d of culture with either mIgG + mIgG (Left) or anti-CD3 + mIgG (Right). (C and D) Box-and-whisker plots denoting medians and interquartile ranges of (C) frequency of PD-1 ligand expressing cells and (D) IFN-γ from the culture supernatants of proliferator samples, with or without TCR stimulation. P values for C and D are from two-tailed paired t test.
Fig. 6.
Fig. 6.
Association between T cell relative abundance and overall survival. The T cell percentage of bone marrow lymphocytes at the time of AML diagnosis was evaluated for its association with overall survival. (A) Relative hazard of death (i.e., HR of T cell percentages compared to the median value of 72.5%, indicated as 0 on the x axis) across the range of observed T cell percent, as estimated from a Cox regression model that includes patient age, ELN risk group, bone marrow WBC count, bone marrow blast percent, and AML type as covariates. The T cell percent (as a continuous measure) P value of 0.021 is from a Wald test. The shaded area denotes the simulation-derived 95% CI for the relative hazard (40). (B) Kaplan–Meier survival curves for “low” (red) and “high” (blue) T cell percentage groups, defined by dichotomizing on the sample median of 72.5%. The P value of 0.030 is from the log-rank (or score) test and HR of 0.50 is estimated from a univariable Cox model.

References

    1. Deschler B., Lübbert M., Acute myeloid leukemia: Epidemiology and etiology. Cancer 107, 2099–2107 (2006). - PubMed
    1. National Cancer Institute Surveillance , Epidemiology, and End Results Program, Cancer Stat Facts: Leukemia — Acute Myeloid Leukemia (AML). https://seer.cancer.gov/statfacts/html/amyl.html. Accessed 26 May 2020.
    1. Topalian S. L. et al., Safety, activity, and immune correlates of anti-PD-1 antibody in cancer. N. Engl. J. Med. 366, 2443–2454 (2012). - PMC - PubMed
    1. Hodi F. S. et al., Improved survival with ipilimumab in patients with metastatic melanoma. N. Engl. J. Med. 363, 711–723 (2010). - PMC - PubMed
    1. Postow M. A., Callahan M. K., Wolchok J. D., Immune checkpoint blockade in cancer therapy. J. Clin. Oncol. 33, 1974–1982 (2015). - PMC - PubMed

Publication types

MeSH terms