. 2020 Jun 23;117(25):14522-14531.
doi: 10.1073/pnas.2001270117. Epub 2020 Jun 8.

GPCR-dependent biasing of GIRK channel signaling dynamics by RGS6 in mouse sinoatrial nodal cells

Affiliations

GPCR-dependent biasing of GIRK channel signaling dynamics by RGS6 in mouse sinoatrial nodal cells

Allison Anderson et al. Proc Natl Acad Sci U S A. .

Abstract

How G protein-coupled receptors (GPCRs) evoke specific biological outcomes while utilizing a limited array of G proteins and effectors is poorly understood, particularly in native cell systems. Here, we examined signaling evoked by muscarinic (M2R) and adenosine (A1R) receptor activation in the mouse sinoatrial node (SAN), the cardiac pacemaker. M2R and A1R activate a shared pool of cardiac G protein-gated inwardly rectifying K+ (GIRK) channels in SAN cells from adult mice, but A1R-GIRK responses are smaller and slower than M2R-GIRK responses. Recordings from mice lacking Regulator of G protein Signaling 6 (RGS6) revealed that RGS6 exerts a GPCR-dependent influence on GIRK-dependent signaling in SAN cells, suppressing M2R-GIRK coupling efficiency and kinetics and A1R-GIRK signaling amplitude. Fast kinetic bioluminescence resonance energy transfer assays in transfected HEK cells showed that RGS6 prefers Gαo over Gαi as a substrate for its catalytic activity and that M2R signals preferentially via Gαo, while A1R does not discriminate between inhibitory G protein isoforms. The impact of atrial/SAN-selective ablation of Gαo or Gαi2 was consistent with these findings. Gαi2 ablation had minimal impact on M2R-GIRK and A1R-GIRK signaling in SAN cells. In contrast, Gαo ablation decreased the amplitude and slowed the kinetics of M2R-GIRK responses, while enhancing the sensitivity and prolonging the deactivation rate of A1R-GIRK signaling. Collectively, our data show that differences in GPCR-G protein coupling preferences, and the Gαo substrate preference of RGS6, shape A1R- and M2R-GIRK signaling dynamics in mouse SAN cells.

Keywords: G protein; Kir3; adenosine; heart rate; muscarinic.


Conflict of interest statement

The authors declare no competing interest.

Figures

Fig. 1.
Fig. 1.
Ado- and CCh-induced GIRK currents in SAN cells. (A and B) Whole-cell currents (Vhold = −70 mV) evoked by Ado (10 μM; A) or CCh (10 μM; B) in SAN cells from wild-type (Left, black) and Rgs6−/− (Right, red) mice; these currents were not observed in SAN cells from Girk4−/− mice (Bottom, blue). (Scale bars: 5 s/500 pA.) (C) Peak current density of responses elicited by Ado (Left) and CCh (Right) in SAN cells from wild-type (black) and Rgs6−/− (red) mice. There was a significant interaction between genotype and agonist (F1,49 = 14.9, P < 0.001; two-way ANOVA); group sizes ranged from 10 to 20 cells (5–7 mice). **P < 0.01 wild-type vs. Rgs6−/− (within agonist); ####P < 0.0001 Ado vs. CCh (wild-type). (D) Acute desensitization of responses elicited by Ado (Left) and CCh (Right) in SAN cells from wild-type (black) and Rgs6−/− (red) mice. Statistical analysis revealed a main effect of agonist (F1,49 = 30.4, P < 0.0001; two-way ANOVA), but no main effect of genotype (F1,49 = 0.13, P = 0.72; two-way ANOVA) or genotype x agonist interaction (F1,49 = 1.6, P = 0.21; two-way ANOVA); group sizes ranged from 9 to 19 cells (5–7 mice). (E) Activation rates of responses elicited by Ado (Left) and CCh (Right) in SAN cells from wild-type (black) and Rgs6−/− (red) mice. Statistical analysis revealed a genotype x agonist interaction (F1,45 = 6.8, P < 0.05; two-way ANOVA); group sizes ranged from 9 to 17 cells (5–7 mice). **P < 0.01 wild-type vs. Rgs6−/− (within agonist); ####P < 0.0001 Ado vs. CCh (wild type). (F) Deactivation rates of responses elicited by Ado (Left) and CCh (Right) in SAN cells from wild-type (black) and Rgs6−/− (red) mice. Statistical analysis revealed a genotype x agonist interaction (F1,48 = 8.0, P < 0.01; two-way ANOVA); group sizes ranged from 12 to 19 cells (5–7 mice). ***P < 0.001 wild-type vs. Rgs6−/− (within agonist); ###P < 0.001 Ado vs. CCh (wild type).
Fig. 2.
Fig. 2.
Impact of Rgs6 ablation on GIRK channel sensitivity to CCh and Ado. (A) Concentration-response experiments for Ado in SAN cells from wild-type (Scale bars: Top, 10 s/200 pA.) and Rgs6−/− (Scale bars: Bottom, 10 s/500 pA.) mice. (B and C) Summary of concentration-response experiments for Ado-induced currents in SAN cells from wild-type and Rgs6−/− mice. There was no difference in EC50 values for Ado-induced currents in SAN cells from wild-type (n = 24 cells/7 mice) and Rgs6−/− (n = 13 cells/5 mice) mice (t35 = 1.8, P = 0.08; unpaired t test). (D) Concentration-response experiments for CCh-induced currents in SAN cells from wild-type (Scale bars: Top, 10 s/200 pA.) and Rgs6−/− (Scale bars: Bottom, 10 s/500 pA.) mice. (E and F) Summary of concentration-response experiments of CCh-induced currents in SAN cells from wild-type and Rgs6−/− mice. The EC50 values for CCh-induced currents in SAN cells from Rgs6−/− (n = 12 cells/4 mice) mice were lower than the EC50 values measured in wild-type counterparts (n = 10 cells/4 mice) (t20 = 4.8, ***P < 0.001; unpaired t test).
Fig. 3.
Fig. 3.
CPA- and CCh-induced bradycardia in isolated hearts from wild-type and Rgs6−/− mice. (A) Segments of ECG traces from isolated wild-type (Top) and Rgs6−/− (Bottom) hearts perfused with the A1R-selective agonist CPA (30 nM). (Scale bar: 5 s.) (B) Percentage decrease in HR (relative to baseline) following perfusion of increasing concentrations of CPA in hearts from wild-type (n = 6), Rgs6−/− (n = 7), and Girk4−/− (n = 4) mice; there was a genotype x CPA concentration interaction for wild-type and Rgs6−/− hearts (F4,44 = 2.81; P < 0.05; two-way ANOVA with repeated measures). **P < 0.01 wild type vs. Rgs6−/−. (C) Segments of ECG traces of isolated wild-type (Top) and Rgs6−/− (Bottom) hearts perfused with CCh (1 μM). (Scale bar: 5 s.) (D) Percentage decrease in HR (relative to baseline) following perfusion of increasing concentrations of CCh in hearts from wild-type (n = 3), Rgs6−/− (n = 5), and Girk4−/− (n = 6) mice; there was a genotype x CCh concentration interaction for wild-type and Rgs6−/− hearts (F3,18 = 5.1, P < 0.05; two-way ANOVA with repeated measures). *P < 0.05 and ***0.001, respectively, wild type vs. Rgs6−/−.
Fig. 4.
Fig. 4.
Occlusion of CCh- and Ado-induced GIRK currents. (A) Occlusion experiments showing whole-cell currents elicited by a maximal concentration of CCh (10 μM), followed by Ado application (10 μM) in SAN cells from wild-type (Left) and Rgs6−/− (Right) mice. (Scale bars: 10 s/500 pA.) (B) There was no difference in the Ado-induced additive response in SAN cells isolated from wild-type (n = 9 cells/4 mice) and Rgs6−/− (n = 6 cells/5 mice) mice (t13 = 0.11, P = 0.91; unpaired t test). (C) Occlusion experiments showing whole-cell currents elicited by a maximal concentration of Ado (10 μM), followed by CCh application (10 μM) in SAN cells from wild-type (Left) and Rgs6−/− (Right) mice. (Scale bars: 10 s/500 pA.) (D) There was a significant difference in the CCh-induced additive response in SAN cells from wild-type (n = 7 cells/4 mice) and Rgs6−/− (n = 6 cells/4 mice) mice (t11 = 6.0; ****P < 0.0001; unpaired t test).
Fig. 5.
Fig. 5.
G protein coupling preferences of M2R and A1R. (A) Schematic representation of the BRET assay for real-time optical imaging of G protein activity. Agonist-induced activation of a GPCR leads to the dissociation of Gα-GTP and Venus-Gβγ subunits. The released Venus-Gβγ then interacts with the Gβγ effector mimetic masGRK3ct-Nluc-HA to produce the BRET signal. (B) Representative real-time monitoring of G protein activation by M2R (Top) or A1R (Bottom). HEK293T/17 cells were transfected with the BRET sensor pair (A) and GPCR, together with either GαoA (black) or Gαi1 (green). Acetylcholine (100 μM) or Ado (100 μM) was applied at the 5-s time point, and the BRET signal was followed across time. (C and D) G protein coupling summary diagrams for M2R and A1R. Maximum amplitudes (red) and activation rate constants (blue) for 15 different G proteins were normalized to the largest value and plotted in the wheel diagrams. Line thickness represents the SEM of three technical replicates performed independently.
Fig. 6.
Fig. 6.
Gα substrate specificity of RGS6/Gβ5. (A) Schematic representation of the BRET assay for measuring RGS GAP activity. Application of antagonist after G protein activation by a GPCR agonist initiates the deactivation of G proteins, decreasing the BRET signal. (B) Real-time monitoring of G protein deactivation. HEK293T/17 cells were transfected with D2R, Gα, Venus-Gβγ, and masGRK3ct-Nluc-HA with (red) or without (black) RGS6/Gβ5. Dopamine (100 μM) and haloperidol (100 μM) were applied to activate D2R and initiate G protein deactivation, respectively. Representative data from three independent experiments are shown. (C) Comparison of kGAP activity of RGS6/Gβ5 on the Gi/o isoforms (F5,12 = 372.6, P < 0.0001; one-way ANOVA). ****P < 0.0001 vs. Gαo isoforms.
Fig. 7.
Fig. 7.
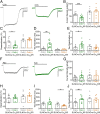
Impact of Gαo and Gαi2 ablation on CCh- and Ado-induced GIRK currents. (A) Whole-cell currents evoked by CCh (10 μM) in SAN cells from SLNCre(−):Gαofl/fl (Left, gray) and SLNCre(+):Gαofl/fl (Right, green) mice. (Scale bars: 5 s/500 pA.) (B and C) Peak CCh-induced current density (t20 = 4.3, ***P < 0.001; unpaired t test) and current desensitization (t19 = 2.6, *P < 0.05; unpaired t test) were smaller in SAN cells from SLNCre(+):Gαofl/fl mice as compared to their SLNCre(−):Gαofl/fl counterparts; group sizes ranged from 9 to 12 cells (5 mice) per genotype. There was no difference in CCh-induced current density (t13 = 0.4, P = 0.69; unpaired t test) or desensitization (t13 = 0.5, P = 0.62; unpaired t test) in SAN cells from SLNCre(−):Gαi2fl/fl mice and SLNCre(+):Gαi2fl/fl mice; group sizes ranged from 7 to 8 cells (3 mice) per genotype. (D and E) Activation (t19 = 3.0, **P < 0.01; unpaired t test) and deactivation (t18 = 2.5, *P < 0.05; unpaired t test) rates of CCh-induced currents were prolonged in SAN cells from SLNCre(+):Gαofl/fl mice, relative to SLNCre(−):Gαofl/fl counterparts; group sizes ranged from 8 to 12 cells (5 mice) per genotype. There was no difference in activation (t11 = 0.9, P = 0.38; unpaired t test) or deactivation (t13 = 1.0, P = 0.36; unpaired t test) rates of CCh-induced currents in SAN cells from SLNCre(−):Gαi2fl/fl and SLNCre(+):Gαi2fl/fl mice; group sizes ranged from 6 to 8 cells (3 mice) per genotype. (F) Whole-cell currents evoked by Ado (10 μM) in SAN cells from SLNCre(−):Gαofl/fl (Left, gray) and SLNCre(+):Gαofl/fl (Right, green) mice. (Scale bars: 5 s/500 pA.) (G and H) There was no difference in peak current density (t20 = 1.8, P = 0.08; unpaired t test) or desensitization (t21 = 0.9, P = 0.38; unpaired t test) of Ado-induced currents in SAN cells from SLNCre(−):Gαofl/fl and SLNCre(+):Gαofl/fl mice; group sizes ranged from 11 to 12 cells (4 mice) per genotype. There were no differences in Ado-induced current density (t13 = 0.1, P = 0.91; unpaired t test) or desensitization (t13 = 0.7, P = 0.51; unpaired t test) in SAN cells from SLNCre(−):Gαi2fl/fl and SLNCre(+):Gαi2fl/fl mice; group sizes ranged from 7 to 8 cells (3 mice) per genotype. (I and J) There was no difference in peak current density (t20 = 1.8, P = 0.08; unpaired t test) or desensitization (t21 = 0.9, P = 0.38; unpaired t test) of Ado-induced currents in SAN cells from SLNCre(−):Gαofl/fl and SLNCre(+):Gαofl/fl mice; group sizes ranged from 11 to 12 cells (4 mice) per genotype. There was an increase in activation rate (t13 = 2.2, *P < 0.05; unpaired t test) of Ado-induced currents in SAN cells from SLNCre(+):Gαi2fl/fl mice as compared to SLNCre(−):Gαi2fl/fl littermates. There was no difference in deactivation rate (t12 = 0.08, P = 0.94; unpaired t test) of Ado-induced currents in SAN cells from SLNCre(−):Gαi2fl/fl and SLNCre(+):Gαi2fl/fl mice; group sizes ranged from 7 to 8 cells (3 mice) per genotype.
Fig. 8.
Fig. 8.
Impact of Gαo or Gαi2 ablation on GIRK channel sensitivity to CCh and Ado. (A) Concentration-response experiments of CCh-induced currents in SAN cells from SLNCre(−):Gαofl/fl (Top) and SLNCre(+):Gαofl/fl (Bottom) mice. (B) Summary of CCh sensitivity experiments in SAN cells from SLNCre(−):Gαofl/fl and SLNCre(+):Gαofl/fl mice. (C) There was no difference in EC50 values of CCh-induced GIRK currents in SAN cells from SLNCre(−):Gαofl/fl (n = 12 cells/3 mice) and SLNCre(+):Gαofl/fl (n = 8 cells/3 mice) mice (t18 = 0.8, P = 0.44; unpaired t test), but there was a decrease in the EC50 value in SAN cells from SLNCre(+):Gαi2fl/fl (n = 5 cells/3 mice) compared to SLNCre(−):Gαi2fl/fl (n = 8 cells/3 mice) mice (t11 = 2.5, *P < 0.05; unpaired t test). (D) Concentration-response experiments of Ado-induced GIRK currents in SAN cells from SLNCre(−):Gαofl/fl (Top) and SLNCre(+):Gαofl/fl (Bottom) mice. (E) Summary of concentration-response experiments of Ado-induced GIRK currents in SAN cells from SLNCre(−):Gαofl/fl and SLNCre(+):Gαofl/fl mice. (F) The EC50 value for Ado-induced signaling in SAN cells from SLNCre(+):Gαofl/fl (n = 15 cells/3 mice) mice was lower than that measured in SAN cells from SLNCre(−):Gαofl/fl (n = 12 cells/3 mice) mice (t25 = 3.3, **P < 0.01; unpaired t test), but there was no difference in EC50 value in SAN cells from SLNCre(−):Gαi2fl/fl (n = 7 cells/3 mice) and SLNCre(+):Gαi2fl/fl (n = 7 cells/3 mice) mice (t12 = 1.0, P = 0.35; unpaired t test).

References

    1. Hauser A. S., Attwood M. M., Rask-Andersen M., Schiöth H. B., Gloriam D. E., Trends in GPCR drug discovery: New agents, targets and indications. Nat. Rev. Drug Discov. 16, 829–842 (2017). - PMC - PubMed
    1. Dyavanapalli J., Dergacheva O., Wang X., Mendelowitz D., Parasympathetic vagal control of cardiac function. Curr. Hypertens. Rep. 18, 22 (2016). - PubMed
    1. Dhein S., van Koppen C. J., Brodde O. E., Muscarinic receptors in the mammalian heart. Pharmacol. Res. 44, 161–182 (2001). - PubMed
    1. Sakmann B., Noma A., Trautwein W., Acetylcholine activation of single muscarinic K+ channels in isolated pacemaker cells of the mammalian heart. Nature 303, 250–253 (1983). - PubMed
    1. Logothetis D. E., Kurachi Y., Galper J., Neer E. J., Clapham D. E., The β γ subunits of GTP-binding proteins activate the muscarinic K+ channel in heart. Nature 325, 321–326 (1987). - PubMed

Publication types

MeSH terms

Substances