. 2020 Jul 16;133(14):jcs249557.
doi: 10.1242/jcs.249557.

GDNF drives rapid tubule morphogenesis in a novel 3D in vitro model for ADPKD

Affiliations

GDNF drives rapid tubule morphogenesis in a novel 3D in vitro model for ADPKD

Eryn E Dixon et al. J Cell Sci. .

Abstract

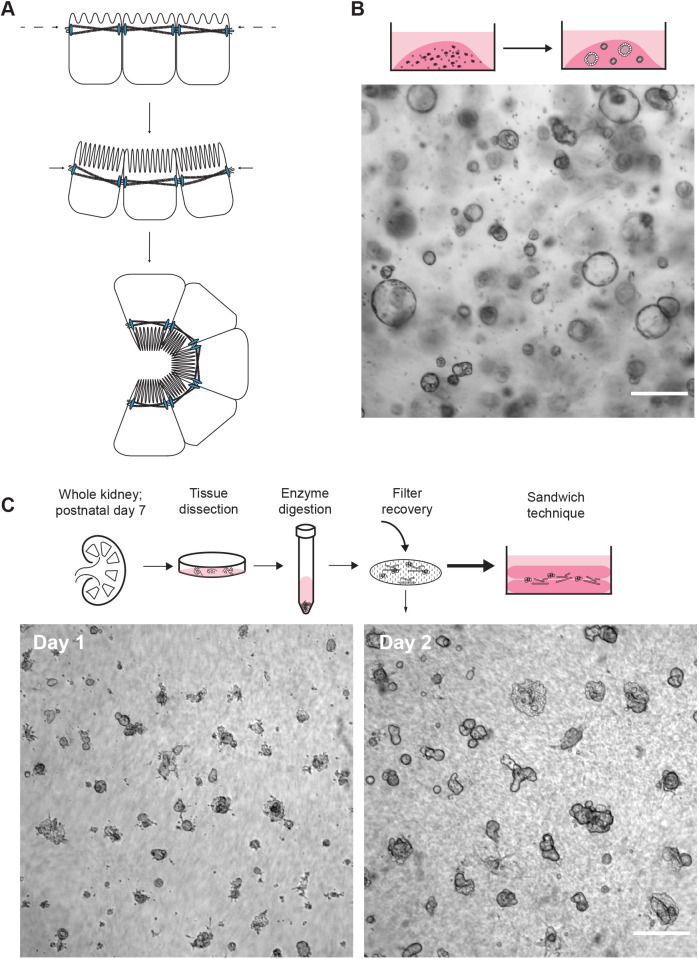
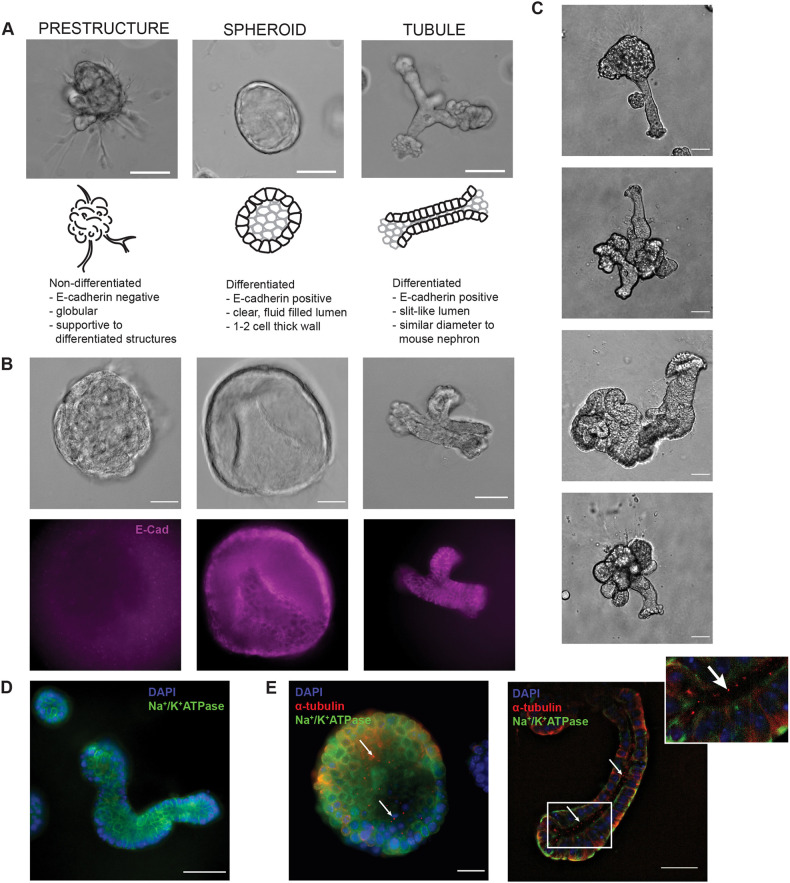
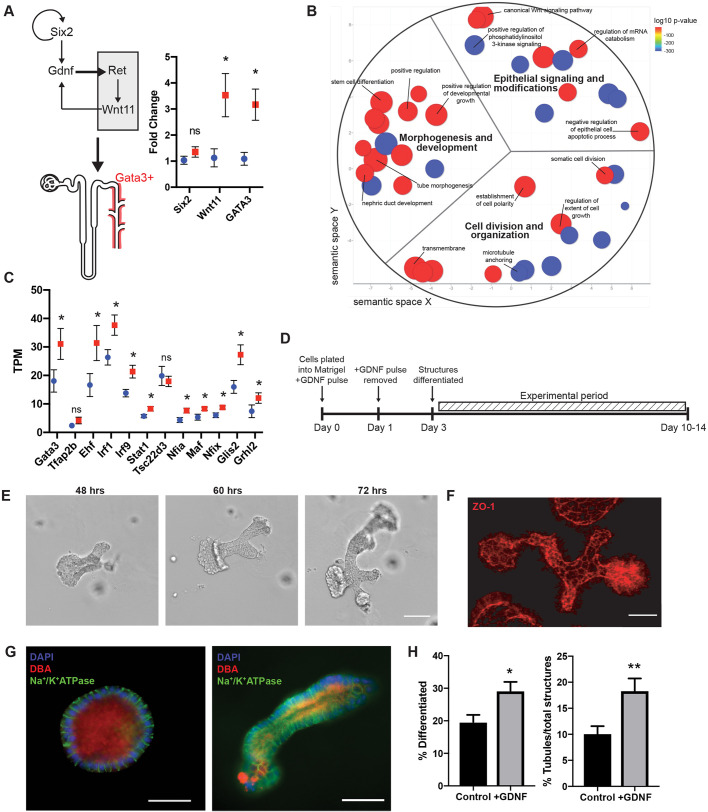
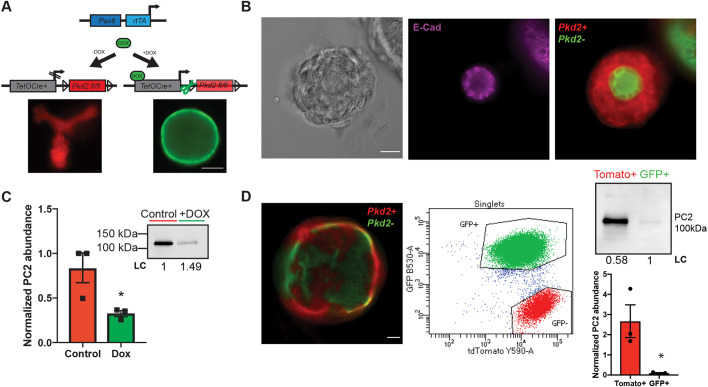
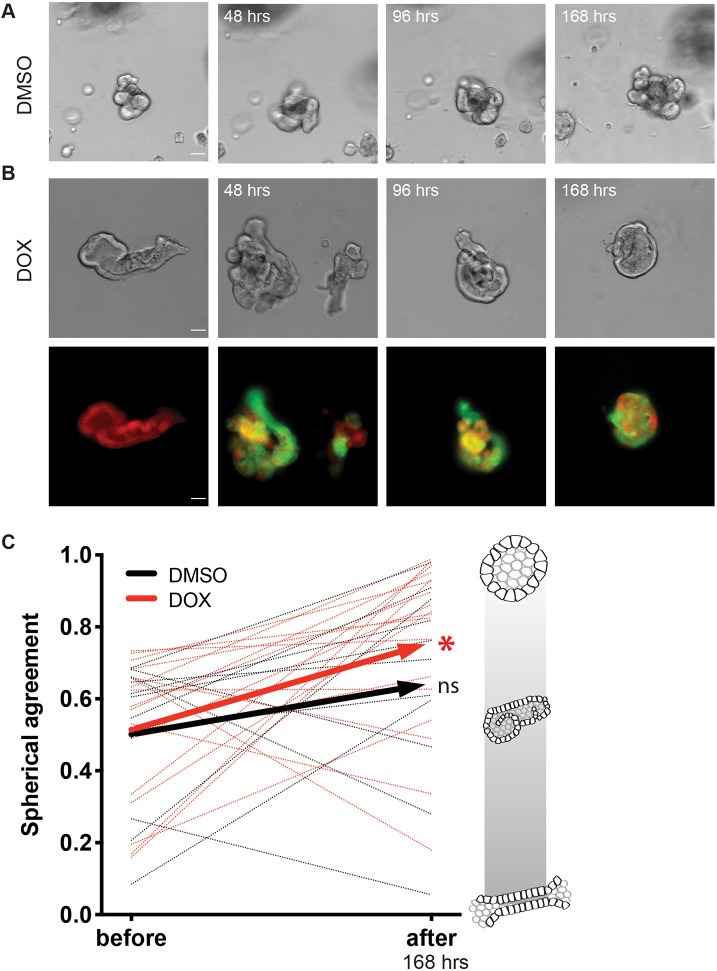
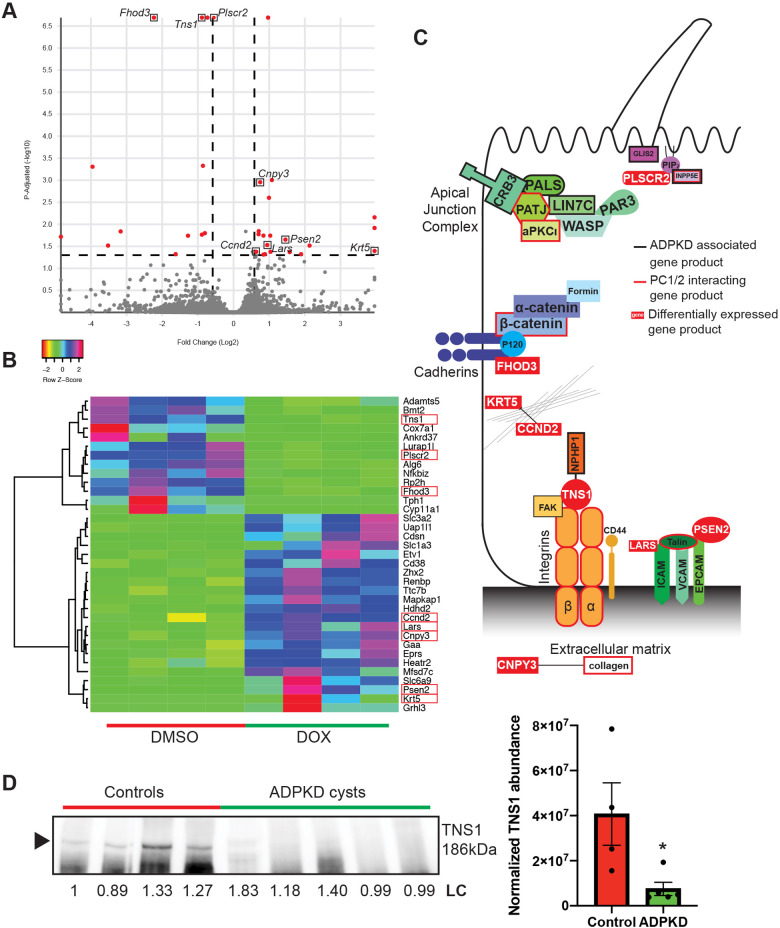
Cystogenesis is a morphological consequence of numerous genetic diseases of the epithelium. In the kidney, the pathogenic mechanisms underlying the program of altered cell and tubule morphology are obscured by secondary effects of cyst expansion. Here, we developed a new 3D tubuloid system to isolate the rapid changes in protein localization and gene expression that correlate with altered cell and tubule morphology during cyst initiation. Mouse renal tubule fragments were pulsed with a cell differentiation cocktail including glial-derived neurotrophic factor (GDNF) to yield collecting duct-like tubuloid structures with appropriate polarity, primary cilia, and gene expression. Using the 3D tubuloid model with an inducible Pkd2 knockout system allowed the tracking of morphological, protein, and genetic changes during cyst formation. Within hours of inactivation of Pkd2 and loss of polycystin-2, we observed significant progression in tubuloid to cyst morphology that correlated with 35 differentially expressed genes, many related to cell junctions, matrix interactions, and cell morphology previously implicated in cystogenesis.This article has an associated First Person interview with the first author of the paper.

Keywords: 3D cell model; Collecting duct; Epithelia; Kidney; Polycystic kidney disease; Tubulogenesis.


Conflict of interest statement

Competing interestsThe authors declare no competing or financial interests.

Figures

Fig. 1.
Fig. 1.
Rationale for 3D culture of primary cells. (A) Schematic representation of the change in morphology from 2D to 3D culture. (B) Immortalized single cells (Pkd2fl/fl Pax8rtTA TetOCre Sv40) are resuspended and cultured in Matrigel dots with renal growth factor medium. Spheroids develop from single cells and cellular aggregates. A representative bright-field image is shown. (C) Schematic representation of tubule fragment preparation from whole mouse kidney. Below, representative bright-field images show primary tubule fragments seeded between two layers of Matrigel on day 1 and day 2 of culture, demonstrating a succinct protocol for tubule development. Scale bars: 250 μm.
Fig. 2.
Fig. 2.
Characterization of unique 3D structures. (A) Representative bright-field image, schematic, and description for each class (prestructure, spheroid, and tubule) of organoid structures. Scale bars: 100 μm. (B) Bright-field images and corresponding immunofluorescence staining for E-cadherin (purple) in non-differentiated (E-cadherin negative; prestructures) and differentiated (E-cadherin positive; spheroids and tubules) structures. Scale bars: 50 μm. (C) Representative bright-field images of tubule development in the culture model. Tubules are often part of more complex 3D structures, including the globular, supportive prestructures. Scale bars: 25 μm. (D) Differentiated tubule structures demonstrate basolateral localization of Na+/K+-ATPase (green). Nuclei are stained with DAPI (blue). Scale bar: 50 μm. (E) Spheroids and tubules additionally demonstrate primary cilia, as indicated by acetyl-α-tubulin (red) puncta on the apical membrane. Basolateral Na+/K+-ATPase (green) and nuclear DAPI staining (blue) are also shown. Arrows indicate cilia, positively stained by acetyl-α-tubulin. Scale bars: 25 μm.
Fig. 3.
Fig. 3.
Effect of GDNF on organoid differentiation. (A) Schematic of the GDNF–Ret signaling axis that drives formation of the collecting duct system. Relative mRNA fold change between control (n=4 cultures for each group, blue circle) and GDNF pulse (n=4 cultures for each group, red square) organoids for the stem cell marker, Six2 (P=0.2854, two-tailed Student's t-test), and the downstream GDNF effectors Wnt11 and Gata3 (Wnt 11, P=0.0367; Gata3, P=0.0184; two-tailed Student's t-test). Data shown are mean±s.e.m. (B) ReviGO representation of significantly changed (nominal P<0.05) GO terms in GDNF pulsed organoids [n=4 cultures, dot size=log10 frequency (percentage of genes annotated) with that GO term (Supek et al., 2011), dot color=log10 P-value]. (C) Principal cell-specific transcription factors are significantly upregulated in GDNF pulsed tubuloids (n=4 cultures for each group, red square) when compared to controls (n=4 cultures for each group, blue circle). Significant upregulation of Gata3 (P=0.0499), Ehf (P=0.0455), Irf1(P=0.0225), Irf9 (P=0.0132), Stat1 (P=0.0220), Nfia (P=0.0168), Maf (P=0.0239), Nfix (P=0.0171), Glis2 (P=0.0175), and Grhl2 (P=0.0789) determined by one-tailed Student's t-test. Data shown are mean±s.e.m. (D) Schematic experimental paradigm for the GDNF pulse. (E) Morphometry tracking of tubuloids. Representative bright-field images of tracked tubule bifurcation events from 48 h to 72 h post-plating. Scale bar: 100 μm. (F) 3D SIM reconstruction of ZO-1 (red) to demonstrate junctional organization in tubuloid structures. Scale bars: 25 μm. (G) Immunofluorescence images of a differentiated spheroid and tubule positive for collecting duct marker, DBA (red) with basolateral Na+/K+-ATPase (green) and DAPI (blue). Scale bars: 50 μm. (H) Quantification of structure classification in bright-field images taken with 4× objective magnification reveals that the addition of GDNF yields more differentiated structures (P=0.0102; two-tailed Student's t-test) that are tubules (P=0.0091; two-tailed Student's t-test.) when compared to control. Data shown are mean±s.e.m. n=574 structures, three tubuloid preparations and three mice for control and n=526 structures, three tubuloid preparations and three mice for +GDNF. **P≤0.01; *P≤0.05; ns, not significant.
Fig. 4.
Fig. 4.
Addition of doxycycline results in inactivation of Pkd2 in 3D culture. (A) Schematic of genetics for inducible Cre model system used for Pkd2 inactivation. Representative images show structures expressing the mTmG reporter with (right, green) and without (left, red) addition of doxycycline (DOX) to induce Pkd2 inactivation. Scale bar: 100 μm. (B) Bright-field and immunofluorescence images demonstrating that epithelial cells (E-cadherin positive, purple) respond to doxycycline (Pkd2+, red; Pkd2−, green). Scale bar: 25 μm. (C) Western blot and quantification for PC2 abundance, normalized to total loaded protein (LC). Data shown are mean±s.e.m. n=3 tubuloid preparations from individual animals. P=0.0420 (two-tailed Student's t-test). (D) Fluorescence image showing heterogenous inactivation of Pkd2fl/fl via the double membrane reporter mTmG, with Pkd2+ cells shown in red and Pkd2− cells in green. Fluorescence activated single cell sorting (n=1.58×10⁶ cells for GFP+ and 213,000 cells for GFP−) of Pkd2fl/fl Pax8rtTA TetOCre +mTmG primary cells following treatment with doxycycline. Western blotting confirms a significant decrease in PC2 abundance in green fluorescing cells, normalized to total loaded protein (LC). Data shown are mean±s.e.m. P=0.0336 (two-tailed Student's t-test). Scale bar: 50 μm. *P≤0.05.
Fig. 5.
Fig. 5.
Loss of Pkd2 changes tubuloid morphology. (A) Bright-field images of a tracked control tubuloid before and after the addition of DMSO at 48, 96, and 168 h timepoints. (B) Bright-field tracking with corresponding fluorescence of +mTmG reporter following morphometrical changes before addition of doxycycline and at 48, 96, and 168 h timepoints post doxycycline (DOX) treatment. (C) Tubuloids treated with doxycycline demonstrate a significant (*P≤0.01) increase in spherical agreement, or spheroid likeness, when comparing morphometry before and after inactivation of Pkd2 (n=20 differentiated structures, red dotted lines; two-tailed P=0.0072, before and after paired t-test). Control structures (DMSO) do not significantly change over the same 168 h timecourse (n=20 differentiated structures, black dotted lines; two-tailed P=0.1746, before and after paired t-test). Average of doxycycline-treated (red) and DMSO-treated (black) tubules change in spherical agreement represented by solid lines. Scale of spherical agreement is shown with schematic renderings of tubule (0) to spheroid (1). Scale bar: 50 μm.
Fig. 6.
Fig. 6.
Differentially expressed ADPKD related genes. (A) Volcano plot representing differentially expressed genes (red) in doxycycline-treated organoids (Pkd2-) with adjusted P≤0.05 and fold change ≥1.5 (n=4 cultures for each group). (B) Heatmap showing directionality of expression for significantly (adjusted P≤0.05) altered genes in doxycycline-treated organoids compared to controls. Genes involved in junctions and the matrix are highlighted with red boxes. (C) Schematic of proteins that have been reported as ADPKD associated (black outline) or reported/predicted to interact with PC1 or PC2 (red outline). Proteins encoded by differentially expressed genes are shown in relationship to the other complexes and highlighted by white text in a red box. (D) Western blotting reveals a significant decrease in tensin-1 (TNS1) in human male ADPKD cysts (n=5 cysts) compared to normal human male kidneys (n=4 control samples), normalized to total loaded protein (LC). Arrowhead indicates the TNS1 band. Data shown are mean±s.e.m. P=0.0340 (two-tailed Student's t-test). *P≤0.05.

References

    1. Antignac C., Calvet J. P., Germino G. G., Grantham J. J., Guay-Woodford L. M., Harris P. C., Hildebrandt F., Peters D. J. M., Somlo S., Torres V. E. et al. (2015). The future of polycystic kidney disease research—as seen by the 12 Kaplan Awardees. J. Am. Soc. Nephrol. 26, 2081 10.1681/ASN.2014121192 - DOI - PMC - PubMed
    1. Arthur J. M. (2000). The MDCK cell line is made up of populations of cells with diverse resistive and transport properties. Tissue Cell 32, 446-450. 10.1054/tice.2000.0135 - DOI - PubMed
    1. Babicki S., Arndt D., Marcu A., Liang Y., Grant J. R., Maciejewski A. and Wishart D. S. (2016). Heatmapper: web-enabled heat mapping for all. Nucleic Acids Res. 44, W147-W153. 10.1093/nar/gkw419 - DOI - PMC - PubMed
    1. Benton G., Arnaoutova I., George J., Kleinman H. K. and Koblinski J. (2014). Matrigel: from discovery and ECM mimicry to assays and models for cancer research. Adv. Drug Deliv. Rev. 79-80, 3-18. 10.1016/j.addr.2014.06.005 - DOI - PubMed
    1. Benzing T., Gerke P., Höpker K., Hildebrandt F., Kim E. and Walz G. (2001). Nephrocystin interacts with Pyk2, p130(Cas), and tensin and triggers phosphorylation of Pyk2. Proc. Natl. Acad. Sci. USA 98, 9784-9789. 10.1073/pnas.171269898 - DOI - PMC - PubMed

Publication types

Substances