. 2020 Jul 15;40(29):5681-5696.
doi: 10.1523/JNEUROSCI.2876-19.2020. Epub 2020 Jun 8.

Acute Inflammation Alters Brain Energy Metabolism in Mice and Humans: Role in Suppressed Spontaneous Activity, Impaired Cognition, and Delirium

Affiliations

Acute Inflammation Alters Brain Energy Metabolism in Mice and Humans: Role in Suppressed Spontaneous Activity, Impaired Cognition, and Delirium

John Kealy et al. J Neurosci. .

Abstract

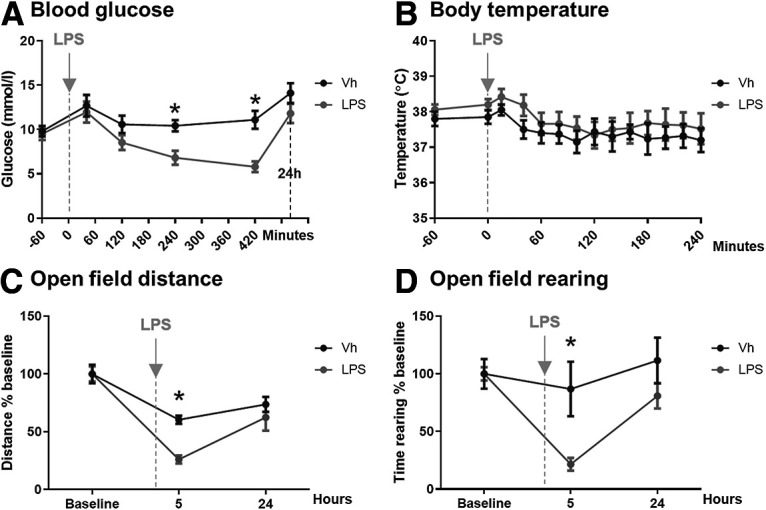
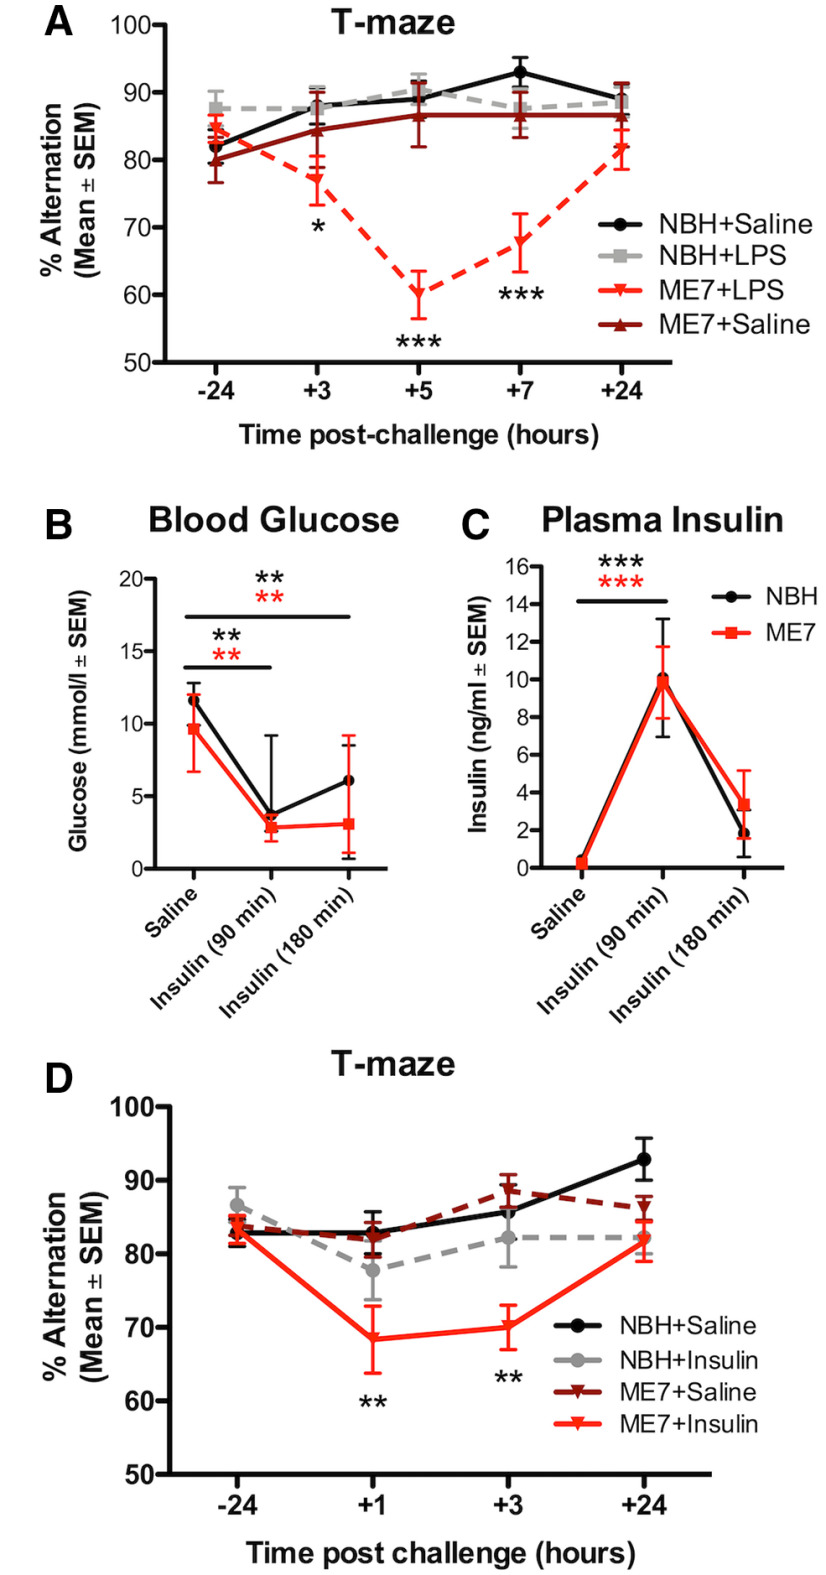
Systemic infection triggers a spectrum of metabolic and behavioral changes, collectively termed sickness behavior, which while adaptive, can affect mood and cognition. In vulnerable individuals, acute illness can also produce profound, maladaptive, cognitive dysfunction including delirium, but our understanding of delirium pathophysiology remains limited. Here, we used bacterial lipopolysaccharide (LPS) in female C57BL/6J mice and acute hip fracture in humans to address whether disrupted energy metabolism contributes to inflammation-induced behavioral and cognitive changes. LPS (250 µg/kg) induced hypoglycemia, which was mimicked by interleukin (IL)-1β (25 µg/kg) but not prevented in IL-1RI-/- mice, nor by IL-1 receptor antagonist (IL-1RA; 10 mg/kg). LPS suppression of locomotor activity correlated with blood glucose concentrations, was mitigated by exogenous glucose (2 g/kg), and was exacerbated by 2-deoxyglucose (2-DG) glycolytic inhibition, despite preventing IL-1β synthesis. Using the ME7 model of chronic neurodegeneration in female mice, to examine vulnerability of the diseased brain to acute stressors, we showed that LPS (100 µg/kg) produced acute cognitive dysfunction, selectively in those animals. These acute cognitive impairments were mimicked by insulin (11.5 IU/kg) and mitigated by glucose, demonstrating that acutely reduced glucose metabolism impairs cognition selectively in the vulnerable brain. To test whether these acute changes might predict altered carbohydrate metabolism during delirium, we assessed glycolytic metabolite levels in CSF in humans during inflammatory trauma-induced delirium. Hip fracture patients showed elevated CSF lactate and pyruvate during delirium, consistent with acutely altered brain energy metabolism. Collectively, the data suggest that disruption of energy metabolism drives behavioral and cognitive consequences of acute systemic inflammation.SIGNIFICANCE STATEMENT Acute systemic inflammation alters behavior and produces disproportionate effects, such as delirium, in vulnerable individuals. Delirium has serious short and long-term sequelae but mechanisms remain unclear. Here, we show that both LPS and interleukin (IL)-1β trigger hypoglycemia, reduce CSF glucose, and suppress spontaneous activity. Exogenous glucose mitigates these outcomes. Equivalent hypoglycemia, induced by lipopolysaccharide (LPS) or insulin, was sufficient to trigger cognitive impairment selectively in animals with existing neurodegeneration and glucose also mitigated those impairments. Patient CSF from inflammatory trauma-induced delirium also shows altered brain carbohydrate metabolism. The data suggest that the degenerating brain is exquisitely sensitive to acute behavioral and cognitive consequences of disrupted energy metabolism. Thus "bioenergetic stress" drives systemic inflammation-induced dysfunction. Elucidating this may offer routes to mitigating delirium.

Keywords: IL-1; cognitive; delirium; dementia; hypoglycemia; sepsis.


Figures

Figure 1.
Figure 1.
LPS and IL-1β significantly lower blood glucose concentrations. A, Timeline for treatments and sampling times. Blood sampling was from tail vein, aside from the 24 hours (h) time point where glucose levels were measured from right atrial blood before transcardial perfusion. In one cohort, mice were euthanized at 2 and 6 h post-LPS challenge to collect plasma for the IL-1β Enzyme linked immunoabsorbent assay (ELISA). B, LPS treatment (250 μg/kg, i.p.) significantly increased plasma IL-1β (F(1,22) = 36.71; p < 0.0001; n = 8 for saline/2 h group; n = 6 for other groups). C, LPS treatment (n = 7) significantly reduced glucose levels over 24 h compared with saline controls (0.9%, i.p.; n = 6); main effect of treatment (F(1,44) = 24.10; p = 0.0005). D, IL-1β (25 μg/kg, i.p.; n = 7) reduced systemic glucose and IL-1β's effect can be blocked using IL-1RA (10 mg/kg, i.p.; n = 7). Main effect of treatment (F(2,85) = 3.843; p = 0.0420); **significantly lower glucose levels in IL-1β+saline-treated mice compared with controls (n = 6) at 1 and 3 h postchallenge. E, c57BL/6J mice, both LPS (n = 6) and IL-1β (n = 5) significantly reduced blood glucose 4 h postchallenge versus saline controls (n = 6), while in IL-1R1−/− mice, LPS (n = 6) but not IL-1 (n = 6) significantly reduced blood glucose versus controls (n = 6). Significant pairwise comparisons by Bonferroni post hoc test after a main effect of treatment (F(2,29) = 21.81; p < 0.0001) are annotated by * (p < 0.05) and *** (p < 0.001). F, Time course of changes in blood glucose in IL-1R1−/− (n = 5) and c57BL/6J mice (n = 7; significant effect of genotype, F(1,40) = 5.673; p = 0.0385, but no pairwise differences at any time point). G, IL-1RA (10 mg/kg, n = 12) administered immediately after LPS treatment modestly attenuated LPS-induced reductions in glucose (F(2,132) = 16.18; p < 0.0001), but this was a transient effect (F(4,132) = 39.08; p < 0.001). There was a significant interaction of treatment and time (F(8,132) = 3.502; p = 0.0011), and post hoc tests indicated that LPS+saline-treated mice (n = 12) had significantly lower blood glucose levels versus saline (n = 12) at 2, 4 and 6 h postchallenge, while LPS+IL-1RA (n = 12) did not significantly decrease glucose levels compared with controls until 4 h. All annotated Bonferroni post hoc tests were performed after significant main effects or interactions in ANOVA analysis: *p < 0.05, **p < 0.01, ***p < 0.001. All data are expressed as mean ± standard error of the mean (SEM).
Figure 2.
Figure 2.
The impact of systemically applied LPS on blood glucose, body temperature and activity. A, Blood glucose. Effect of systemic LPS on blood glucose levels from 60 min before the challenge to 24 h after it. LPS (250 µg/kg, i.p.; n = 8) induced a significant decrease of blood glucose levels at 240 min (p = 0.0206) and 420 min (p = 0.007) when compared with vehicle-treated (Vh) animals (n = 8). Main effect of treatment (F(1,14) = 9.74; p = 0.0075) and time (F(3,40) = 11.09). No difference was found at 24 h after LPS (p = 0.66). B, Body temperature. Effect of systemic LPS challenge (250 µg/kg, i.p.; n = 5) on body temperature as measured using subcutaneous temperature transponders. No differences were found when compared with vehicle-treated (Vh) animals (n = 6). Main effect of time (F(3,24) = 5.166; p = 0.0082). C, Open field distance. Effects of systemic LPS in the open field test. LPS (250 µg/kg, i.p.; n = 8) significantly decreased the traveled distance at 5 h (p < 0.0001) when compared with vehicle-treated (Vh) group (n = 12). Main effect of treatment (F(1,18) = 6.43; p = 0.0207) and time (F(1,22) = 29.46; p < 0.0001). D, Open field rearing. Time spent rearing was significantly decreased by LPS (250 µg/kg, i.p.; n = 8) at 5 h (p = 0.0266) in comparison with vehicle-treated (Vh) mice (n = 12). Main effect of treatment (F(1,15) = 10.11; p = 0.0062) and time (F(1,20) = 9.458; p = 0.0035). All annotated Bonferroni post hoc tests were performed after significant main effects or interactions in ANOVA analysis: *p < 0.05. All data are expressed as mean ± SEM.
Figure 3.
Figure 3.
Low blood glucose concentration drives LPS-induced hypoactivity. A, Linear regression analyses of locomotor activity (squares crossed/3 min) versus blood glucose concentration (mmol/l) in animals challenged with saline (n = 14) and LPS (n = 17). Blood glucose concentrations significantly correlated with locomotor activity in LPS-treated mice. B, LPS significantly reduces spontaneous activity in the open field compared with saline-treated controls. Prompting inactive mice to move by gently nudging them with a fingertip results in similar levels of activity, showing that LPS mice are capable of moving but are not motivated to do so. C, Timeline for treatments and sampling times. Glucose (2 g/kg, i.p.) was administered 1.5 h post-LPS challenge (250 µg/kg, i.p.), and open field behavior was measured 2 h post-LPS challenge. Five minutes after open field testing, mice were euthanized, CSF samples taken, blood glucose levels assessed, and plasma collected for IL-1β ELISA. In one group, 2-DG (2 g/kg, i.p.) was given 3 h before LPS. D, LPS (250 μg/kg, i.p.; n = 8) induced IL-1β production (F(1,25) = 29.88; p < 0.001), which was unaffected by glucose co-administration (n = 7; 90 min post-LPS) but blocked by 2-DG administration (intraperitoneal, n = 5, #p = 0.0296 vs LPS+saline). E, Locomotor activity was suppressed by LPS (main effect of LPS: F(1,27) = 13.39; p = 0.0011) but rescued by glucose co-administration (interaction between treatments: F(1,27) = 10.48; p = 0.0032); **significant difference between LPS+glucose (n = 9) and LPS+saline (n = 8), and these were not significantly different to saline+saline (n = 7) or saline+glucose controls (n = 7). 2-DG+LPS completely suppressed locomotor activity in LPS-treated mice (t(13) = 5.766; ###p < 0.0001 vs LPS+saline). F, Blood glucose was suppressed by LPS (main effect: F(1,27) = 60.00; p < 0.0001) and modestly increased by glucose (main effect: F(1,27) = 6.721; p = 0.0152), and post hoc tests showed that LPS+glucose was significantly different to LPS+saline. G, Glucose treatment 1.5 h after LPS provided significant but transient protection against LPS-induced hypoglycemia. H, CSF (from the same animals) showed a main effect of LPS (F(1,22) = 39.85; p < 0.0001) and a strong main effect of glucose (F(1,22) = 14.57; p = 0.0009). LPS+glucose was significantly different to LPS+saline in post hoc analysis (p < 0.05). Two data points in these analyses represent two pooled samples each (in the saline+glucose and LPS+saline groups where some CSF samples were too low in volume to be assessed). They have been highlighted as slightly larger, filled symbols. I, CSF lactate levels (same animals) were not altered by the treatments described. Again, the same samples were pooled for this analysis. In LPS-naive mice, 2-DG on its own does not significantly affect (J) spontaneous activity nor does it: have any effect on (K) blood glucose. Significance levels for Bonferroni post hoc tests: *p < 0.05, **p < 0.01, ***p < 0.001. All data are expressed as mean ± SEM.
Figure 4.
Figure 4.
Insulin-induced reductions in blood glucose produces acute cognitive dysfunction selectively in mice with prior neurodegeneration. A, ME7 mice have a cognitive vulnerability under LPS treatment (n = 26) that was not present in NBH mice treated with LPS (n = 21). Saline does not induce cognitive deficits either in NBH (n = 20) or in ME7 (n = 9) mice. There was an interaction between treatment group and time (F(12,288) = 5.00; p < 0.0001). Blood glucose (mmol/l; B) and plasma insulin concentrations (C) in saline-treated or insulin-treated (11.5 IU/kg, i.p.) NBH and ME7 mice. There were similar reductions in blood glucose (B, main effect of insulin, F(2,20) = 17.11; p < 0.0001) and equivalent insulin concentrations over 180 min in ME7 and NBH animals (C, main effect of insulin, F(2,28) = 22.86; p < 0.0001). D, T-maze alternation in ME7 and NBH mice postchallenge with saline or insulin (+1 h = 40–160 min; and +3 h = 160–300 min postinsulin). Testing was performed earlier than in LPS-treated mice as insulin produces a more rapid decrease in blood glucose. There was a significant main effect of insulin (F(3,135) = 7.418; p = 0.0004) and an interaction of ME7 and insulin (F(9,135) = 3.050; p = 0.0024). ME7+insulin-treated mice (n = 12) had significantly lower alternation scores compared with NBH+saline controls (n = 7) at 1 and 3 h post-injection (NBH+insulin: n = 9; ME7+saline: n = 13). All data expressed as mean and standard error of the mean (SEM). Significance levels for Bonferroni post hoc tests: *p < 0.05, **p < 0.01, ***p < 0.001.
Figure 5.
Figure 5.
LPS-induced cognitive dysfunction in mice with prior neurodegeneration can be ameliorated by glucose administration. After 5 h, LPS produced equivalent decrease in glucose concentration in blood (A) and CSF glucose in ME7 (n = 7) and NBH mice (n = 7; B) compared with their respective saline-treated controls (n = 11 and n = 10, respectively). There were main effects of LPS on blood glucose (F(1,31) = 118.3; p < 0.0001) and on CSF glucose (F(1,22) = 146.5; p < 0.0001) and also an effect of disease on CSF glucose (F(1,22) = 6.665; p = 0.0170), with ME7+saline > NBH+saline by post hoc analysis. C, There were no differences in CSF lactate levels. D, T-maze alternation in ME7 mice postchallenge with saline or LPS, co-treated with glucose (2 g/kg) or saline. LPS+saline group (n = 20) showed robust cognitive impairment, but the LPS+glucose group (n = 19) showed significant attenuation. Two-way repeated measures ANOVA showed a main effect of LPS (F(3,240) = 13.75; p < 0.0001) and an interaction of LPS and glucose (F(12,240) = 3.740; p < 0.0001). LPS+glucose mice performed significantly better than the LPS+saline group at 5 h postchallenge (##p < 0.01). Significance levels for Bonferroni post hoc tests: *p < 0.05, **p < 0.01, ***p < 0.001.
Figure 6.
Figure 6.
Derangement of energy metabolism in human delirium. Metabolite levels in the CSF of hip fracture patients with delirium (n = 40) at the time of CSF sampling compared with age-matched patients with no delirium at any point of their hospital stay (n = 32). A, Glucose levels in delirium (n = 39, one sample omitted due to a read error) and non-delirium cases were not significantly different (Mann–Whitney U = 606.5; p = 0.8442). B, Patients with delirium had significantly higher levels of lactate in their CSF compared with controls (U = 442.5; p = 0.0128). C, Lactate levels in the CSF of hip fracture patients with dementia (n = 59) at the time of CSF sampling compared with age-matched patients with no dementia (n = 55; no significant difference in CSF lactate U = 1438; p = 0.2954). D, Patients with delirium showed significantly higher pyruvate levels compared with controls (U = 514.5; p = 0.0494), with all levels below the minimum detectable level (4 µmol/l) entered as 50% of this LOD (i.e., 2 µmol/ml). E, In addition, pyruvate was detected significantly more often in patients with delirium compared with patients without delirium at time of CSF sampling (Fisher's exact test, p = 0.0306). F, The LGR for patients with delirium (n = 39) was significantly higher compared with controls (U = 399.5; p = 0.0048). G, LPS significantly increased the CSF LGR in both ME7 (n = 7) and NBH mice (n = 7) compared with their respective saline-treated controls (n = 7 and n = 5; F(1,22) = 44.58; p < 0.0001). Significance levels for Mann-Whitney U tests (B, D and F) are annotated by *p < 0.05, **p < 0.01, for Fisher's exact test (E) by *p < 0.05 and for Bonferroni post-hoc tests (G) by ***p < 0.001.

Comment in

  • This Is Your Brain on (Low) Glucose.
    Miller-Rhodes P, Gelbard HA, Terrando N. Miller-Rhodes P, et al. Trends Neurosci. 2020 Dec;43(12):933-935. doi: 10.1016/j.tins.2020.09.002. Epub 2020 Sep 17. Trends Neurosci. 2020. PMID: 32951858 Free PMC article.

References

    1. Agwunobi AO, Reid C, Maycock P, Little RA, Carlson GL (2000) Insulin resistance and substrate utilization in human endotoxemia. J Clin Endocrinol Metab 85:3770–3778. 10.1210/jcem.85.10.6914 - DOI - PubMed
    1. American Psychiatric Association (2013) Neurocognitive disorders - delirium. In: Diagnostic and statistical manual of mental disorders, Ed 5, pp 596–601. Washington, DC: American Psychiatric Association.
    1. Banks WA, Robinson SM (2010) Minimal penetration of lipopolysaccharide across the murine blood-brain barrier. Brain Behav Immun 24:102–109. 10.1016/j.bbi.2009.09.001 - DOI - PMC - PubMed
    1. Besedovsky HO, Del Rey A (2010) Interleukin-1 resets glucose homeostasis at central and peripheral levels: relevance for immunoregulation. Neuroimmunomodulation 17:139–141. 10.1159/000258707 - DOI - PubMed
    1. Beverly JL, de Vries MG, Beverly MF, Arseneau LM (2000) Norepinephrine mediates glucoprivic-induced increase in GABA in the ventromedial hypothalamus of rats. Am J Physiol Regul Integr Comp Physiol 279:R990–R996. 10.1152/ajpregu.2000.279.3.R990 - DOI - PubMed

Publication types

MeSH terms