. 2020 Jul 15;40(29):5518-5530.
doi: 10.1523/JNEUROSCI.2748-19.2020. Epub 2020 Jun 8.

Differential Coassembly of α1-GABAARs Associated with Epileptic Encephalopathy

Affiliations

Differential Coassembly of α1-GABAARs Associated with Epileptic Encephalopathy

Saad Hannan et al. J Neurosci. .

Abstract

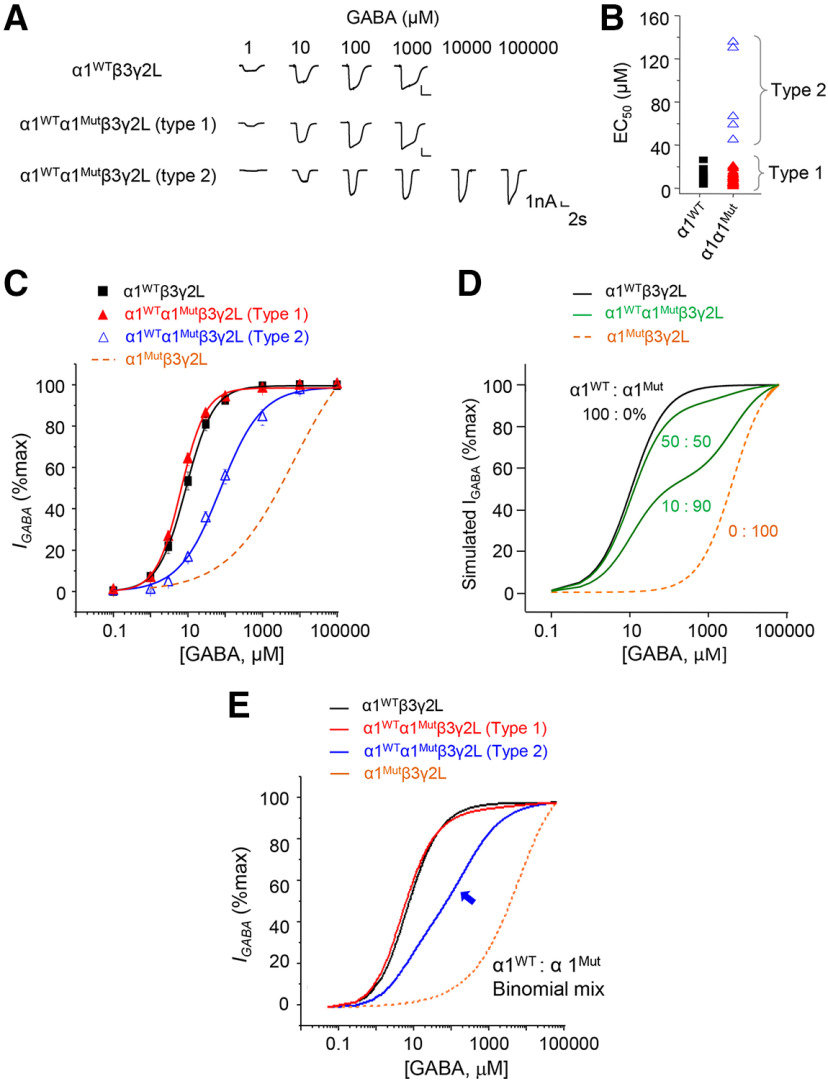
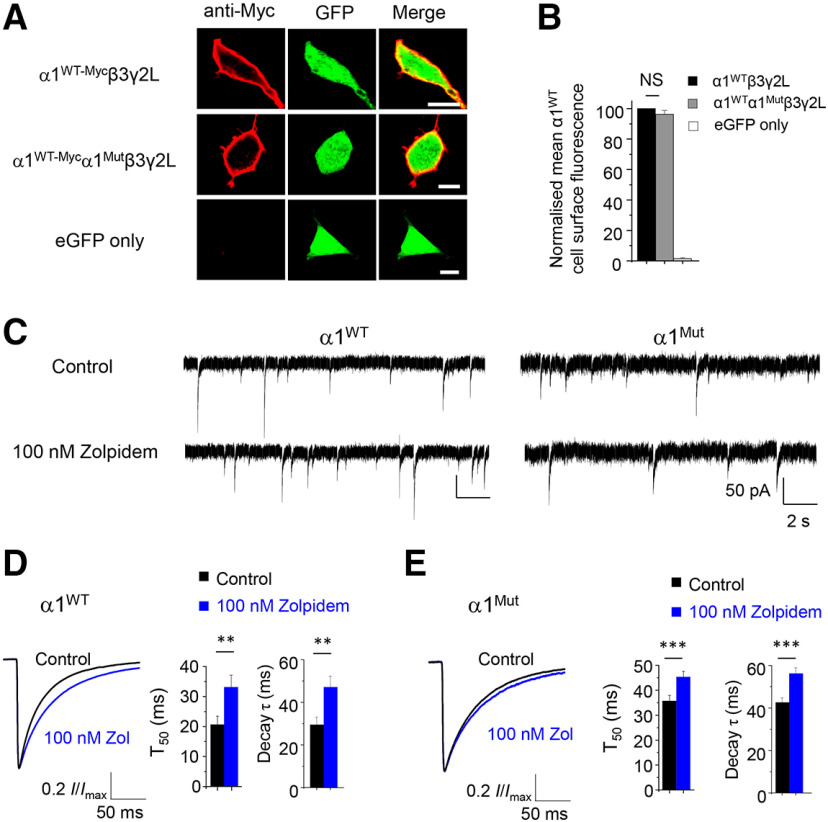
GABAA receptors (GABAARs) are profoundly important for controlling neuronal excitability. Spontaneous and familial mutations to these receptors feature prominently in excitability disorders and neurodevelopmental deficits following disruption to GABA-mediated inhibition. Recent genotyping of an individual with severe epilepsy and Williams-Beuren syndrome identified a frameshifting de novo variant in a major GABAAR gene, GABRA1 This truncated the α1 subunit between the third and fourth transmembrane domains and introduced 24 new residues forming the mature protein, α1Lys374Serfs*25 Cell surface expression of mutant murine GABAARs is severely impaired compared with WT, due to retention in the endoplasmic reticulum. Mutant receptors were differentially coexpressed with β3, but not with β2, subunits in mammalian cells. Reduced surface expression was reflected by smaller IPSCs, which may underlie the induction of seizures. The mutant does not have a dominant-negative effect on native neuronal GABAAR expression since GABA current density was unaffected in hippocampal neurons, although mutant receptors exhibited limited GABA sensitivity. To date, the underlying mechanism is unique for epileptogenic variants and involves differential β subunit expression of GABAAR populations, which profoundly affected receptor function and synaptic inhibition.SIGNIFICANCE STATEMENT GABAARs are critical for controlling neural network excitability. They are ubiquitously distributed throughout the brain, and their dysfunction underlies many neurologic disorders, especially epilepsy. Here we report the characterization of an α1-GABAAR variant that results in severe epilepsy. The underlying mechanism is structurally unusual, with the loss of part of the α1 subunit transmembrane domain and part-replacement with nonsense residues. This led to compromised and differential α1 subunit cell surface expression with β subunits resulting in severely reduced synaptic inhibition. Our study reveals that disease-inducing variants can affect GABAAR structure, and consequently subunit assembly and cell surface expression, critically impacting on the efficacy of synaptic inhibition, a property that will orchestrate the extent and duration of neuronal excitability.

Keywords: GABA-A receptor; epilepsy; inhibition; synaptic transmission; α subunit variant.


Figures

Figure 1.
Figure 1.
Severe reduction in the GABA sensitivity of mutant α1-GABAARs. A, Schematic showing the location of the α1-GABAAR variant in the M3-M4 loop with and without the additional 24 amino acids. B, GABA-activated currents for WT and mutant α1 subunits expressed with β3γ2L in HEK-293 cells. C, GABA concentration-response relationships for WT and α1 mutant receptors. Insets, GABA EC50s and normalized maximal GABA currents. D, Averaged currents evoked by saturating GABA (1 mm WT, 100 mm mutants). Examples of activation and deactivation of GABA currents are shown together with averaged activation and deactivation rates. Activation rate was calculated by measuring the time taken to ascend from 20% to 80% of maximal current following the application of GABA. Deactivation rate was calculated by exponential fitting to the current decay immediately after cessation of GABA application. NS, not significant; *p < 0.05; **p < 0.01; ***p < 0.001; one-way ANOVA.
Figure 2.
Figure 2.
Reduced sensitivity to GABA for α1 mutants expressed in Xenopus oocytes. A, Representative GABA-activated currents for WT and mutant receptors expressed in Xenopus oocytes with β2γ2L or β3γ2L. B, GABA concentration-response relationships for WT and α1 mutant receptors. C, GABA EC50s for α1β2γ2L (n = 7); α1Mutβ2γ2L (n = 5); α1β3γ2L (n = 8); and α1Mutβ3γ2L (n = 5). D, Maximum GABA-activated currents for WT and mutant α1 receptors. The maximal GABA concentration applied was 100 mm. Normalized maximal currents (to WT) shown for α1β2γ2L (n = 7); α1Mutβ2γ2L (n = 8); α1β3γ2L (n = 7); and α1Mutβ3γ2L (n = 5). *p < 0.05; **p < 0.01; ***p < 0.001; two-tailed unpaired t test.
Figure 3.
Figure 3.
Impaired cell surface expression of α1 mutant GABAARs in HEK-293 cells. A, Cytofluorograms for cell surface α1 WT and mutant GABAARs in HEK-293 cells expressed with either β2γ2L (top line) or β3γ2L (bottom) subunits. The numbers in quadrants (Q1-Q4) show percentages of detected cells. B, C, Left, Normalized (Norm.; %) median cell surface fluorescence (F) for: B, α1xβ2γ2L and C, α1xβ3γ2L (where x = WT, Mut or Δ373), including eGFP and untransfected (untrans.) controls in Q2. Right, Mean % number of expressing cells in Q2 for α1xβ2γ2L (B) and α1xβ3γ2L (C). Non-normalized data points are shown by symbols superimposed on the bar charts with the right-hand ordinate denoting their values. au, Arbitrary units. D, Cytofluorograms for total (intracellular and surface) α1 WT and mutant receptors in permeabilized HEK-293 cells expressing β2γ2L or β3γ2L. E, F, Left, Median (%) total fluorescence for α1xβ2γ2L (E) and α1xβ3γ2L (F). Right, % cells in Q2 expressing α1xβ2γ2L (E) and α1xβ3γ2L (F). All data are normalized to the WT data. NS, not significant; **p < 0.01; ***p < 0.001; one-way ANOVA. n = 5-7 independent experiments with 25,000-50,000 cells per construct per run.
Figure 4.
Figure 4.
Effect of an assembly box sequence on cell surface expression and expression of α1-GABAARs in hippocampal neurons. A, Cytofluorograms for cell surface α1 WT and mutant GABAARs in HEK-293 cells expressed with either β3γ2L or β3DNTKγ2L subunits. B, Normalized (Norm.) mean % number of expressing cells in Q2 for α1 with β3γ2L or β3DNTKγ2L. Non-normalized data points are shown (symbols) on each bar chart with values denoted by the right-hand ordinate. *p < 0.05; ***p < 0.001; one-way ANOVA. n = 3 independent experiments with 25,000-50,000 cells per construct per run. C, Representative GABA-activated currents for untagged and myc-tagged WT α1 subunit receptors expressed in HEK-293 cells with β2γ2L subunits to check functional neutrality of the myc-tag. D, GABA concentration-response relationships for untagged or myc-tagged WT α1β2γ2L receptors. EC50s, α1β2γ2L, 7.2 ± 1 μm, n = 8; α1mycβ2γ2L, 7.5 ± 1.2 μm, n = 6. E, Confocal images of hippocampal cell surface labeling showing myc-tagged WT or mutant α1-containing GABAARs (left column), eGFP staining (middle), and merged images of α1 and GFP fluorescence (right). Scale bars, 5 μm. F, Mean fluorescence intensities for WT and mutant α1-containing GABAAR cell surface labeling in neurons. au, Arbitrary units. **p < 0.01; ***p < 0.001; one-way ANOVA. n = 36.
Figure 5.
Figure 5.
Intracellular retention of mutant GABAARs in the ER. A, Representative confocal images of WT and mutant α1-containing GABAARs expressed in HEK-293 cells. Left column (from the top), Rows for cells expressing the following: GFP or α1 subunits only; α1Mut with either β2 or β3 and γ2L; and α1WT with either β2 or β3 and γ2L subunits. Middle column, Immunostains for the ER-associated protein, calnexin. Right column, The extent of colocalization for α1WT and α1Mut subunits with calnexin. The images are represented as pseudo-colors. B, Bar graphs represent Pearson's correlation coefficient (r), and Mander's M1/2 coefficients also measuring colocalization of α1 and calnexin. M1 reports α1 colocalized with calnexin, and M2 denotes calnexin colocalized with α1 subunits. *p < 0.05; **p < 0.01; ***p < 0.001; one-way ANOVA. n = 18-28. Scale bar, 5 µm.
Figure 6.
Figure 6.
Mutant α1 subunit-GABAARs reduce sIPSC amplitudes. A, Top, sIPSCs recorded from cultured hippocampal neurons clamped at −60 mV and expressing WT or mutant α1-containing GABAARs. Bottom, Higher time resolution records from selected panels (dotted lines). B, From left to right: Averaged sIPSC waveforms; sIPSC frequency and cumulative probability distribution of sIPSC amplitudes (inset: box plot showing median and 25%-75% interquartile range of amplitudes, Amp.); sIPSC half-decay time (T50), exponential decay times, and cumulative distribution of area (charge transfer) (inset, box plot shows median and 25%-75% interquartile range of the sIPSC area), for WT and mutant α1 subunit-containing GABAARs. **p < 0.01 (two-tailed unpaired t test). n = 21-25 neurons for bar charts. ***p < 0.001 (Mann–Whitney test). n = 5236-5664 events for sIPSC cumulative amplitude distributions from 24-25 cells. n = 1306-1330 for sIPSC cumulative area distributions. C, Whole-cell 1 mm GABA-activated currents recorded at −20 mV in neurons expressing α1WT or α1Mut GABAARs. D, Mean GABA current densities for α1WT- and α1Mut-expressing neurons (n = 41-45 neurons). Two-tailed unpaired t test. E, Nonstationary noise analysis for sIPSCs recorded from neurons expressing WT or mutant GABAARs. F, Bar graphs of number of receptors (N) at inhibitory synapses activated during the peak sIPSC, and single-channel conductance of GABAARs. n = 9-11 neurons. NS, not significant; *p < 0.05 (two-tailed unpaired t test).
Figure 7.
Figure 7.
Formation of α1-heteromeric GABAARs. A, GABA-activated currents for pure and mixed α1 subunit-containing receptors expressed with β3γ2L in HEK-293 cells. B, EC50 values are plotted for individual cells for pure and mixed α1 subunit-containing receptors. Arbitrarily defined Type 1 receptors have EC50s similar to WT, and Type 2 receptors have ∼eightfold higher EC50s. C, GABA concentration-response relationships for α1 WT and for cells expressing α1Mut with α1 WT subunits: n = 41 for Type 1 receptors, 5 for Type 2 receptors, and 14 for WT receptors. The curve for α1Mutβ3γ2L is shown for comparison (orange dashed line) (data from Fig. 1C). D, GABA concentration curves generated by a modified Hill equation based on expressing just two pure populations of receptors: α1WTβ3γ2L and α1Mutβ3γ2L with EC50s (data from Fig. 1C). As α1Mut receptors were trafficking-impaired, their access to the cell surface was limited to 10% of WT. The relative proportions (%) of α1WT and α1Mut were varied between curves from 100 (α1WT):0 (α1Mut)% (black line), to 50:50 and 10:90 (green), and 0:100 (orange dashed line). E, Simulated GABA concentration-response curves for a binomial mixture of α1WT and α1Mut with β3 and γ2L subunits as indicated by the key. A binomial distribution was assumed to occur for assembly (α1WT 25%, α1WTα1Mut 50%, α1Mut 25%) with trafficking to the cell surface as (α1WT 54%, α1WTα1Mut 40%, and α1Mut 6%) with EC50s and Hill slopes of (α1WT 6.93 μm, 1.33; α1WTα1Mut 87 μm, 0.79 [Type 2 blue curve], 3.58 μm, 1.63 [Type 1, red curve]; α1Mut 10.7 mm, 0.56).
Figure 8.
Figure 8.
Expression of the α1 mutant subunits does not affect α1 subunit surface expression and potentiation of IPSCs by zolpidem. A, Confocal images of cell surface labeling of WT α1myc GABAARs in the absence (top row) or presence of coexpressed mutant α1 or eGFP only. Scale bars, 5 μm. B, Mean fluorescence intensities for WT α1 GABAARs in the absence and presence of mutant α1 or eGFP only. Data normalized to levels of α1WT myc staining. One-way ANOVA, n = 24-42. C, Representative sIPSCs recorded from hippocampal neurons expressing α1WT or mutant α1Mut-containing GABAARs under control conditions or in the presence of 100 nm zolpidem. D, E, Average sIPSC waveforms, half-decay times (T50), and decay τ in the presence of 100 nm zolpidem for α1WT (D) and α1Mut (E) expressing neurons. n = 9-12. NS, not significant; **p < 0.01; ***p < 0.001; two-tailed paired t test.

References

    1. Audenaert D, Schwartz E, Claeys KG, Claes L, Deprez L, Suls A, Van DT, Lagae L, Van BC, Macdonald RL, De Jonghe P (2006) A novel GABRG2 mutation associated with febrile seizures. Neurology 67:687–690. 10.1212/01.wnl.0000230145.73496.a2 - DOI - PubMed
    1. Connolly CN, Krishek BJ, McDonald BJ, Smart TG, Moss SJ (1996) Assembly and cell surface expression of heteromeric and homomeric γ-aminobutyric acid type-A receptors. J Biol Chem 271:89–96. 10.1074/jbc.271.1.89 - DOI - PubMed
    1. Datta D, Arion D, Lewis DA (2015) Developmental expression patterns of GABAA receptor subunits in layer 3 and 5 pyramidal cells of monkey prefrontal cortex. Cereb Cortex 25:2295–2305. 10.1093/cercor/bhu040 - DOI - PMC - PubMed
    1. Fisher JL. (2004) A mutation in the GABAA receptor α1 subunit linked to human epilepsy affects channel gating properties. Neuropharmacology 46:629–637. 10.1016/j.neuropharm.2003.11.015 - DOI - PubMed
    1. Foo JN, Liu JJ, Tan EK (2012) Whole-genome and whole-exome sequencing in neurological diseases. Nat Rev Neurol 8:508–517. 10.1038/nrneurol.2012.148 - DOI - PubMed

Publication types