. 2020 Aug;183(4):1809-1824.
doi: 10.1104/pp.20.00141. Epub 2020 Jun 8.

Analysis of Global Methylome and Gene Expression during Carbon Reserve Mobilization in Stems under Soil Drying

Affiliations

Analysis of Global Methylome and Gene Expression during Carbon Reserve Mobilization in Stems under Soil Drying

Guanqun Wang et al. Plant Physiol. 2020 Aug.

Abstract

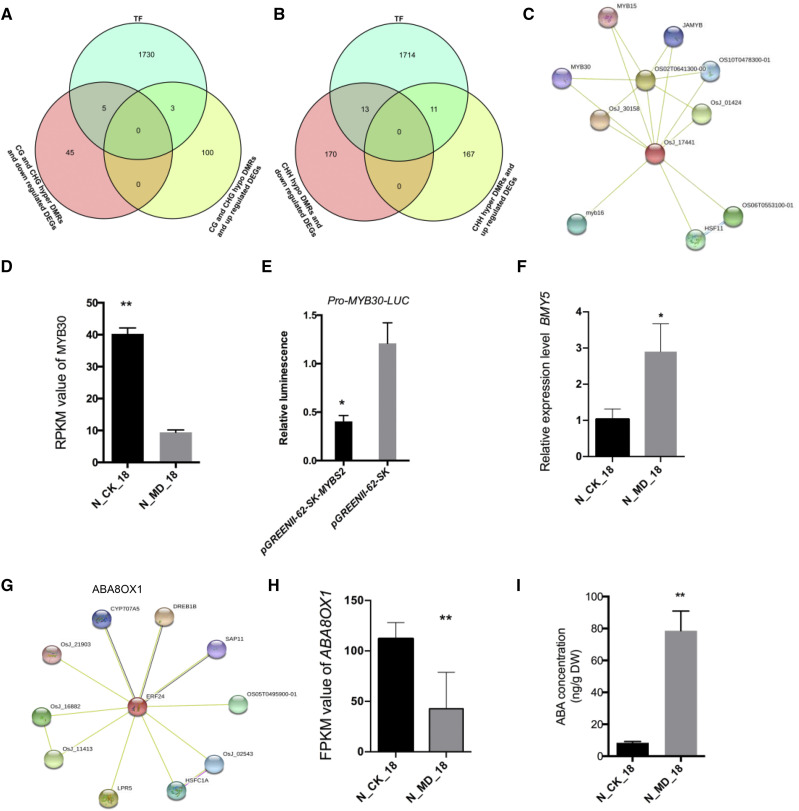
In rice (Oryza sativa), a specific temporary source organ, the stem, is important for grain filling, and moderate soil drying (MD) enhanced carbon reserve flow from stems to increase grain yield. The dynamics and biological relevance of DNA methylation in carbon reserve remobilization during grain filling are unknown. Here, we generated whole-genome single-base resolution maps of the DNA methylome in the stem. During grain filling under MD, we observed an increase in DNA methylation of total cytosines, with more hypomethylated than hypermethylated regions. Genes responsible for DNA methylation and demethylation were up-regulated, suggesting that DNA methylation changes in the stem were regulated by antagonism between DNA methylation and demethylation activity. In addition, methylation in the CG and CHG contexts was negatively associated with gene expression, while that in the CHH context was positively associated with gene expression. A hypermethylated/up-regulated transcription factor of MYBS2 inhibited MYB30 expression and possibly enhanced β-Amylase5 expression, promoting subsequent starch degradation in rice stems under MD treatment. In addition, a hypermethylated/down-regulated transcription factor of ERF24 was predicted to interact with, and thereby decrease the expression of, abscisic acid 8'-hydroxylase1, thus increasing abscisic acid concentration under MD treatment. Our findings provide insight into the DNA methylation dynamics in carbon reserve remobilization of rice stems, demonstrate that MD increased this remobilization, and suggest a link between DNA methylation and gene expression in rice stems during grain filling.


Figures

Figure 1.
Figure 1.
Changes in DNA methylation levels in stems during grain filling under the CK and MD treatments. A, Percentage of methylated cytosines from 12 to 24 DAA under the CK and MD treatments. B, mC methylation levels from 12 to 24 DAA under the CK and MD treatments. C to E, Methylation levels of mCG, mCHG, and mCHH, respectively, from 12 to 24 DAA in different genomic regions under the CK and MD treatments. F, Relative proportions of mCG, mCHG, and mCHH in total mCs.
Figure 2.
Figure 2.
DNA methylation patterns in different genomic regions. A, Methylation level of upstream 2-kb (upstream2k), downstream 2-kb (downstream2k), repeat, and coding genes with 5′ UTR, exon, intron, and 3′ UTR regions in the CG, CHG, and CHH contexts at 12 DAA under the CK condition. The white dots represent the median methylation level, and the black rectangles are the range from the lower quartile to the upper quartile. The length of each shape represents the degree of dispersion and symmetry of nonabnormal data. Longer is scattered, and shorter is concentrated. B, Percentage of methylation levels altered by MD treatment among gene features in each sample.
Figure 3.
Figure 3.
Expression of DNA methyltransferase and DNA demethylase genes in stems during grain filling. Fragments per kilobase million (FPKM) values are shown for OsMET1-2 (A), OsCMT2 (B), OsDNMT2 (C), OsDRM2 (D), OsDRM3 (E), OsROS1a (F), OsROS1c (G), and OsROS1d (H). Values represent means ± sd of three biological replicates. Asterisks indicate that the values of the two treatments were significantly different at P < 0.05 determined by Student’s t test.
Figure 4.
Figure 4.
Relationship between DNA methylation and gene expression. A, Distribution of methylation levels within gene bodies based on four different expression levels: nonexpressed (non), high (hig), medium (med), and low. B, Expression profiles of methylated genes compared with unmethylated genes. Methylated genes were further divided into four quantiles based on the upstream 2-kb (up2k), gene body, and downstream 2-kb (down2k) regions.
Figure 5.
Figure 5.
Differential methylome analysis under MD treatment. A, Number of DMRs in the CG, CHG, and CHH contexts in three comparisons. B, Number of total hypomethylated and hypermethylated DMRs in three comparisons. C, Total DMRs in different gene features at three grain-filling stages. D, Number of DMRs in different gene features in the CG context. E, Number of DMRs in different gene features in the CHG context. F, Number of DMRs in different gene features in the CHH context.
Figure 6.
Figure 6.
Normalized value of DMR number in the number of DMRs per Mb in each chromosome. A, DMR number per Mb between the CK and MD conditions at 12 DAA in CG, CHG, and CHH contexts. B, DMR number per Mb between the CK and MD conditions at 18 DAA in CG, CHG, and CHH contexts. C, DMR number per Mb between the CK and MD conditions at 24 DAA in CG, CHG, and CHH contexts.
Figure 7.
Figure 7.
Association between gene expression and methylation during grain filling under soil-drying conditions. A, Number of DEGs during grain filling among the three comparisons. B, Venn diagram showing the number of DMRs that occurred in promoter regions proximal to DEGs in the CG context at 18 DAA. C, Venn diagram showing the number of DMRs that occurred in promoter regions proximal to DEGs in the CHG context at 18 DAA. D, Venn diagram showing the number of DMRs that occurred in the promoter regions proximal to DEGs in the CHH context at 18 DAA. E, Down-regulated gene of OsSAUR2 (N_CK_18 versus N_MD-18), which is proximal to a hypomethylated DMR in the upstream region of this gene in the IGV. F, Up-regulated gene of SWEET6b (N_CK_18 versus N_MD-18), which is proximal to a hypermethylated DMR in the upstream region of this gene in the IGV. In E and F, blue represents the methylation levels and red represents the gene expression levels.
Figure 8.
Figure 8.
Associated TFs between DNA methylation in the promoter region and gene expression during grain filling at 18 DAA. A, Venn diagram showing the TFs of hypomethylated DMRs in promoter regions proximal to up-regulated genes and hypermethylated DMRs in promoter regions and down-regulated genes in CG and CHG contexts. B, Venn diagram showing the TFs of hypomethylated DMRs in promoter regions proximal to down-regulated genes and hypermethylated DMRs in promoter regions and up-regulated genes in CHH contexts. C, Interacting proteins of MYBS2 predicted using Interactions Viewer (https://string-db.org/cgi/input.pl). D, Reads per kilobase of transcript per million mapped reads (RPKM) values of MYB30 at 18 DAA under the CK and MD treatments. Values represent means ± sd of three biological replicates. **, P < 0.01 determined by Student’s t test. E, Coexpression of MYBS2 with LUC driven by the MYB30 promoter in leaf protoplasts. Values represent means ± sd of two biological replicates. *, P < 0.05 determined by Student’s t test. F, Relative expression levels of BMY5 under MD conditions at 18 DAA. Values represent means ± sd of three biological replicates. *, P < 0.05 determined by Student’s t test. G, Interacting proteins of ERF24 predicted using Interactions Viewer. H, Gene expression levels of ABA8OX1 during grain filling under MD conditions. Values represent means ± sd of three biological replicates. **, P < 0.01 determined by Student’s t test. I, ABA concentration measured at 18 DAA under MD conditions. Values represent means ± sd of three biological replicates. **, P < 0.01 determined by Student’s t test. DW, Dry weight.

References

    1. Chan SWL, Henderson IR, Jacobsen SE(2005) Gardening the genome: DNA methylation in Arabidopsis thaliana. Nat Rev Genet 6: 351–360 - PubMed
    1. Chen HJ, Wang SJ(2012) Abscisic acid enhances starch degradation and sugar transport in rice upper leaf sheaths at the post-heading stage. Acta Physiol Plant 34: 1493–1500
    1. Chen X, Zhou DX(2013) Rice epigenomics and epigenetics: Challenges and opportunities. Curr Opin Plant Biol 16: 164–169 - PubMed
    1. Cheng J, Niu Q, Zhang B, Chen K, Yang R, Zhu JK, Zhang Y, Lang Z(2018) Downregulation of RdDM during strawberry fruit ripening. Genome Biol 19: 212. - PMC - PubMed
    1. Chinnusamy V, Zhu JK(2009) Epigenetic regulation of stress responses in plants. Curr Opin Plant Biol 12: 133–139 - PMC - PubMed

Publication types

MeSH terms

Substances

LinkOut - more resources