. 2020 Jun 8;10(1):9221.
doi: 10.1038/s41598-020-66332-y.

Anodal block permits directional vagus nerve stimulation

Affiliations

Anodal block permits directional vagus nerve stimulation

Umair Ahmed et al. Sci Rep. .

Abstract

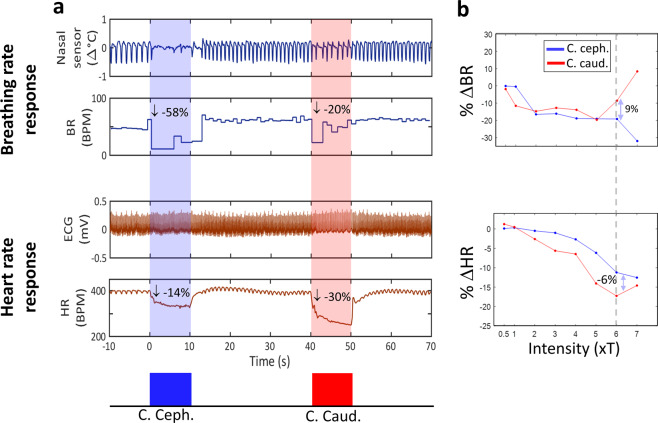
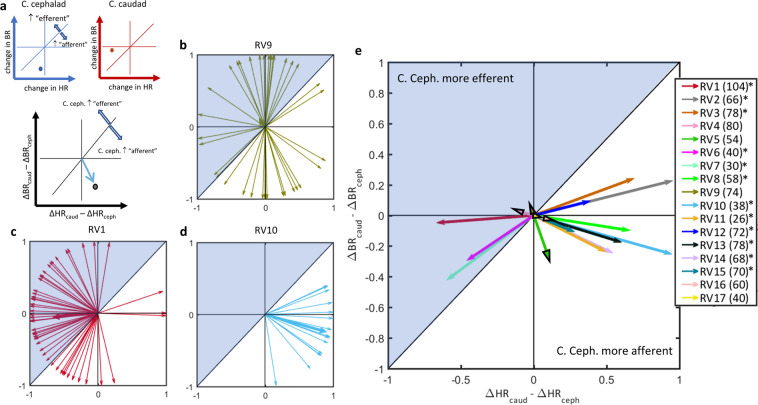
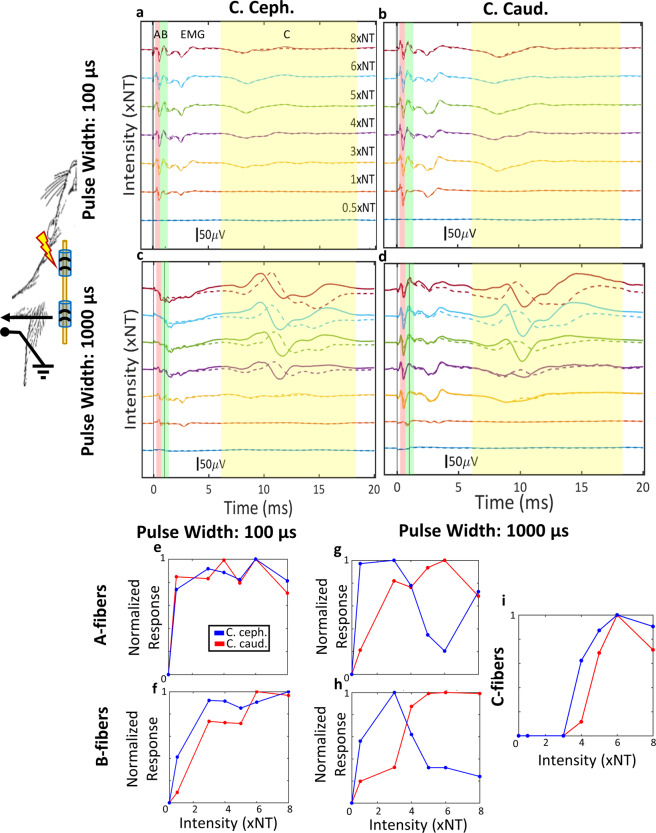
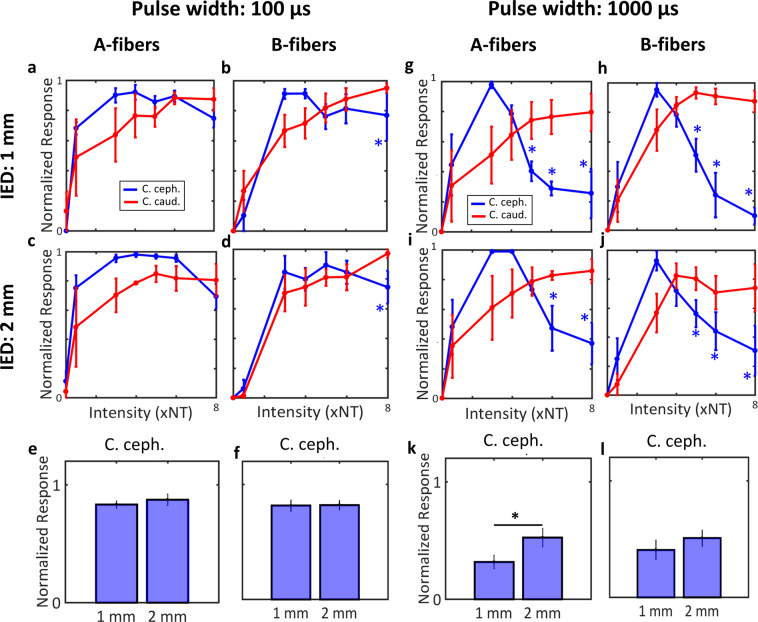
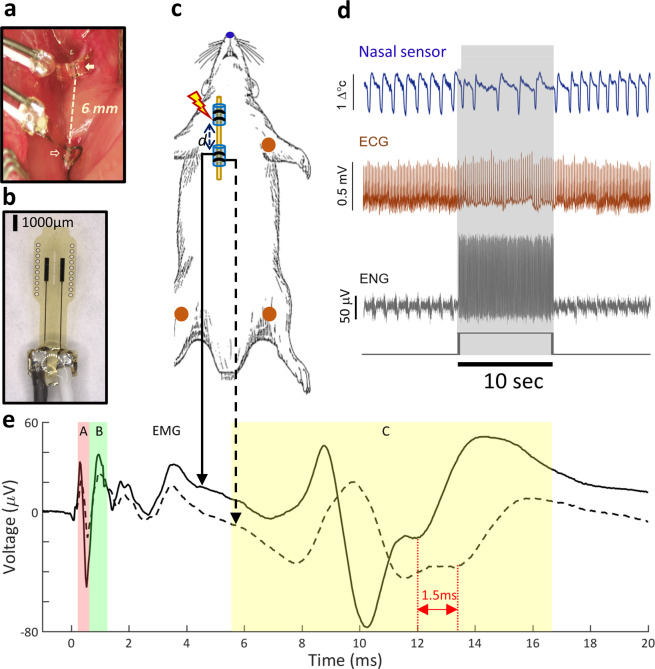
Vagus nerve stimulation (VNS) is a bioelectronic therapy for disorders of the brain and peripheral organs, and a tool to study the physiology of autonomic circuits. Selective activation of afferent or efferent vagal fibers can maximize efficacy and minimize off-target effects of VNS. Anodal block (ABL) has been used to achieve directional fiber activation in nerve stimulation. However, evidence for directional VNS with ABL has been scarce and inconsistent, and it is unknown whether ABL permits directional fiber activation with respect to functional effects of VNS. Through a series of vagotomies, we established physiological markers for afferent and efferent fiber activation by VNS: stimulus-elicited change in breathing rate (ΔBR) and heart rate (ΔHR), respectively. Bipolar VNS trains of both polarities elicited mixed ΔHR and ΔBR responses. Cathode cephalad polarity caused an afferent pattern of responses (relatively stronger ΔBR) whereas cathode caudad caused an efferent pattern (stronger ΔHR). Additionally, left VNS elicited a greater afferent and right VNS a greater efferent response. By analyzing stimulus-evoked compound nerve potentials, we confirmed that such polarity differences in functional responses to VNS can be explained by ABL of A- and B-fiber activation. We conclude that ABL is a mechanism that can be leveraged for directional VNS.


Conflict of interest statement

The authors declare no competing interests.

Figures

Figure 1
Figure 1
Acute physiological markers of afferent and efferent vagal fiber activation. (a) Acute physiological effects of cervical VNS (intensity 200 μA, pulse width 1000 μs, pulsing frequency 30 Hz) in an animal (R19) with intact vagus. Decreases in breathing rate (BR, −71%) and heart rate (HR, −58%) are observed during VNS. (b) After rostral vagotomy in that animal, the effect of VNS with the same parameters on BR disappears (+12%), whereas effects on HR remains intact (−56%). (c) The same trend for both BR and HR responses to VNS were observed in 9 animals subjected to rostral vagotomy (paired t-test, p < 0.001 top panel; p NS bottom). (d) BR and HR responses to cervical VNS (intensity 100 μA, pulse width 1000 μs, frequency 30 Hz) in another animal (R5) with intact vagus. (e) After caudal vagotomy, the HR response disappears, whereas the BR response remains intact. (f) Similar trends for BR and HR responses to VNS observed in 8 animals subjected to caudal vagotomy (paired t-test, p NS top panel; p < 0.001 bottom).
Figure 2
Figure 2
Afferent and efferent physiological responses to VNS of opposite polarities. (a) Afferent (breathing rate, BR) and efferent (heart rate, HR) responses to individual VNS trains of stimuli of 2 opposite polarities: cathode cephalad (blue trace), followed by cathode caudad (red trace). Cathode cephalad polarity was associated with a stronger afferent response (−58% change in BR and −14% change in HR), whereas cathode caudad with a stronger efferent response (−20% change in BR and −30% in HR). Stimulation parameters for both trains: 200 μA, 500 μs, 10 s-long train (300 pulses), 30 Hz. (b) Example of BR responses (top panel) and HR responses (bottom panel) to VNS of 2 opposite polarities, at a range of current intensities. Current intensity was normalized with respect to “physiological threshold” (T). In this case, cathode caudad polarity typically elicited greater drops in BR, whereas cathode cephalad greater drops in HR. Each of the 2 two-headed arrows denotes the difference in the corresponding physiological response between the 2 polarities at an intensity level of 6xT: response to cathode caudad minus response to cathode cephalad.
Figure 3
Figure 3
Net vagal responses to trains of stimuli of opposite polarities. (a) With cathode cephalad polarity (top left, blue axis), afferent (BR) and efferent (HR) responses are registered, represented as a point in the 2-D plot; horizontal and vertical lines denote zero change in BR and in HR, respectively. Points below unity line represent response patterns that are more afferent than efferent. With cathode caudad polarity (top right, red axis), the point lies above unity line, suggesting a greater efferent effect. By subtracting the afferent and efferent responses associated with each polarity (cathode caudad minus cathode cephalad), a “polarity-difference” vector plot was obtained (bottom panel). Vectors that point downwards the unity line represent stimuli for which the cathode cephalad polarity has an “afferent” net vagal response, and vice-versa for vectors pointing upwards. (b) Polarity difference vectors computed from 74 VNS trains in one animal (RV9). Vector directions span the entire angle space, suggesting no overall effect of polarity on the net vagal responses. Consistent with that, the vector sum (thicker vector) is short in length and the distribution of vector directions was uniform (Rayleigh test, p NS). (c) Polarity difference vectors in another animal (RV1, 104 VNS trains). The vector sum points upwards the unity line and the distribution of vector directions is not uniform (Rayleigh test, p < 0.01), indicating that cathode cephalad polarity had a significantly “efferent” net vagal response. (d) Polarity difference vectors in a third animal (RV10, 38 VNS trains), with vector sum pointing downwards (Rayleigh test, p < 0.01), indicating that cathode cephalad polarity had a significantly “afferent” net vagal response. (e) Preferred directions of polarity difference vectors in 17 animals (numbers of VNS trains indicated in the legend). Vector sums with black arrowheads denote animals in which the distribution of vectors was uniform (Rayleigh test p > 0.05). Of the 17 animals, 5 had no polarity difference, 9 had a more “afferent” and 3 had a more “efferent” net vagal response to cathode cephalad polarity (asterisks on legends indicates p < 0.01, Rayleigh test).
Figure 4
Figure 4
Example of the effect of stimulus polarity on A-, B- and C-fiber activation. In these experiments, VNS was delivered through a cuff placed rostrally on the cervical vagus, and stimulus-evoked compound nerve action potentials (sCNAPs) were recorded through a second cuff placed caudally (schematic diagram). (a) sCNAPs elicited by short pulse width (100 μs) stimuli with cathode cephalad polarity, in order of increasing intensity from bottom to top. Stimulus intensity is expressed in units of neural threshold (NT): intensity of 1 corresponds to the minimum intensity eliciting a visible neural response. Vertical shaded areas denote latency windows associated with activation of different fiber types, as explained in Fig. 1. (b) sCNAPs elicited by short pulse width stimuli with cathode caudad polarity. (c,d) sCNAPs elicited by long pulse width (1000 μs) stimuli with cathode cephalad polarity (e) and cathode caudad polarity (f), in order of increasing intensity from bottom to top. (e,f) Magnitude of A- and B-fiber activation, respectively, as a function of intensity of short pulse width stimuli, compiled from sCNAPs shown in panels (a,b). C-fibers were not activated at this pulse width, hence not reported here. (g–i) Magnitude of A-, B- and C-fiber activation, respectively, as a function of intensity of long pulse width stimuli (data from panels c,d).
Figure 5
Figure 5
Stimulus polarity and average A- and B-fiber response magnitudes, for different pulse widths and inter-electrode distances. (a,b) Average (mean ±SEM, 4 animals) response magnitudes of A- and B-fibers, respectively, to stimuli with short pulse width (100 μs), delivered through a bipolar electrode with 1 mm-inter-electrode distance (IED). Shown are the responses to both polarities, as a function of stimulus intensity. Blue asterisks denote statistically significant intensity levels at which anodal block of the corresponding fibers occurred (i.e. the response to cathode cephalad polarity became smaller that of the cathode caudad; paired t-test, p < 0.05). (c,d) Same as before (panels a,b), with an IED of 2 mm. (e,f) Comparison of average response magnitudes of A- and B-fibers, respectively, for cathode cephalad polarity, between 1 mm- and 2 mm-IED, for short pulse widht: 100 μs (paired t-test, p NS). (g,h) Average response magnitudes of A- and B-fibers, respectively, to stimuli with long pulse width (1000 μs), delivered with an IED of 1 mm (paired t-test; blue asterisks denote p < 0.05). (i,j) Same as before (panels g,h), but with an IED of 2 mm (paired t-test; blue asterisks denote p < 0.05). (k,l) Comparison between 1 mm- and 2 mm-IED similarly to panels e and f, but for long pulse width: 1000 μs (paired t-test, fig. k p = 0.05; fig. l p NS).
Figure 6
Figure 6
Experimental setup, electrodes, physiological sensors and signals. (a) Two bipolar cuff electrodes shown placed below corresponding exposed parts of the cervical vagus nerve in a rat, at a distance of 6 mm from each other. The rostral electrode (filled arrow) is used for stimulation, the caudal (open arrow) for recording. (b) Close-up image of a bipolar, Flex electrode. (c) Schematic of the animal with the 2 vagus nerve electrodes and the sensors for physiological measurements: nasal temperature sensor for resolving air flow (blue), electrocardiogram (ECG) sensors (2 differentials and 1 ground) for registering ECG (red). (d) Snippet of signals acquired during delivery of a 10 s-long (300 pulse count) VNS train (rectangular black trace at bottom panel): temperature signal from nasal sensor (top panel, blue trace), voltage signal from ECG sensor (second panel, red trace), electroneurogram (ENG) signal from recording nerve electrode (third panel, grey trace). In the raw ENG signal, periodic modulations associated with breathing and stimulation artifacts associated with VNS were also observed. (e) Stimulus-evoked compound nerve action potential (sCNAP) compiled by averaging single ENG sweeps around the onset of each of the 300 stimuli in the VNS train. The solid and the dotted trace represent the 2 sCNAPs recorded on the 2 contacts of a bipolar recording cuff; notice the time-shift in the 2 traces for slow-conducting C-fibers, corresponding to different arrival times of CNAPs at the 2 recording contacts, and the lack of time-shift for extra-neural EMG, which is recorded simultaneously on both contacts. The colored shaded areas represent the windows of latencies (minimum and maximum latency) for each of the 3 fiber type and EMG activity: red for A fibers (0.3–0.95 ms), green for B fibers (0.7–1.2 ms), yellow for C fibers (5.5–16.6 ms) and white for EMG (2–10 ms). The latency windows were calculated based on the known conduction velocities of fibers types and distance between stimulating and recording electrodes. The magnitude of activation for each fiber type was calculated as the amplitude of the CNAP component within each of the 4 latency windows.

References

    1. Handforth A, et al. Vagus nerve stimulation therapy for partial-onset seizures: a randomized active-control trial. Neurology. 1998;51:48–55. doi: 10.1212/wnl.51.1.48. - DOI - PubMed
    1. Arle JE, Carlson KW, Mei L. Investigation of mechanisms of vagus nerve stimulation for seizure using finite element modeling. Epilepsy Research. 2016;126:109–118. doi: 10.1016/j.eplepsyres.2016.07.009. - DOI - PubMed
    1. Rush AJ, et al. Vagus nerve stimulation (VNS) for treatment-resistant depressions: a multicenter study. Biological psychiatry. 2000;47:276–286. doi: 10.1016/S0006-3223(99)00304-2. - DOI - PubMed
    1. Premchand RK, et al. Autonomic regulation therapy via left or right cervical vagus nerve stimulation in patients with chronic heart failure: results of the ANTHEM-HF trial. Journal of cardiac failure. 2014;20:808–816. doi: 10.1016/j.cardfail.2014.08.009. - DOI - PubMed
    1. De Ferrari GM, et al. Rationale and study design of the NEuroCardiac TherApy foR Heart Failure Study: NECTAR-HF. European journal of heart failure. 2014;16:692–699. doi: 10.1002/ejhf.80. - DOI - PMC - PubMed

Publication types