

The mechanoelectrical transducer channel is not required for regulation of cochlear blood flow during loud sound exposure in mice
- PMID: 32514013
- PMCID: PMC7280509
- DOI: 10.1038/s41598-020-66192-6
The mechanoelectrical transducer channel is not required for regulation of cochlear blood flow during loud sound exposure in mice
Abstract
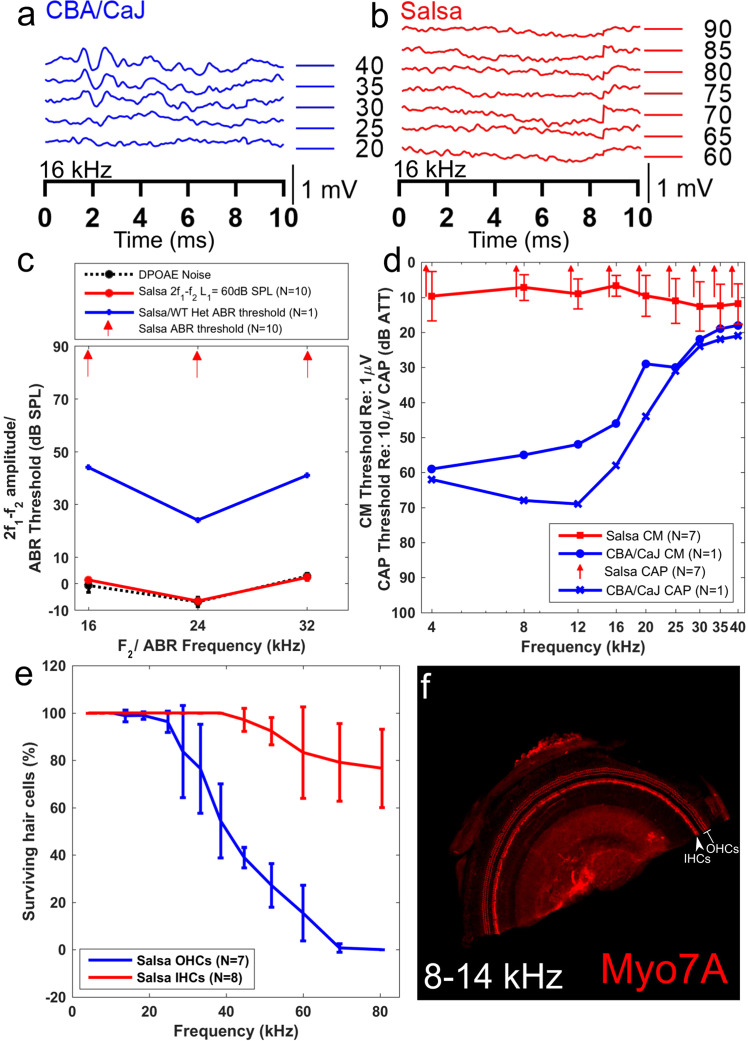
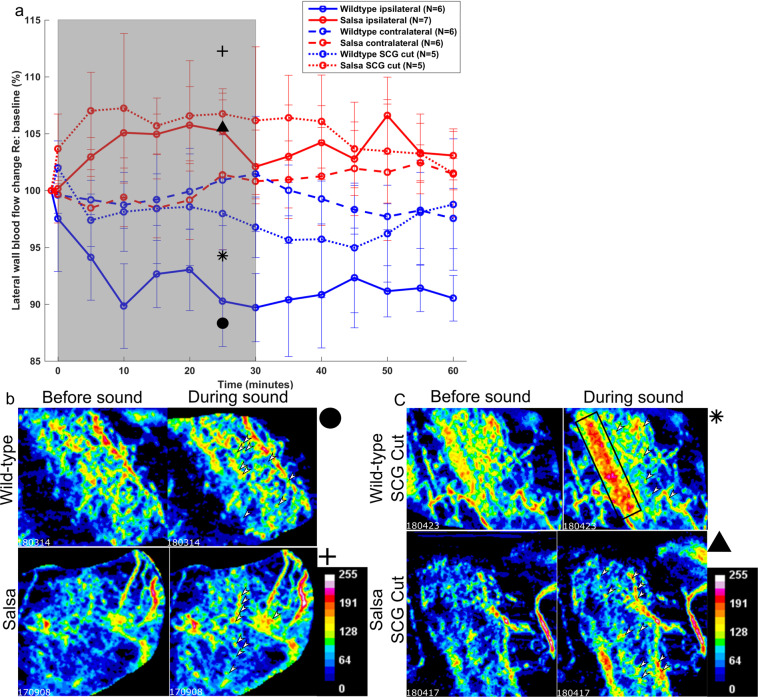
The mammalian cochlea possesses unique acoustic sensitivity due to a mechanoelectrical 'amplifier', which requires the metabolic support of the cochlear lateral wall. Loud sound exposure sufficient to induce permanent hearing damage causes cochlear blood flow reduction, which may contribute to hearing loss. However, sensory epithelium involvement in the cochlear blood flow regulation pathway is not fully described. We hypothesize that genetic manipulation of the mechanoelectrical transducer complex will abolish sound induced cochlear blood flow regulation. We used salsa mice, a Chd23 mutant with no mechanoelectrical transduction, and deafness before p56. Using optical coherence tomography angiography, we measured the cochlear blood flow of salsa and wild-type mice in response to loud sound (120 dB SPL, 30 minutes low-pass filtered noise). An expected sound induced decrease in cochlear blood flow occurred in CBA/CaJ mice, but surprisingly the same sound protocol induced cochlear blood flow increases in salsa mice. Blood flow did not change in the contralateral ear. Disruption of the sympathetic nervous system partially abolished the observed wild-type blood flow decrease but not the salsa increase. Therefore sympathetic activation contributes to sound induced reduction of cochlear blood flow. Additionally a local, non-sensory pathway, potentially therapeutically targetable, must exist for cochlear blood flow regulation.
Conflict of interest statement
The authors declare no competing interests.
Figures

Similar articles
-
Effects of frequency and intensity of sound on cochlear blood flow.Acta Otolaryngol. 1992;112(1):59-64. doi: 10.3109/00016489209100783. Acta Otolaryngol. 1992. PMID: 1575038
-
Effect of loud sound exposure on the cochlear blood flow.Acta Otolaryngol. 1990 May-Jun;109(5-6):378-82. doi: 10.3109/00016489009125158. Acta Otolaryngol. 1990. PMID: 2141752
-
TNF-α inhibition using etanercept prevents noise-induced hearing loss by improvement of cochlear blood flow in vivo.Int J Audiol. 2013 Aug;52(8):545-52. doi: 10.3109/14992027.2013.790564. Epub 2013 Jun 20. Int J Audiol. 2013. PMID: 23786392
-
["The cochlear amplifier". A crucial component of the hearing mechanism].Lakartidningen. 1997 Nov 5;94(45):4077-80. Lakartidningen. 1997. PMID: 9424498 Review. Swedish.
-
Noise: Acoustic Trauma to the Inner Ear.Otolaryngol Clin North Am. 2020 Aug;53(4):531-542. doi: 10.1016/j.otc.2020.03.008. Epub 2020 Apr 30. Otolaryngol Clin North Am. 2020. PMID: 32362563 Review.
Cited by
-
Norepinephrine protects against cochlear outer hair cell damage and noise-induced hearing loss via α2A-adrenergic receptor.BMC Neurosci. 2024 Jan 30;25(1):5. doi: 10.1186/s12868-024-00845-4. BMC Neurosci. 2024. PMID: 38291397 Free PMC article.
-
Optical Coherence Tomography-Based Atlas of the Human Cochlear Hook Region.J Clin Med. 2022 Dec 28;12(1):238. doi: 10.3390/jcm12010238. J Clin Med. 2022. PMID: 36615042 Free PMC article.
-
Three-dimensional mouse cochlea imaging based on the modified Sca/eS using confocal microscopy.Anat Sci Int. 2023 Jul;98(3):309-317. doi: 10.1007/s12565-023-00703-z. Epub 2023 Feb 11. Anat Sci Int. 2023. PMID: 36773194 Free PMC article.
References
-
- Wangemann PK. cycling and its regulation in the cochlea and the vestibular labyrinth. Audiology and Neurotology. 2002;7:199–205. - PubMed
-
- Wangemann P. Cochlear blood flow regulation. Advances in Otorhinolaryngology. 2002;59:51–57. - PubMed
-
- Johnstone BM. Ion fluxes in the cochlea. Membranes and ion transport. 1971;3:167–184.
Publication types
MeSH terms
Substances
Grants and funding
LinkOut - more resources
Full Text Sources
Medical
Molecular Biology Databases
Research Materials
Miscellaneous
