. 2020 Nov;27(11):3196-3207.
doi: 10.1038/s41418-020-0572-6. Epub 2020 Jun 8.

Expansion of myeloid-derived suppressor cells in patients with severe coronavirus disease (COVID-19)

Affiliations

Expansion of myeloid-derived suppressor cells in patients with severe coronavirus disease (COVID-19)

Chiara Agrati et al. Cell Death Differ. 2020 Nov.

Abstract

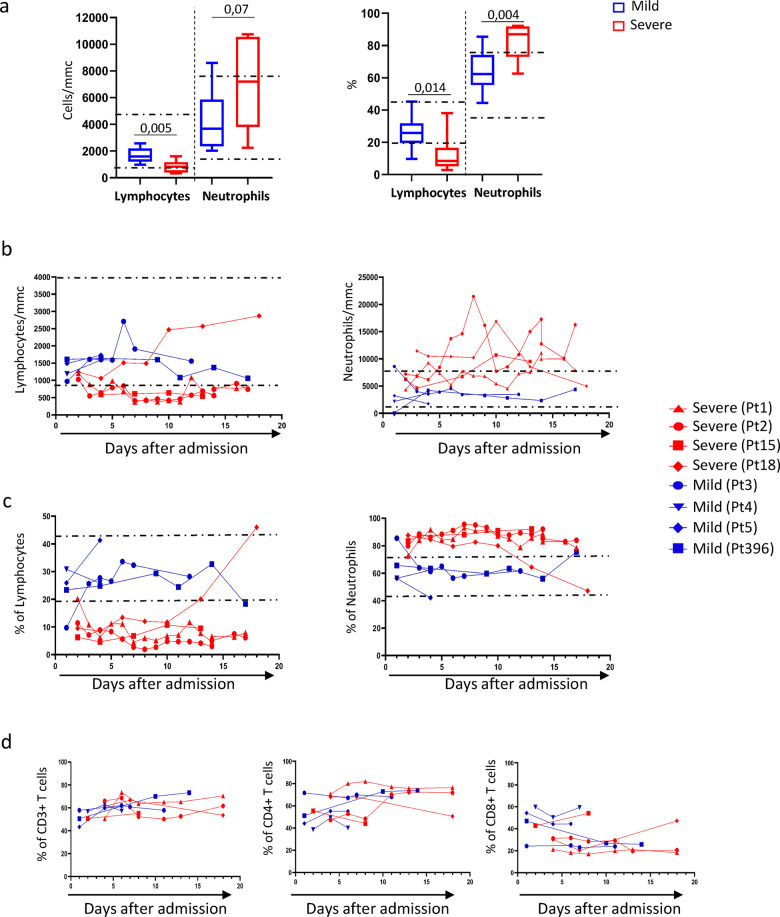
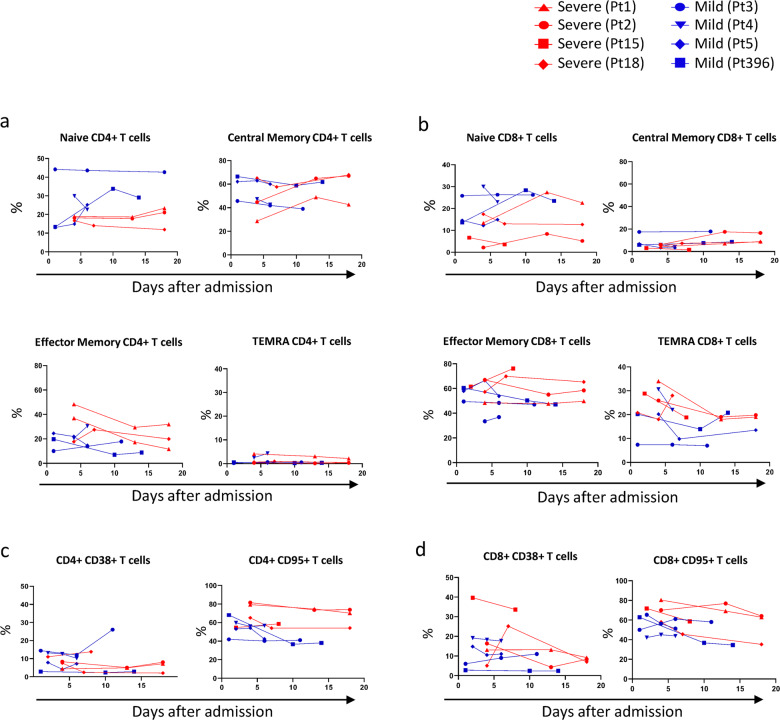
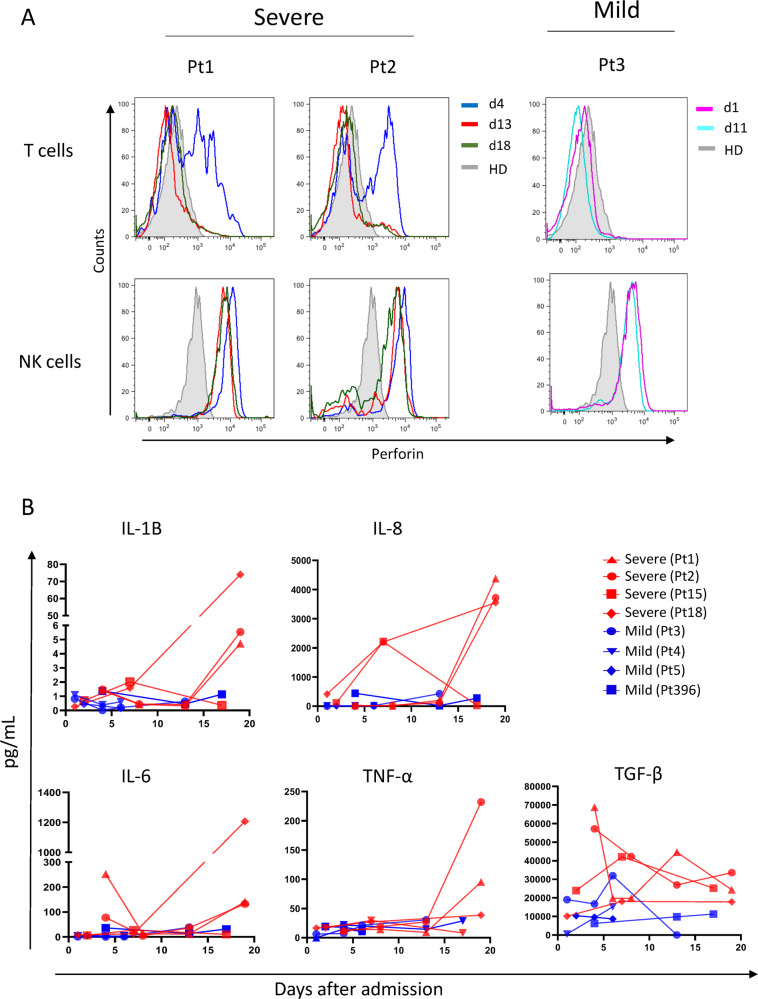
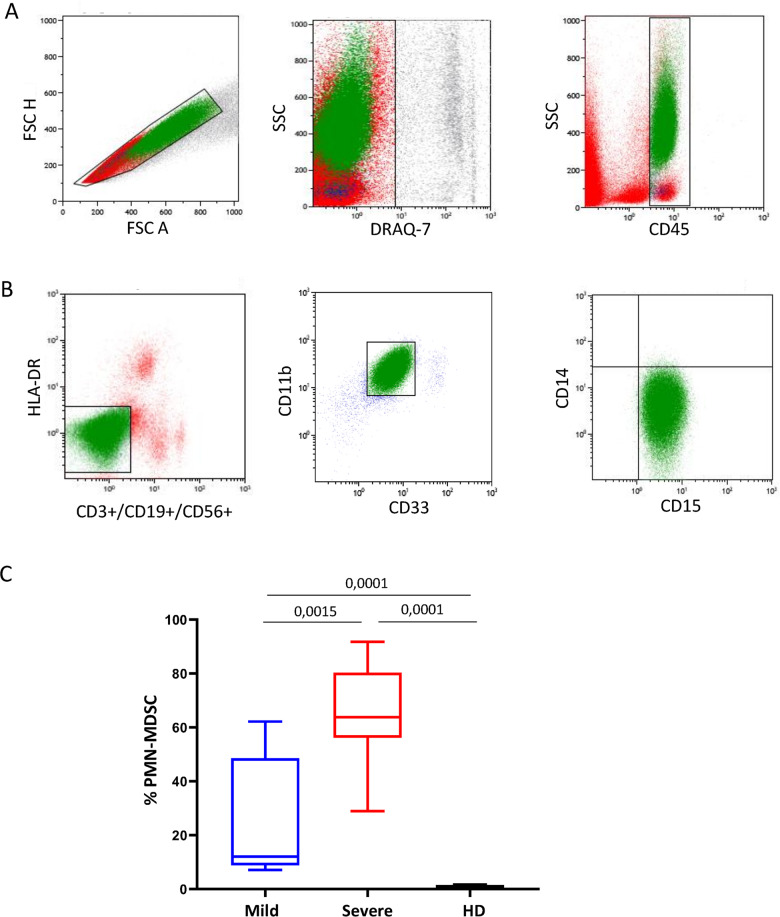
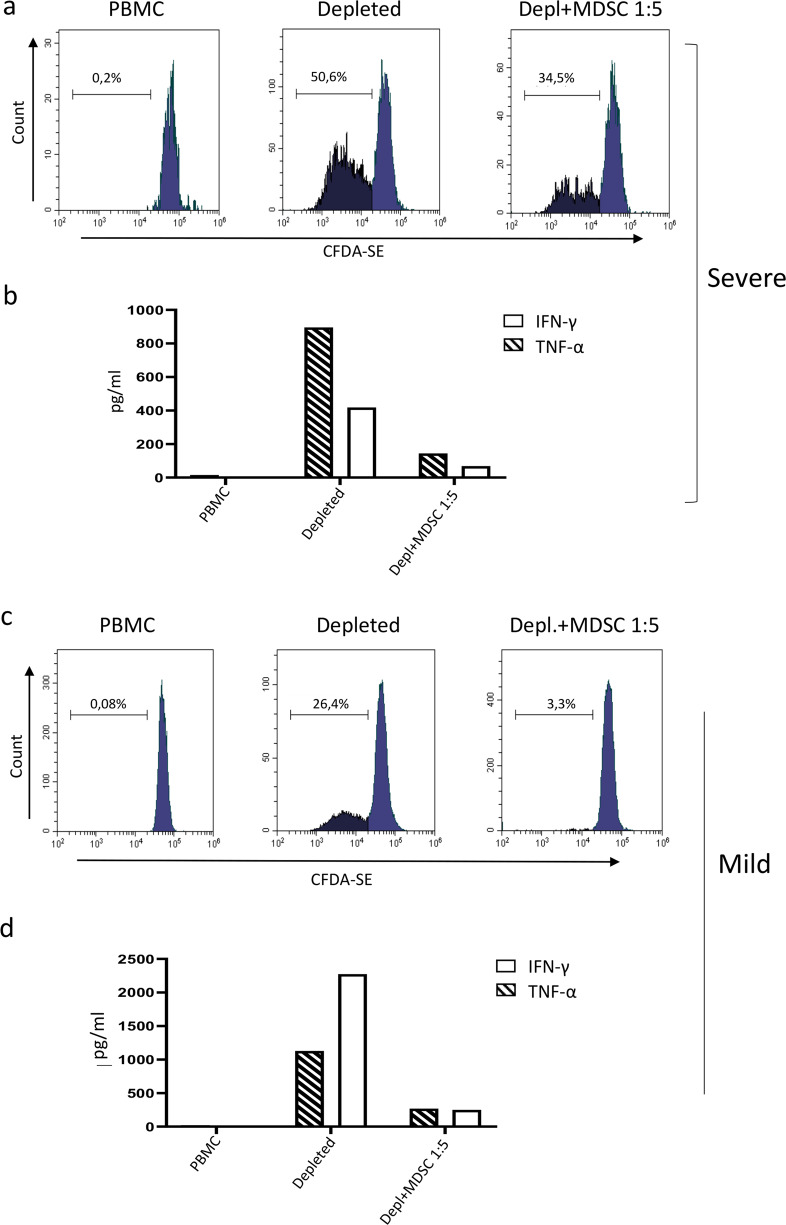
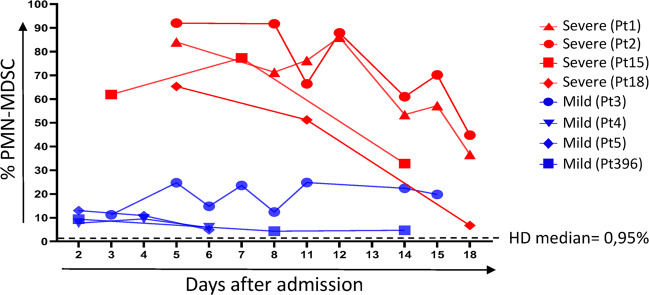
SARS-CoV-2 is associated with a 3.4% mortality rate in patients with severe disease. The pathogenesis of severe cases remains unknown. We performed an in-depth prospective analysis of immune and inflammation markers in two patients with severe COVID-19 disease from presentation to convalescence. Peripheral blood from 18 SARS-CoV-2-infected patients, 9 with severe and 9 with mild COVID-19 disease, was obtained at admission and analyzed for T-cell activation profile, myeloid-derived suppressor cells (MDSCs) and cytokine profiles. MDSC functionality was tested in vitro. In four severe and in four mild patients, a longitudinal analysis was performed daily from the day of admission to the early convalescent phase. Early after admission severe patients showed neutrophilia, lymphopenia, increase in effector T cells, a persisting higher expression of CD95 on T cells, higher serum concentration of IL-6 and TGF-β, and a cytotoxic profile of NK and T cells compared with mild patients, suggesting a highly engaged immune response. Massive expansion of MDSCs was observed, up to 90% of total circulating mononuclear cells in patients with severe disease, and up to 25% in the patients with mild disease; the frequency decreasing with recovery. MDSCs suppressed T-cell functions, dampening excessive immune response. MDSCs decline at convalescent phase was associated to a reduction in TGF-β and to an increase of inflammatory cytokines in plasma samples. Substantial expansion of suppressor cells is seen in patients with severe COVID-19. Further studies are required to define their roles in reducing the excessive activation/inflammation, protection, influencing disease progression, potential to serve as biomarkers of disease severity, and new targets for immune and host-directed therapeutic approaches.


Conflict of interest statement

The authors declare that they have no conflict of interest.

Figures

Fig. 1
Fig. 1. Neutrophils and lymphocytes distribution in SARS-CoV-2-infected patients.
a Neutrophils/lymphocytes absolute number and percentage were analyzed in nine severe (red boxes) and in nine mild (blue boxes) COVID-19 patients. Results are shown as box and whiskers. The Mann–Whitney test was used. b Kinetic analysis of neutrophils/lymphocytes absolute number and percentage in four severe and in four mild COVID-19 patients. c Kinetic analysis of CD3+, CD4+ and CD8+ T-cell frequency among T lymphocytes was analyzed by flow cytometry (d). Red lines and blue lines represent severe (Pt1 and Pt2, Pt15, Pt18) and mild (Pt3, Pt4, Pt5 and Pt396) SARS-CoV-2-infected patients, respectively. Dashed line: normal values.
Fig. 2
Fig. 2. Differentiation and activation profile of CD4+ and CD8+ T lymphocytes in SARS-CoV-2-infected patients.
Differentiation profile [Naive, NA/Precursor (CD45RA+CCR7+), Central Memory (CD45RA−CCR7+), Effectory Memory (CD45RA−CCR7−); Terminally differentiated T cell (TEMRA: CD45RA+CCR7−)] in CD4 (a) and in CD8 (b) T lymphocytes. The frequency of CD38 and CD95 expressing CD4 (c) and CD8 (d) T cells was analyzed in SARS-CoV-2-infected patients by flow cytometry. Red lines and blue lines represent severe (Pt1, Pt2, Pt15 and Pt18) and mild (Pt3, Pt4, Pt5 and Pt396) SARS-CoV-2-infected patients, respectively. Dashed line: median of normal values.
Fig. 3
Fig. 3. Perforin expression and inflammatory mediators in SARS-CoV-2-infected patients.
a Perforin in CD3+ T cells and in CD3-Natural Killer cells was analyzed during different time points in severe (day 4, blue line; day 13, red line; day 18, green line) and in mild (day 1, violet line; day 11, blue light line) SARS-CoV-2-infected patients by flow cytometry. Full grey histogram represent healthy donors (HD) (a). Pro-inflammatory factors of SARS-CoV-2-infected patients were analyzed by automated ELISA (b). Red lines and blue lines represent severe (Pt1, Pt2, Pt15 and Pt18) and mild (Pt3, Pt4, Pt5 and Pt396) SARS-CoV-2-infected patients, respectively.
Fig. 4
Fig. 4. MDSC gating strategy and frequency in PBMC in SARS-CoV-2-infected patients.
Myeloid-derived suppressor cells (MDSC) were identified in PBMCs by flow cytometry. a, b Representative plots of the adopted gating strategy to identify MDSC. Doublets were excluded in the FSC-H/FSC-A dot plot. In the leucocytes plot (SideScatter (SSC)/CD45), the CD45+ cells were gated (a), followed by gating on Lin-(CD3−CD19−CD56−)/HLA DRlow/− cell (b). Cells were then selected as CD3+CD11b+, and the expression of CD15+ and CD14− was evaluated (b). c Frequency of PMN-MDSC in nine mild (blue box), nine severe (red box) patients and in eight healthy donors (HD, black box). Results are shown as box and whiskers. The Mann–Whitney test was applied, and p < 0.05 was considered significant.
Fig. 5
Fig. 5. MDSC inhibition capability.
MDSC suppressive capability was analyzed by testing T-cells proliferation and by cytokine quantification. PBMC and MDSC-depleted PBMC (depleted) from severe (a) and mild (c) SARS-CoV-2-infected patients were labelled with CFDA-SE. Purified PMN-MDSC were added to MDSC-depleted PBMCs at 1:5 ratio (depl.+MDSC 1:5). Staphylococcus enterotoxin B (SEB) was added to all conditions, and proliferation capability was analyzed after 4 days by flow cytometry. Cytokines were analyzed in supernatants of PBMC, PMN-MDSC-depleted PBMC and PMN-MDSC-depleted PBMC + purified PMN-MDSC (1:5) in severe (b) and mild (d) SARS-CoV-2-infected patients by automated ELISA after 48 h of culture.
Fig. 6
Fig. 6. Kinetic of MDSC in SARS-CoV-2-infected patients.
MDSC frequency was analyzed in PBMC from severe (Pt1, Pt2, Pt15 and Pt18) and mild (Pt3, Pt4, Pt5 and Pt396) COVID-19 patients at different time points. Dashed line: median of HD values.

References

    1. WHO. Novel coronavirus—China. http://www.who.int/csr/don/12-january-2020-novel-coronavirus-china/en (2020). Accessed 19 Jan 2020.
    1. Huang C, Wang Y, Li X, Ren L, Zhao J, Hu Y, et al. Clinical features of patients infected with 2019 novel coronavirus in Wuhan, China. Lancet. 2020;395:497–506. doi: 10.1016/S0140-6736(20)30183-5. - DOI - PMC - PubMed
    1. Chan JF, Yuan S, Kok KH, To KK, Chu H, Yang J, et al. A familial cluster of pneumonia associated with the 2019 novel coronavirus indicating person-to-person transmission: a study of a family cluster. Lancet. 2020;395:514–23. doi: 10.1016/S0140-6736(20)30154-9. - DOI - PMC - PubMed
    1. Wang D, Hu B, Hu C, Wang D, Hu B, Hu C, et al. Clinical characteristics of 138 hospitalized patients with 2019 novel coronavirus-infected pneumonia in Wuhan, China. JAMA. 2020;323:1061–9. doi: 10.1001/jama.2020.1585. - DOI - PMC - PubMed
    1. De Wit E, Van Doremalen N, Falzarano D, Munster VJ. SARS and MERS: recent insights into emerging coronaviruses. Nat Rev Microbiol. 2016;14:523. doi: 10.1038/nrmicro.2016.81. - DOI - PMC - PubMed

Publication types

MeSH terms