. 2020 Jul;52(7):669-679.
doi: 10.1038/s41588-020-0640-3. Epub 2020 Jun 8.

Large-scale genome-wide association study in a Japanese population identifies novel susceptibility loci across different diseases

Kazuyoshi Ishigaki  1   2   3   4 Masato Akiyama  1   5 Masahiro Kanai  1   4   6 Atsushi Takahashi  1   7 Eiryo Kawakami  8   9   10 Hiroki Sugishita  9 Saori Sakaue  1   11   12 Nana Matoba  1   13 Siew-Kee Low  1   14 Yukinori Okada  1   11   15   16 Chikashi Terao  17 Tiffany Amariuta  2   3   4   6   18 Steven Gazal  4   19 Yuta Kochi  20   21 Momoko Horikoshi  22 Ken Suzuki  1   11   22   23 Kaoru Ito  24 Satoshi Koyama  24 Kouichi Ozaki  25 Shumpei Niida  25 Yasushi Sakata  26 Yasuhiko Sakata  27 Takashi Kohno  28 Kouya Shiraishi  28 Yukihide Momozawa  29 Makoto Hirata  30 Koichi Matsuda  31 Masashi Ikeda  32 Nakao Iwata  32 Shiro Ikegawa  33 Ikuyo Kou  33 Toshihiro Tanaka  34   35 Hidewaki Nakagawa  36 Akari Suzuki  20 Tomomitsu Hirota  37 Mayumi Tamari  37 Kazuaki Chayama  38 Daiki Miki  38 Masaki Mori  39 Satoshi Nagayama  40 Yataro Daigo  41   42 Yoshio Miki  43 Toyomasa Katagiri  44 Osamu Ogawa  45 Wataru Obara  46 Hidemi Ito  47   48 Teruhiko Yoshida  49 Issei Imoto  50   51   52 Takashi Takahashi  53 Chizu Tanikawa  54 Takao Suzuki  55 Nobuaki Sinozaki  55 Shiro Minami  56 Hiroki Yamaguchi  57 Satoshi Asai  58   59 Yasuo Takahashi  59 Ken Yamaji  60 Kazuhisa Takahashi  61 Tomoaki Fujioka  46 Ryo Takata  46 Hideki Yanai  62 Akihide Masumoto  63 Yukihiro Koretsune  64 Hiromu Kutsumi  65 Masahiko Higashiyama  66 Shigeo Murayama  67 Naoko Minegishi  68 Kichiya Suzuki  68 Kozo Tanno  69 Atsushi Shimizu  69 Taiki Yamaji  70 Motoki Iwasaki  70 Norie Sawada  70 Hirokazu Uemura  71   72 Keitaro Tanaka  73 Mariko Naito  74   75 Makoto Sasaki  69 Kenji Wakai  74 Shoichiro Tsugane  76 Masayuki Yamamoto  68 Kazuhiko Yamamoto  20 Yoshinori Murakami  77 Yusuke Nakamura  78 Soumya Raychaudhuri #  79   80   81   82   83 Johji Inazawa #  84   85 Toshimasa Yamauchi #  86 Takashi Kadowaki #  87 Michiaki Kubo #  88 Yoichiro Kamatani #  89   90
Affiliations

Large-scale genome-wide association study in a Japanese population identifies novel susceptibility loci across different diseases

Kazuyoshi Ishigaki et al. Nat Genet. 2020 Jul.

Abstract

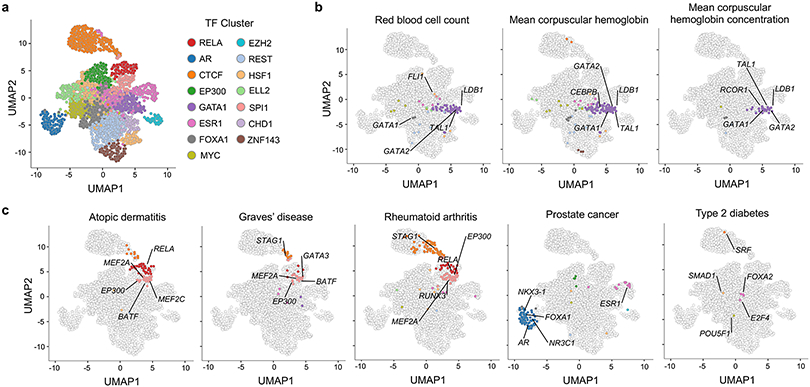
The overwhelming majority of participants in current genetic studies are of European ancestry. To elucidate disease biology in the East Asian population, we conducted a genome-wide association study (GWAS) with 212,453 Japanese individuals across 42 diseases. We detected 320 independent signals in 276 loci for 27 diseases, with 25 novel loci (P < 9.58 × 10⁻⁹). East Asian-specific missense variants were identified as candidate causal variants for three novel loci, and we successfully replicated two of them by analyzing independent Japanese cohorts; p.R220W of ATG16L2 (associated with coronary artery disease) and p.V326A of POT1 (associated with lung cancer). We further investigated enrichment of heritability within 2,868 annotations of genome-wide transcription factor occupancy, and identified 378 significant enrichments across nine diseases (false discovery rate < 0.05) (for example, NKX3-1 for prostate cancer). This large-scale GWAS in a Japanese population provides insights into the etiology of complex diseases and highlights the importance of performing GWAS in non-European populations.


Figures

Extended Data Fig. 1
Extended Data Fig. 1. Study design of this GWAS.
a, Study designs in this GWAS. Study design 1 (top) was used in the main analysis. An example of study design 1 is provided; in GWAS of disease 3, we included all other patients (except those have related diseases) into control group. The definition of related diseases is provided in Supplementary Table 1. Study design 2 (bottom) was used to discuss the appropriateness of study design selection. b, Effect size estimates and S.E. at the 309 autosomal disease-associated variants detected in sex-combined analysis (P < 5 x 10⁻⁸). We compared the effect size estimates in study design 1 with those in study design 2. Heterogeneity between two studies was tested using Cochran’s Q test. The identity line is shown in blue. The red dot (rs373205748 associated with arrhythmia) indicates a variant with significant heterogeneity in effect size estimates between two study designs (P = 0.00012 < 0.05/309).
Extended Data Fig. 2
Extended Data Fig. 2. Replication analysis of previous GWAS findings using this GWAS results.
We compared effect sizes reported in the previous GWAS with those in this GWAS. Effect size and S.E. are shown. The identity line is shown in blue. The sample size of GWAS is provided in Table 1. We utilized a generalized linear mixed model in our GWAS.
Extended Data Fig. 3
Extended Data Fig. 3. Low allele frequency might contribute to replication failure.
We first compared effect sizes reported in the previous GWAS with those in our GWAS (Supplementary Table 3 and Extended Data Figure 2); 1,219 out of 1,396 previously reported risk alleles were replicated with the same effect direction (177 alleles were not replicated). We compared MAF of replicated variants (n=1,219) and MAF of not replicated variants (n=177). Mann-Whitney U test P value is provided (two-sided test).
Extended Data Fig. 4
Extended Data Fig. 4. Permutation test to estimate appropriate P value threshold to control type I errors.
Using 1,000 simulated binary phenotypes with down-sampled samples (n=10,000), we conducted GWAS utilizing the same strategy as used in the main analysis. a, The distribution of minimum P values in each phenotype (Pmin). The 95-th percentile of Pmin was 2.87 x 10⁻⁸. The 95% confidence interval was estimated by 1,000 bootstraps. b, The distributions of Pmin using all samples (n=198,137) and those using 10,000 samples. To increase computational efficiency, we restricted this analysis to imputed genotype data in chromosome 22. For this analysis in b, we utilized Plink2.
Extended Data Fig. 5
Extended Data Fig. 5. Allele frequency comparison between novel and known disease-associated variants.
MAF comparison at disease-associated variants at novel (n=41) and known loci (n=153) with suggestive significance (P < 5 x 10⁻⁸) (a, East Asian populations; b, European populations in 1KG phase3). For known loci, we restricted this analysis to loci where the closest reported variants were discovered by GWAS in European populations. Mann-Whitney U test P value is provided (two-sided test).
Extended Data Fig. 6
Extended Data Fig. 6. A novel association which can be explained by an East Asian-specific missense variant.
A regional association plot for keloid (812 cases vs 211,641 controls) at the PHLDA3 region is provided. We utilized a generalized linear mixed model in our GWAS.
Extended Data Fig. 7
Extended Data Fig. 7. The association of p.V326A of POT1 for all diseases in this GWAS.
Effect size and S.E. are provided for neoplastic diseases (a) and non-neoplastic diseases (b). The sample size of GWAS is provided in Table 1. We utilized a generalized linear mixed model in our GWAS.
Extended Data Fig. 8
Extended Data Fig. 8. Comparison of allelic directions between this GWAS and previous European GWAS at known loci.
a, Schematic explanations how we compared statistics between BBJ-GWAS and GWAS conducted in European populations (EUR-GWAS). We utilized two inclusion criteria of known loci: (i) EUR-GWAS has significant associations (P < 5 x 10⁻⁸) within 1Mb from the BBJ-lead variants and (ii) the BBJ-lead variant is in LD with the lead variant in the European-GWAS (r2 > 0.4 in European samples in 1KG phase3). The first criterion was added to exclude loci where EUR-GWAS has insufficient power (112 known loci remained after applying the first criterion). The second criterion was added because EUR-GWAS statistics at the BBJ-lead variant is not representing those at the EUR-lead variant when they are not in LD. b, effect sizes of BBJ- and EUR-GWAS at the BBJ-lead variants. All variants which passed the first criterion were used (n=112). Variants which passed the second criterion are shown in red (n=65). Since two variants have extremely large effect size, we provided two plots in different scales. The three variants with the opposite effect directions are marked by large dots, and their details are also provided. c, Regional association of T2D around rs12031188. Variants in LD (r2 > 0.4) with BBJ-lead variant (rs12031188) but not with EUR-lead variant are shown in red; Variants in LD (r2 > 0.4) with both lead variants are shown in blue. East Asians and Europeans in 1KG phase3 were used for LD calculation of the BBJ- and the EUR-lead variant, respectively.
Extended Data Fig. 9
Extended Data Fig. 9. Genetic correlations between male- and female-specific GWAS.
a. Genetic correlations between male- and female-specific GWAS. Estimates of genetic correlation and standard errors are provided. *: genetic correlation was significantly different from one (two-sided t test P = 2.2 x 10⁻³ < 0.05/20). b. The results of S-LDSC analysis based on sex-specific GWAS of asthma using 220 cell-type specific annotations. Significant annotations in either male or female asthma were shown (P < 0.05/220). Heterogeneity was tested by Cochran’s Q test, and its P values (Phet) were also provided. Black dashed line indicates P value = 0.05/220; grey dashed line indicates P value = 0.05.
Extended Data Fig. 10
Extended Data Fig. 10. S-LDSC results of four diseases in our GWAS.
The results of S-LDSC were plotted on the UMAP space. The significant results (FDR<0.05) were highlighted by cluster-specific colors (the same colors as used in Figure 4). The names of the top five most significant TFs were also shown on the plot. The results of diseases with less than five significant TF binding site tracks were shown.
Figure 1.
Figure 1.. Disease-associated loci detected in this GWAS.
a, Phenogram of 331 suggestive loci detected in this GWAS (P < 5.0 x 10⁻⁸). Pleiotropic associations were plotted at the same position (Methods). b, Allele frequencies and the odds ratios (OR) of the lead variants at 331 suggestive loci detected in this GWAS (P < 5.0 x 10⁻⁸). The odds ratio of the risk allele was used. a and b, Novel loci (◆) are annotated by the closest gene names (only genes with OR > 2 are highlighted in b). Genes with significant associations are highlighted by red (P < 9.58 x 10⁻⁹). The sample size of GWAS is provided in Table 1. We utilized a generalized linear mixed model in our GWAS. *, loci detected in sex-specific GWAS. ¶, the lead variants were linked to missense variants (see text for the criteria). c, d, and e, Trans-ethnic minor allele frequency (MAF) comparison of disease-associated variants at novel (n=41) and known loci (n=153) with suggestive significance (P < 5 x 10⁻⁸). For known loci, we restricted this analysis to loci where the closest reported variants were discovered by GWAS in European populations. Mann–Whitney U test P value is provided (two-sided test). When MAF < 0.001, MAF was adjusted to 0.001 to fit in log scale. MAFEAS, MAF in East Asian population (1KG Phase3). MAFEUR, MAF in European population (1KG Phase3). e, The center line in each box indicates the median, and the box limits indicate the upper and lower quartiles. COPD, chronic obstructive pulmonary disease.
Figure 2.
Figure 2.. Novel associations which can be explained by East Asian-specific missense variants.
Regional association plots are provided. a, coronary artery disease (29,319 cases vs 183,134 controls). b, lung cancer (2,710 male cases vs 106,637 male controls; 1,340 female cases vs 101,766 female controls). For coronary artery disease (a), P values from conditional analysis and those in European GWAS were plotted separately. For lung cancer (b), P values from female- and male-specific GWAS were plotted separately. We utilized a generalized linear mixed model in our GWAS.
Figure 3.
Figure 3.. A novel suggestive association of cerebral aneurysm can be explained by artery-specific expression quantitative trait loci (eQTL) signals for ATP2B1.
a. Regional association plots of cerebral aneurysm GWAS (2,820 cases vs 192,383) at ATP2B1 locus (top) and those of eQTL signals for ATP2B1 in the tibial artery (bottom) are provided. The lead variant of GWAS (rs11105352; ◆ dot) and the lead variant of eQTL (rs2681492; ■ dot) are indicated by different shapes. Variants in LD with rs11105352 are highlighted by red (r2 > 0.6 both in East Asian and European populations of 1KG Phase3). We utilized a generalized linear mixed model in our GWAS. b, Tissue-specificity of eQTL signals for ATP2B1 at rs2681492 (the lead variant of eQTL in the tibial artery (■ dot in a)). P values in eQTL analysis and M values (the posterior probability that an eQTL effect exist in each tissue tested in the cross-tissue meta-analysis) in all tissues in GTEx project are provided. Each dot indicates each tissue. All statistics of eQTL analysis were derived from release v7 of GTEx project.
Figure 4.
Figure 4.. Transcription factors (TF) whose binding sites were enriched for heritability of diseases.
a, All of the 2,868 sets of TF binding sites grouped into 15 clusters were plotted in the UMAP space. b and c, The results of S-LDSC were plotted on the UMAP space. The significant results (FDR < 0.05) are highlighted by cluster-specific colors. The names of the top five most significant TFs are also shown on the plot. b, The results of red blood cell-related traits. c, The results of diseases in this GWAS which had more than five significant TF binding site tracks (the results of the other diseases are provided in Extended Data Figure 10).

References

    1. Martin AR et al. Clinical use of current polygenic risk scores may exacerbate health disparities. Nat. Genet 51, 584–591 (2019). - PMC - PubMed
    1. Popejoy AB & Fullerton SM Genomics is failing on diversity. Nature 538, 161–164 (2016). - PMC - PubMed
    1. Morales J et al. A standardized framework for representation of ancestry data in genomics studies, with application to the NHGRI-EBI GWAS Catalog. Genome Biol. 19, 21 (2018). - PMC - PubMed
    1. Diversity matters. Nature Reviews Genetics 20, 495 (2019). - PubMed
    1. Sirugo G, Williams SM & Tishkoff SA The Missing Diversity in Human Genetic Studies. Cell 177, 26–31 (2019). - PMC - PubMed

REFERENCES (for method)

    1. Kuriyama S et al. The Tohoku Medical Megabank Project: Design and Mission. J. Epidemiol 26, 493–511 (2016). - PMC - PubMed
    1. Altshuler DM et al. Integrating common and rare genetic variation in diverse human populations. Nature 467, 52–58 (2010). - PMC - PubMed
    1. Okada Y et al. Deep whole-genome sequencing reveals recent selection signatures linked to evolution and disease risk of Japanese. Nat. Commun 9, 1631 (2018). - PMC - PubMed
    1. Matoba N et al. GWAS of 165,084 Japanese individuals identified nine loci associated with dietary habits. Nat. Hum. Behav (2020). doi:10.1038/s41562-019-0805-1 - DOI - PubMed
    1. Pruim RJ et al. LocusZoom: regional visualization of genome-wide association scan results. Bioinformatics 26, 2336–2337 (2010). - PMC - PubMed

Publication types

Substances