. 2020 Aug;52(8):819-827.
doi: 10.1038/s41588-020-0639-9. Epub 2020 Jun 8.

TETs compete with DNMT3 activity in pluripotent cells at thousands of methylated somatic enhancers

Affiliations

TETs compete with DNMT3 activity in pluripotent cells at thousands of methylated somatic enhancers

Jocelyn Charlton et al. Nat Genet. 2020 Aug.

Abstract

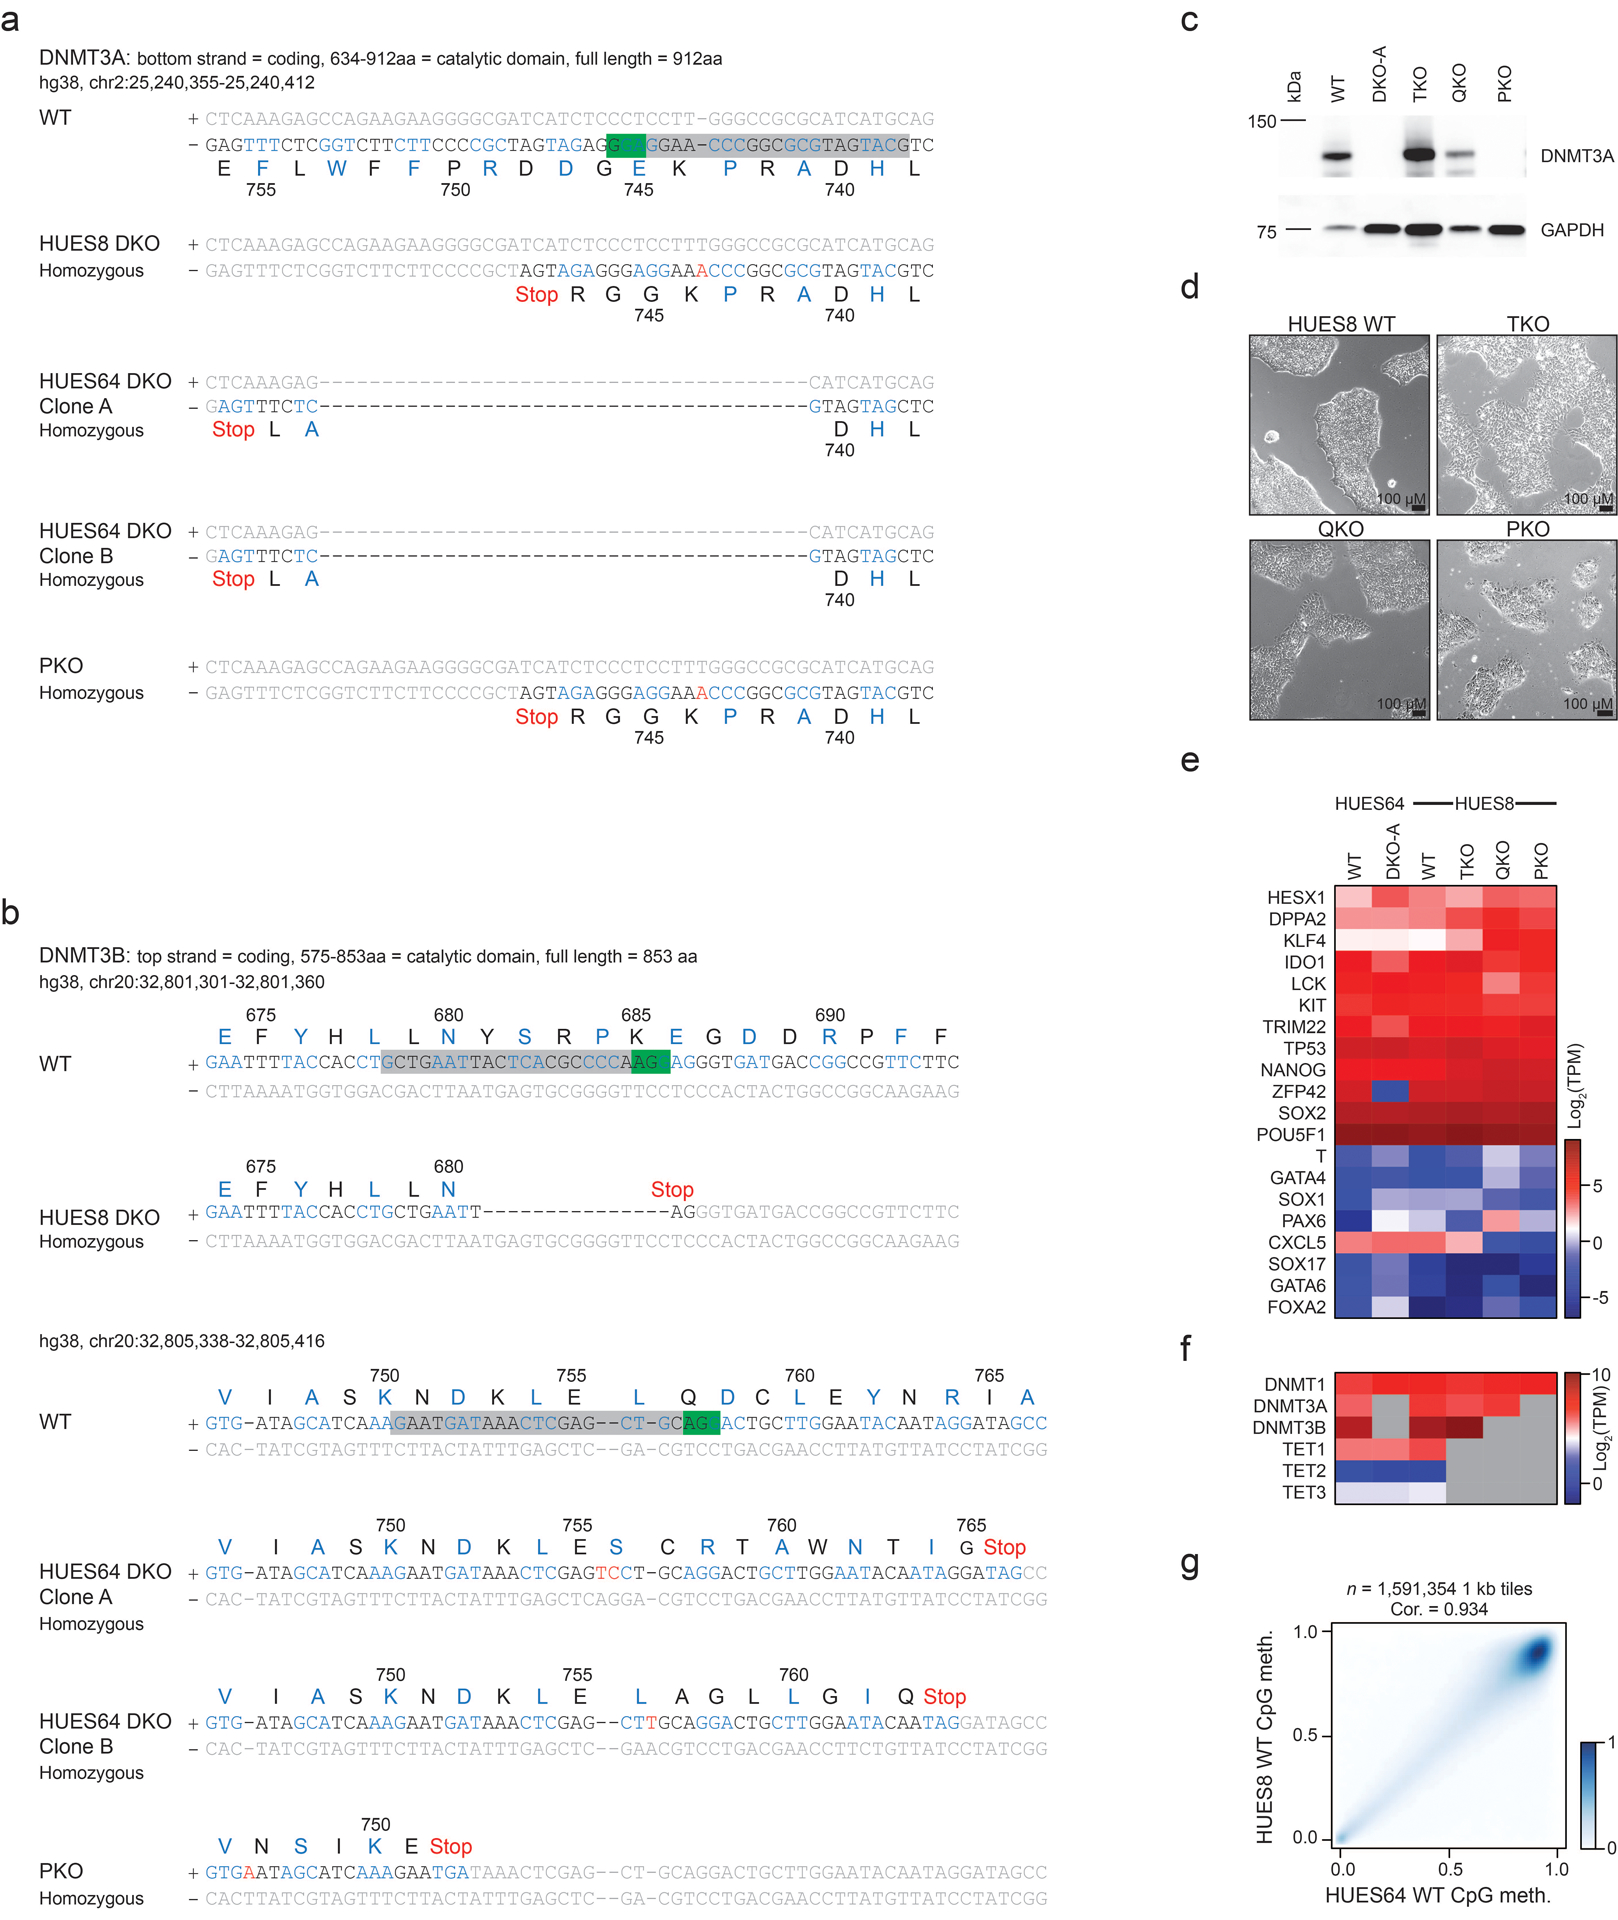
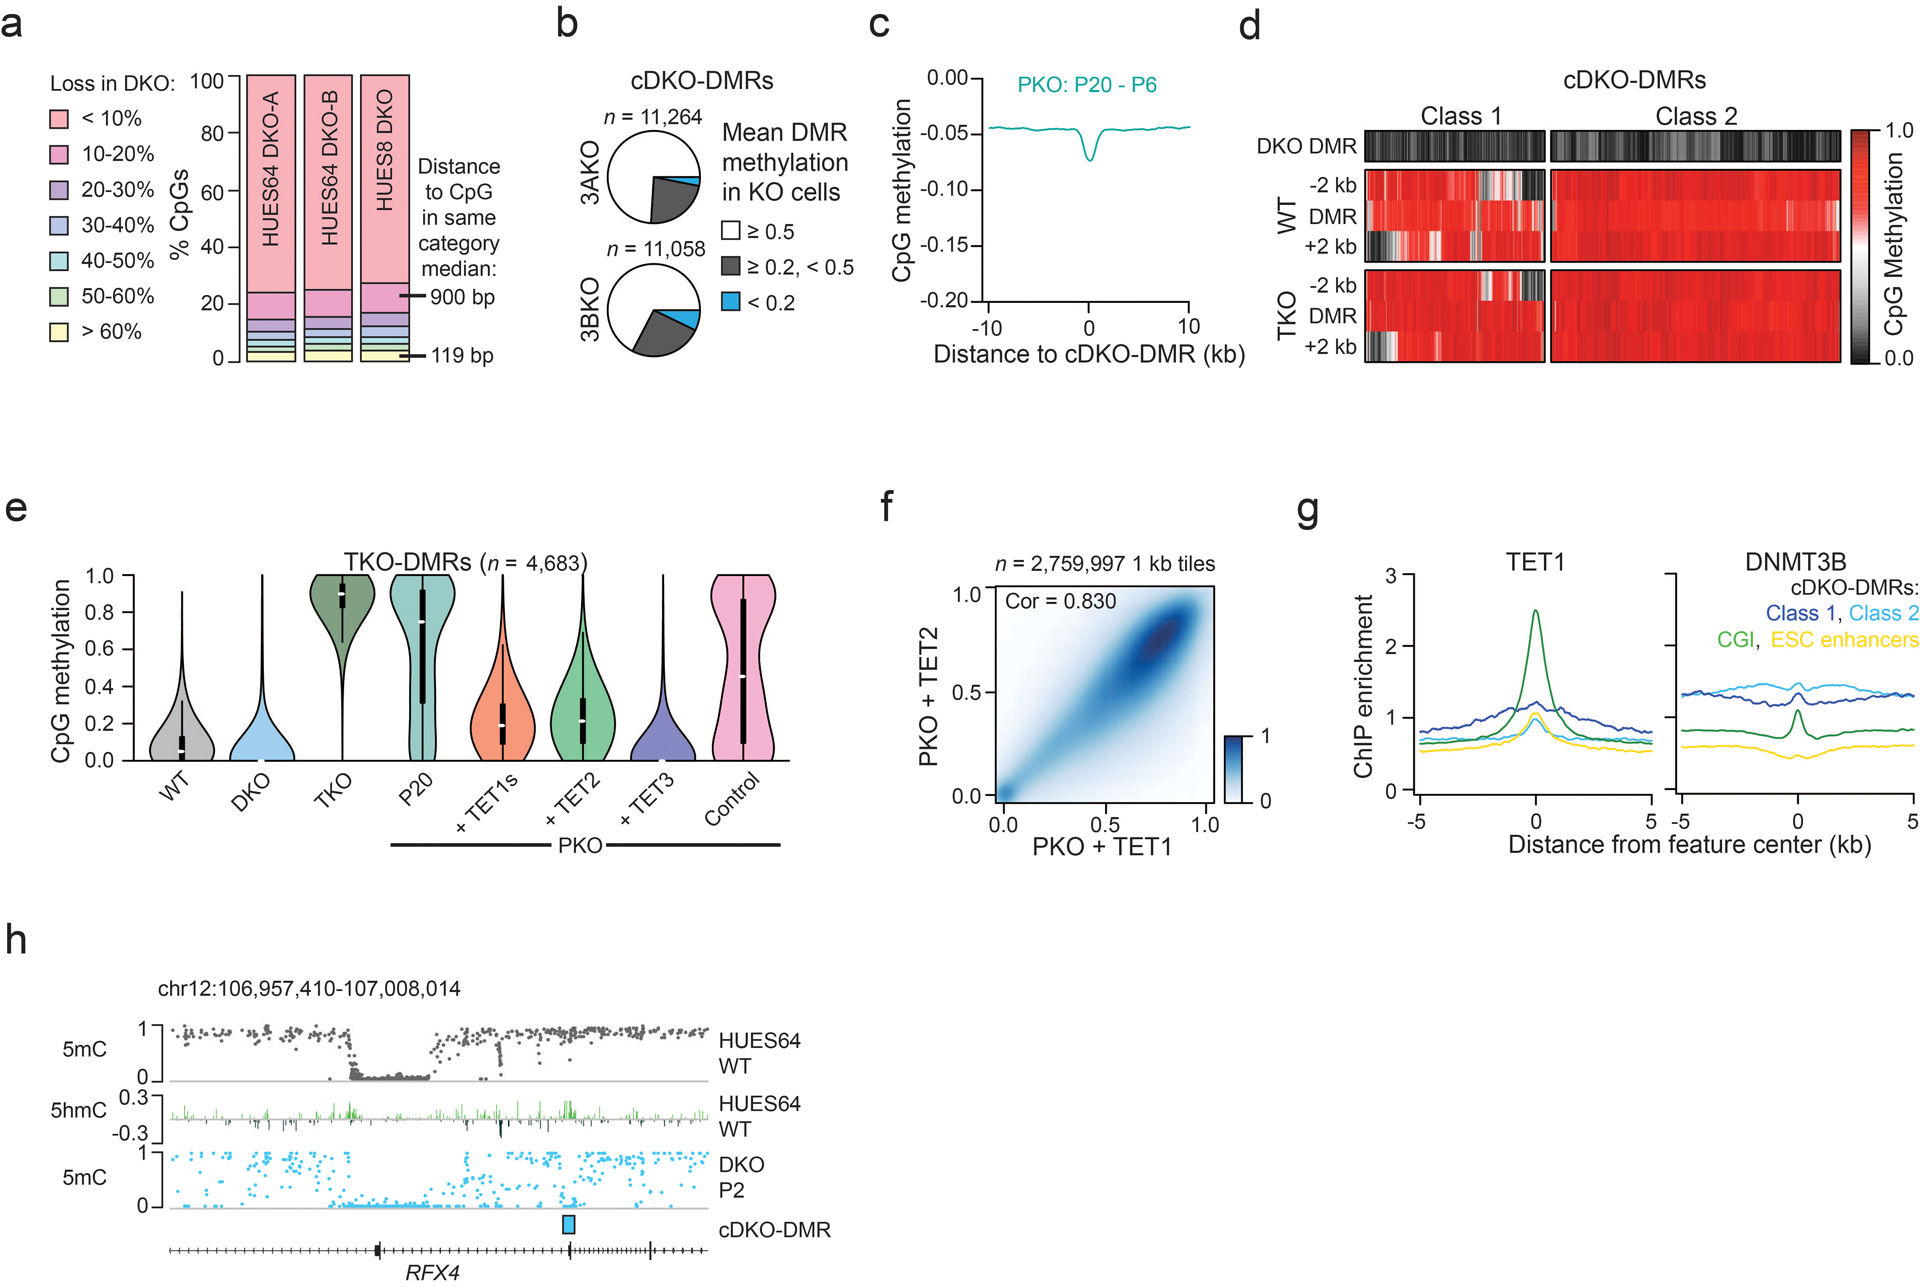
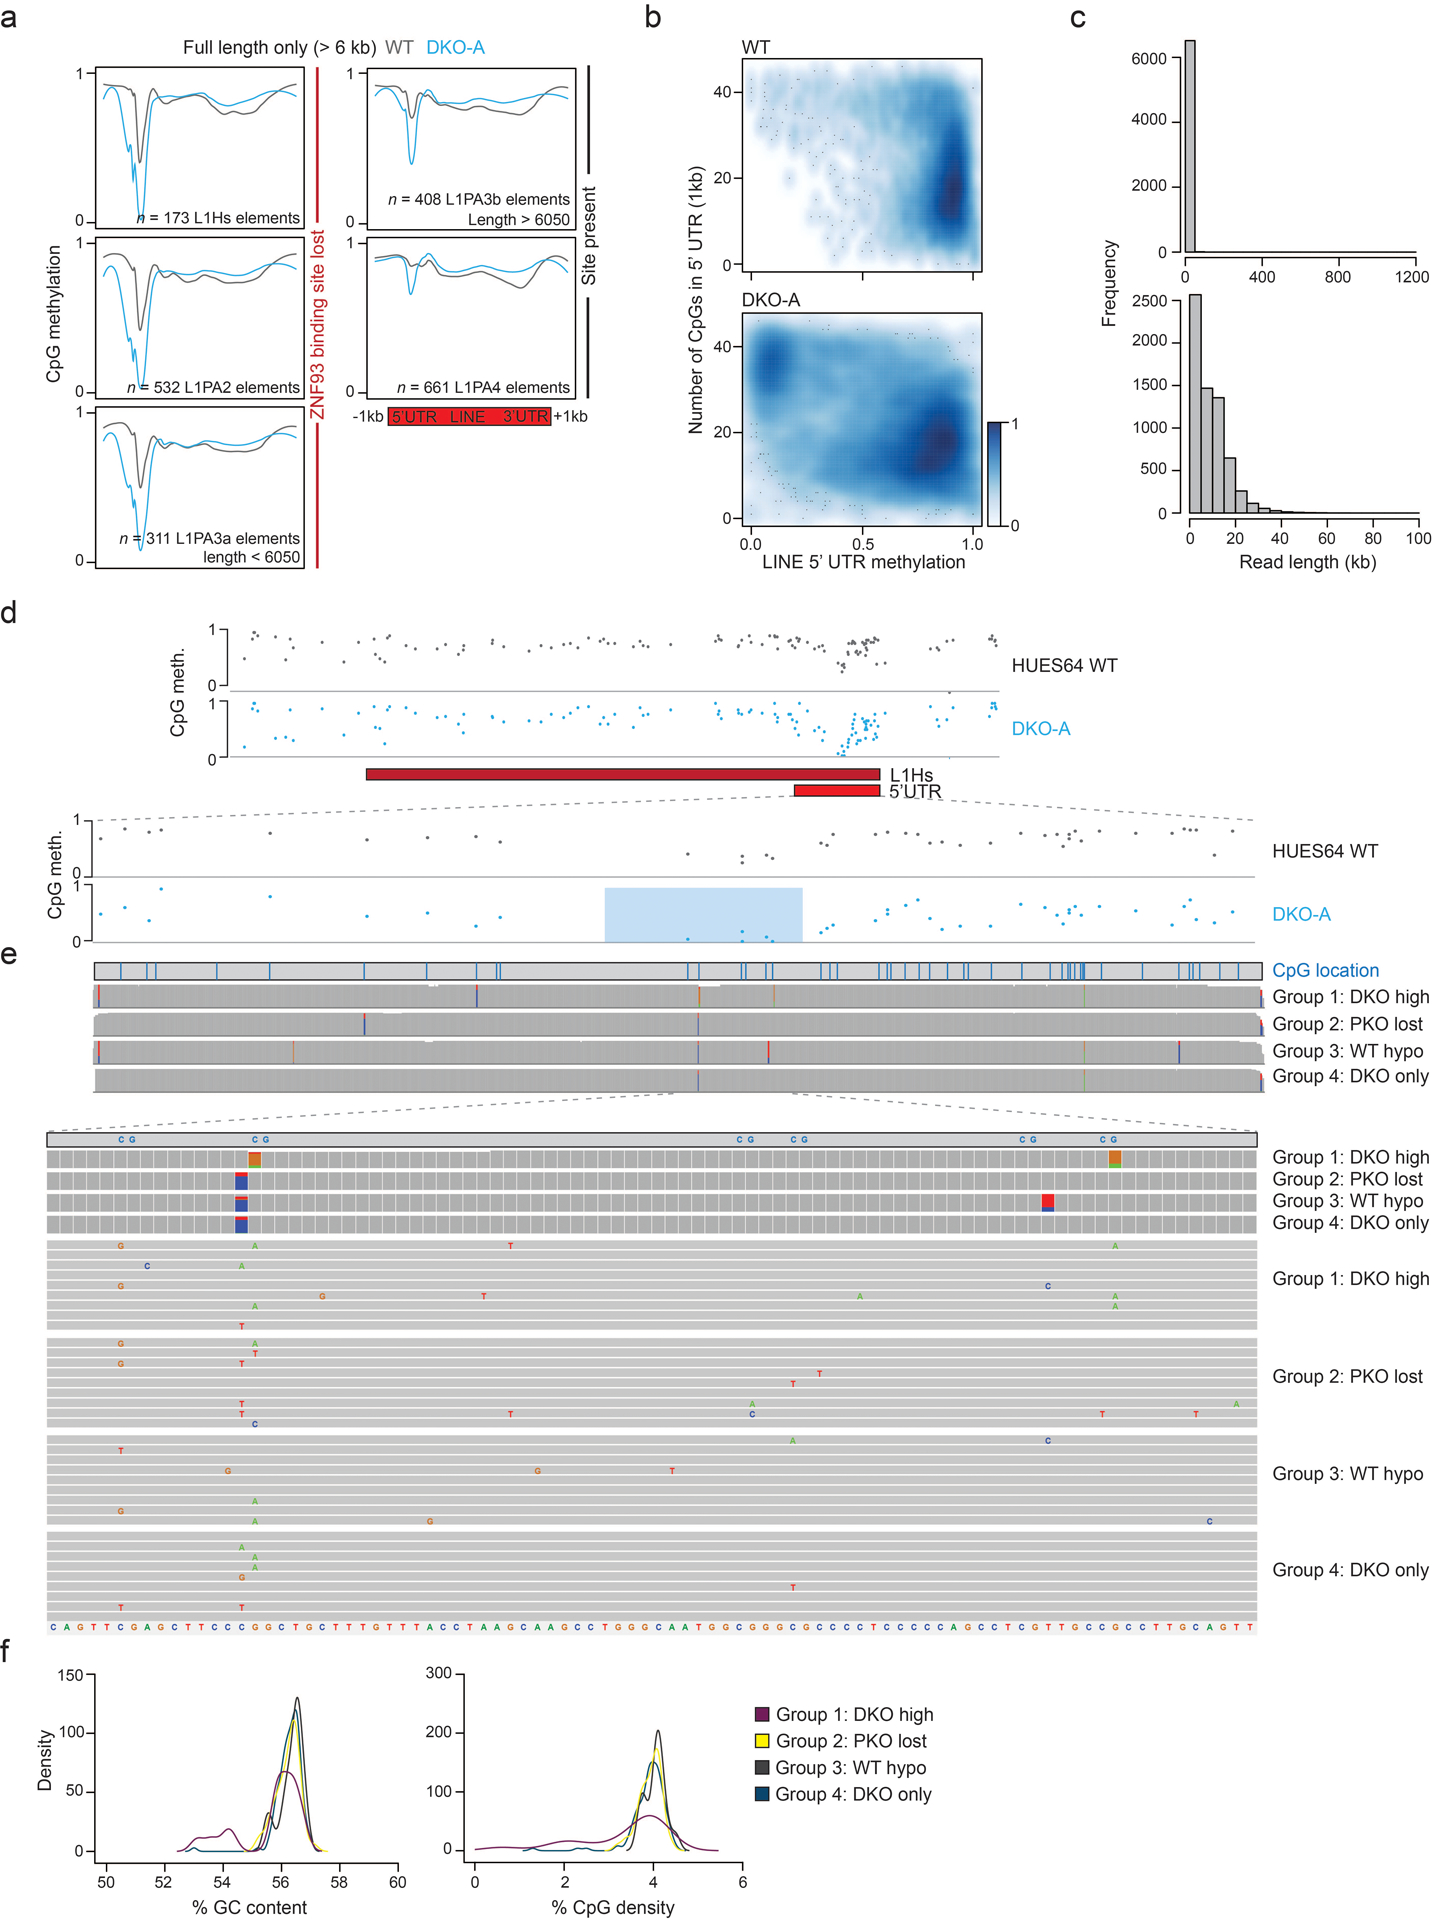
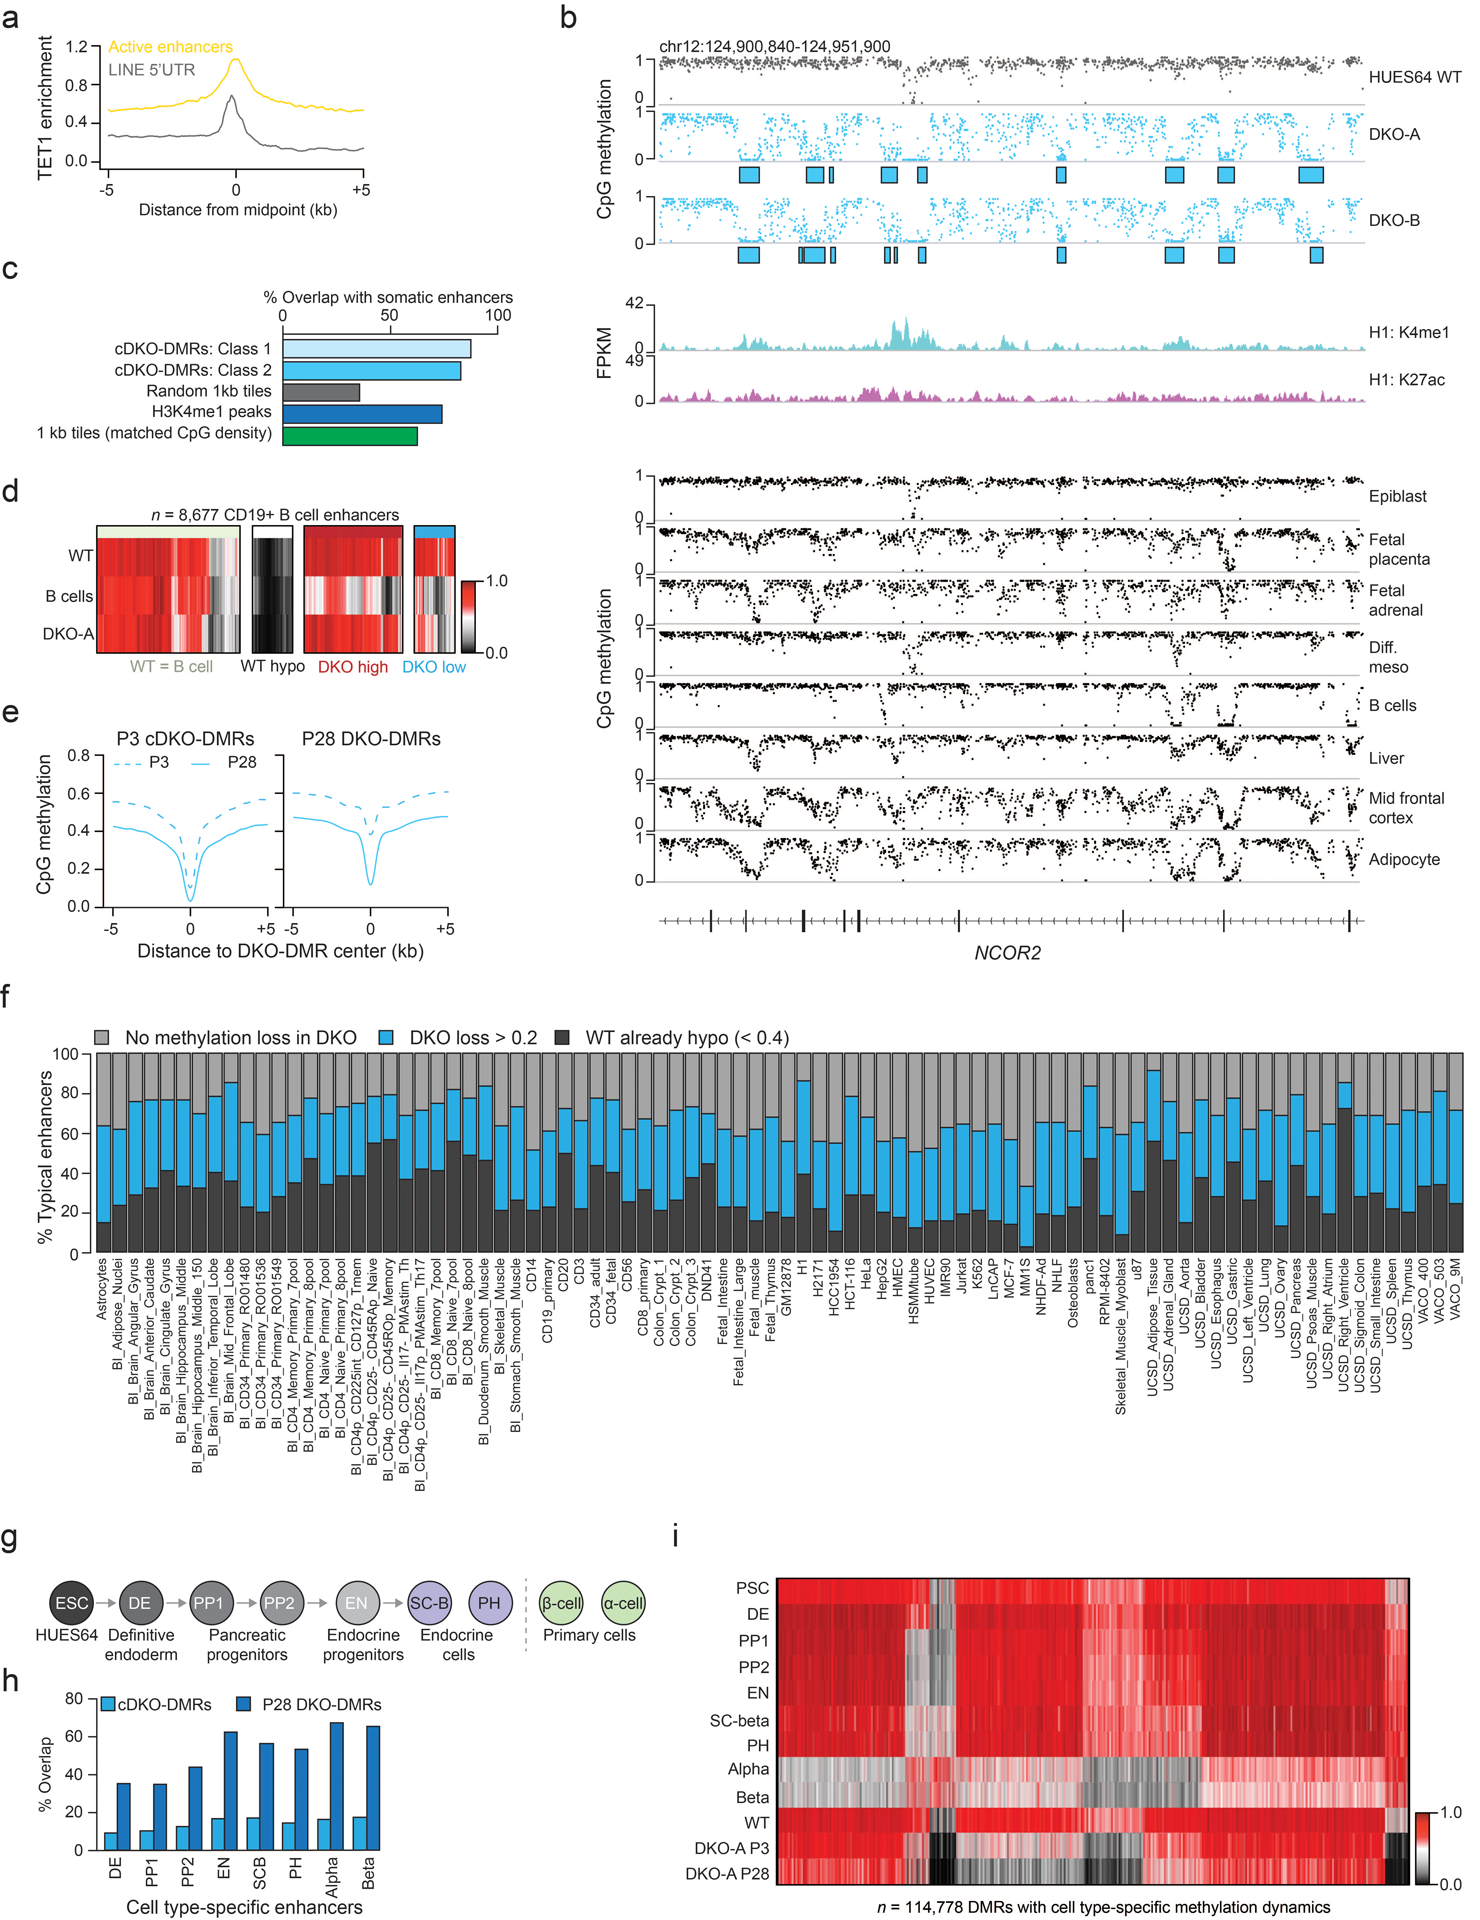
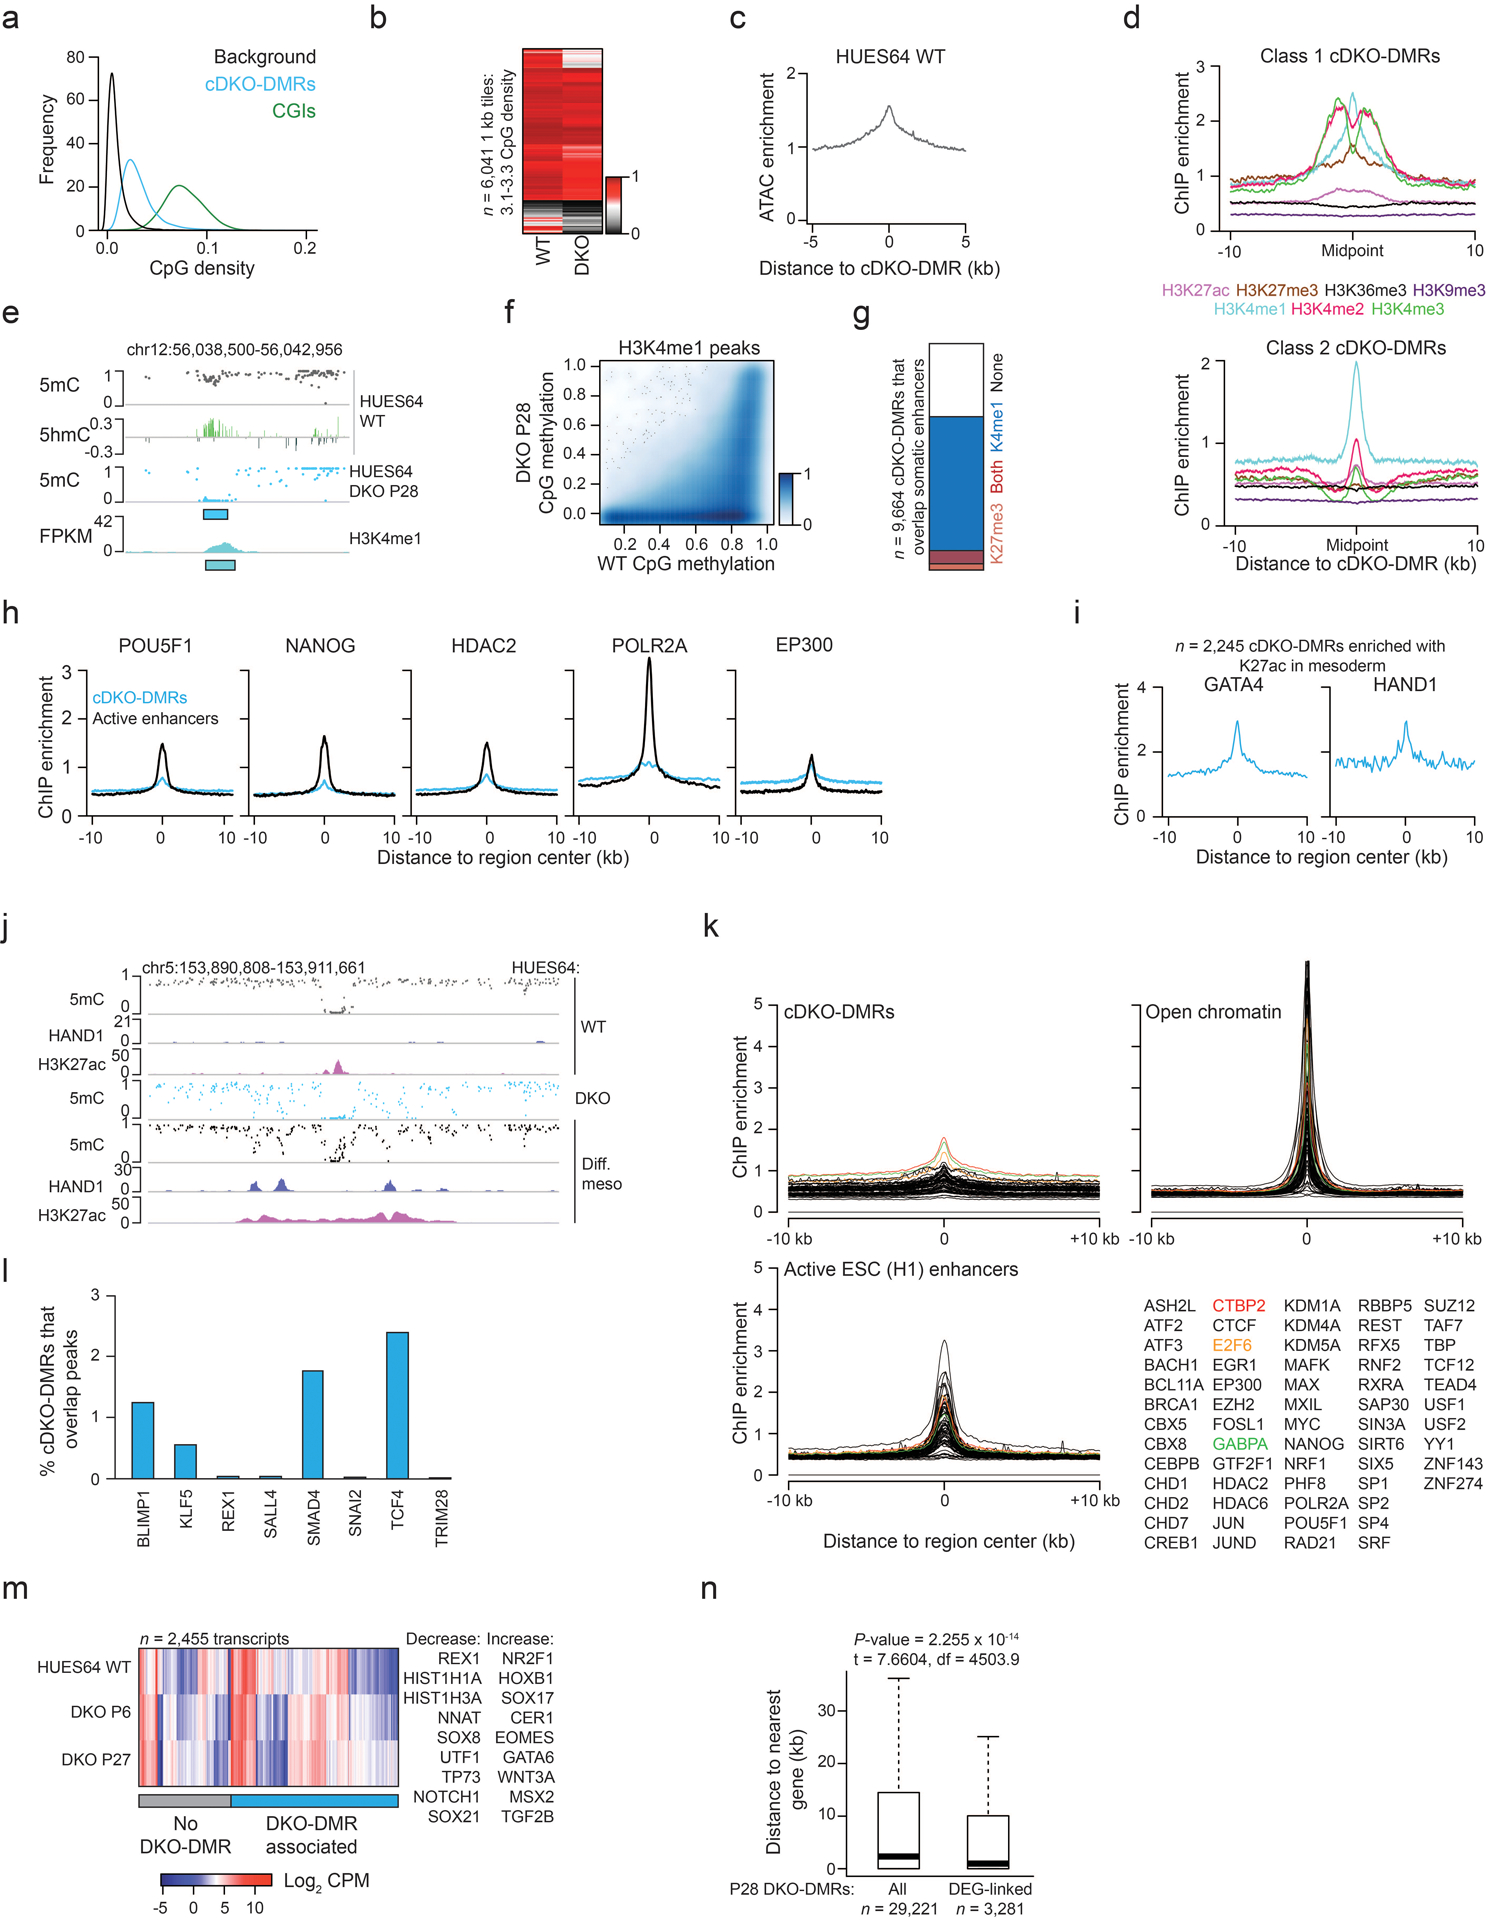
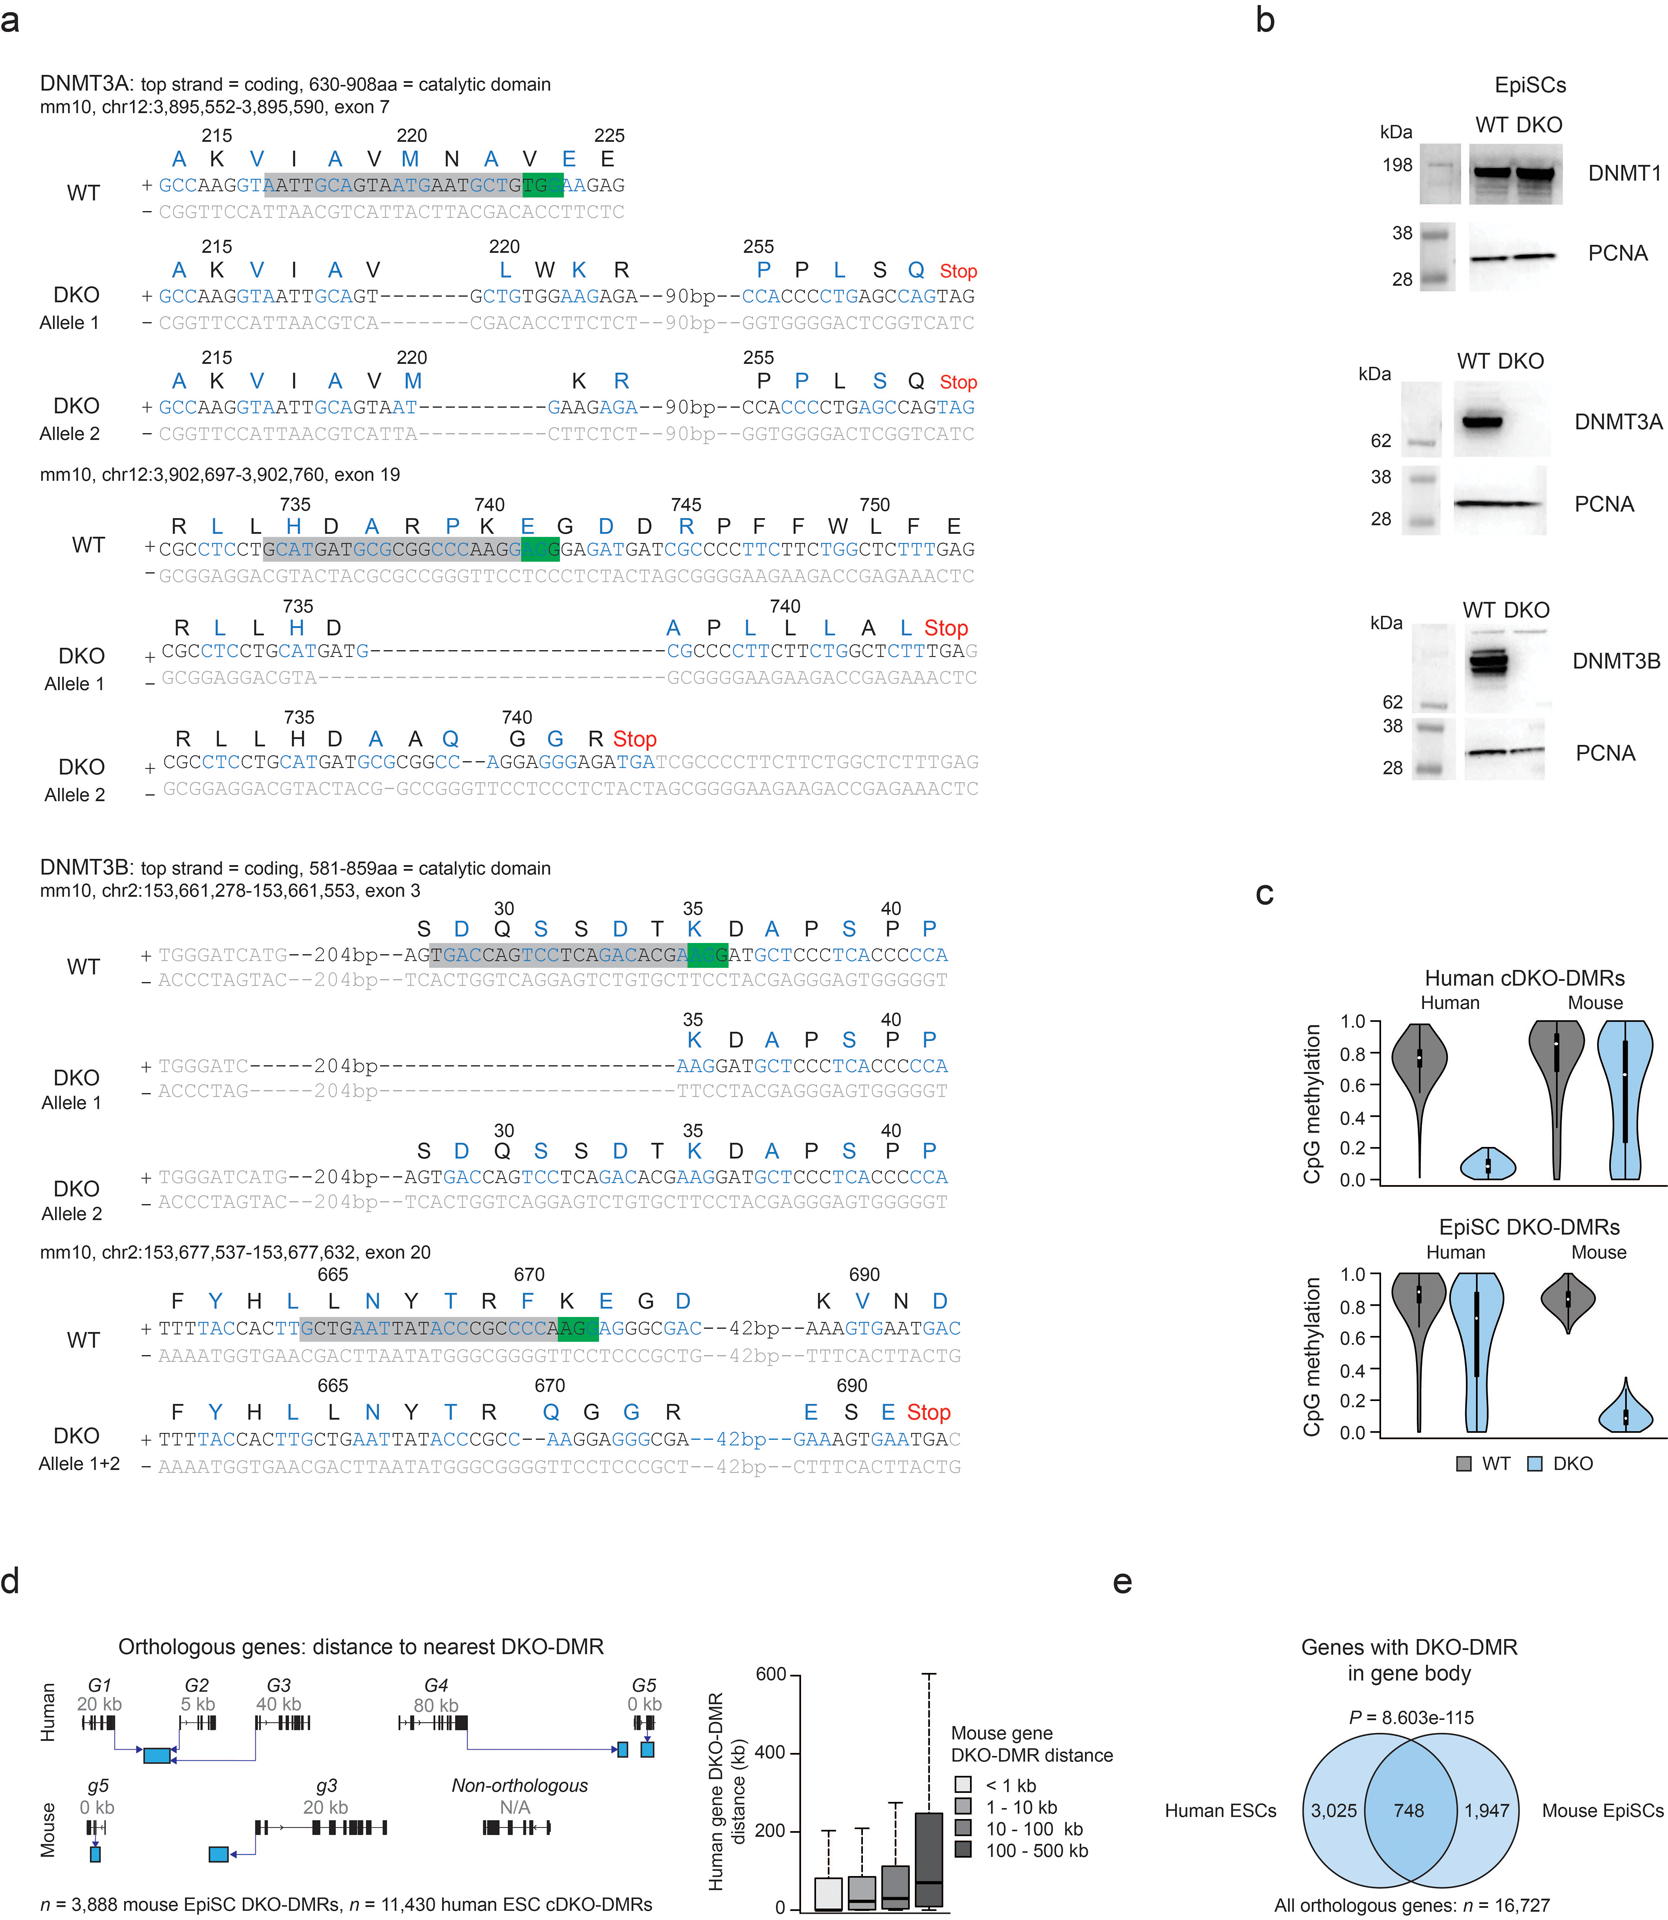
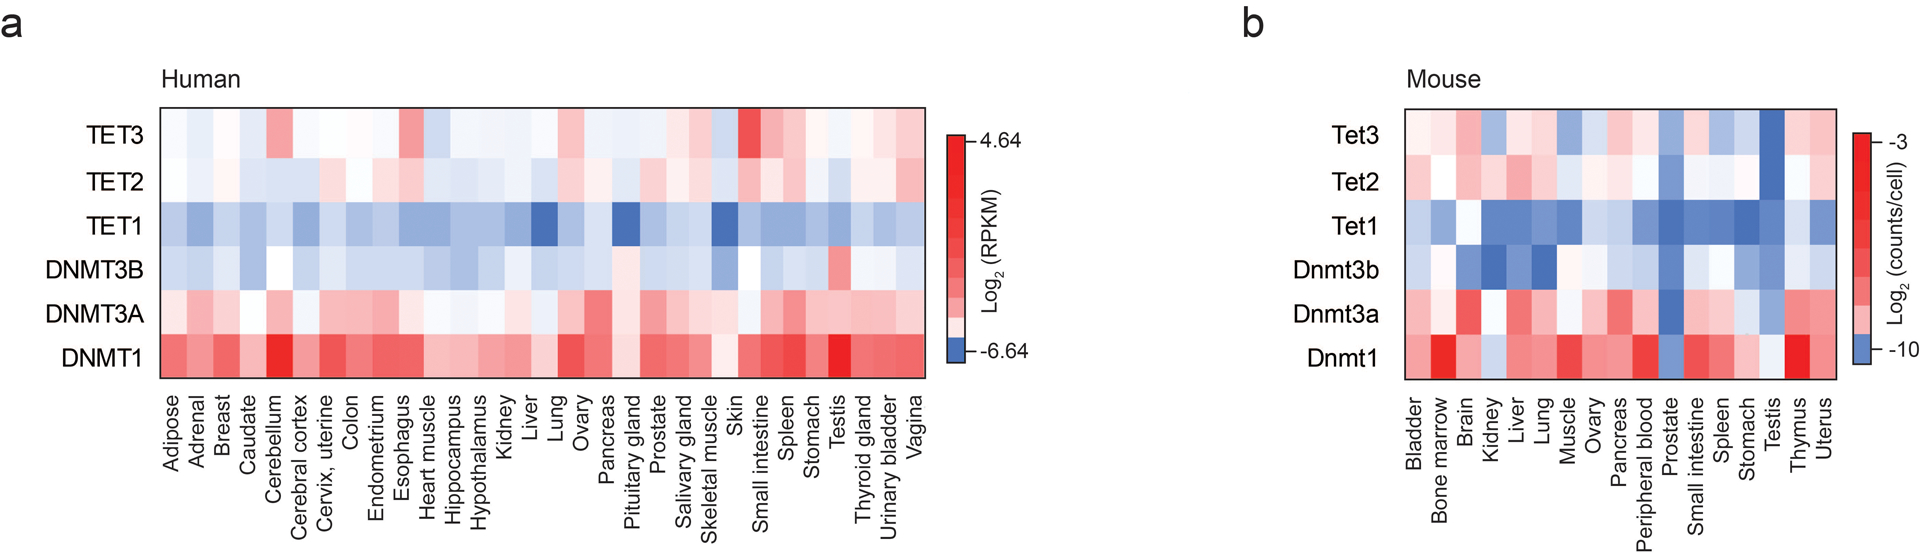
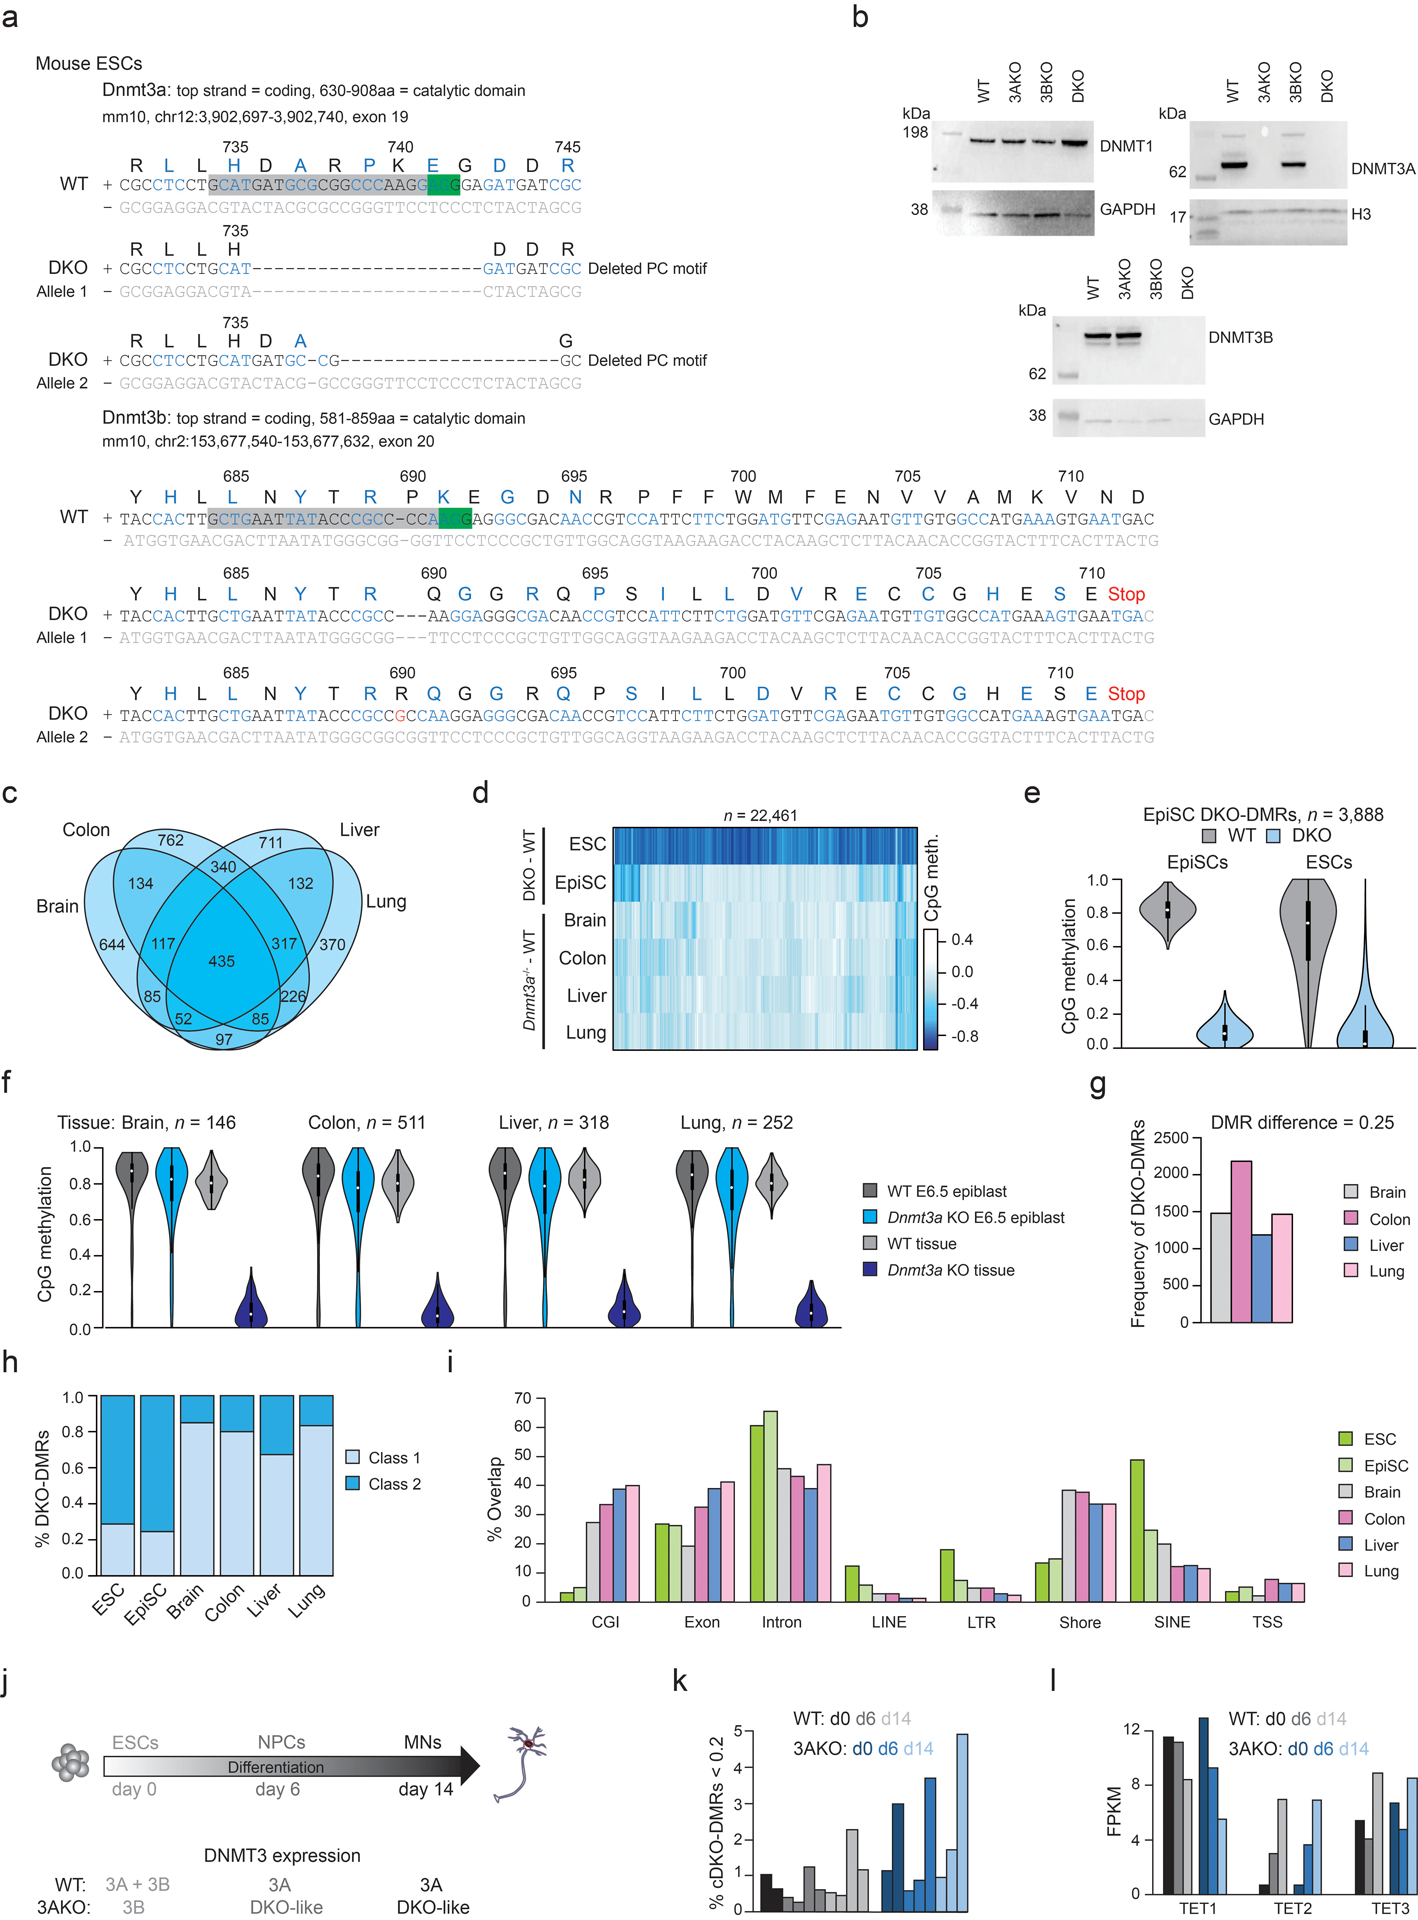
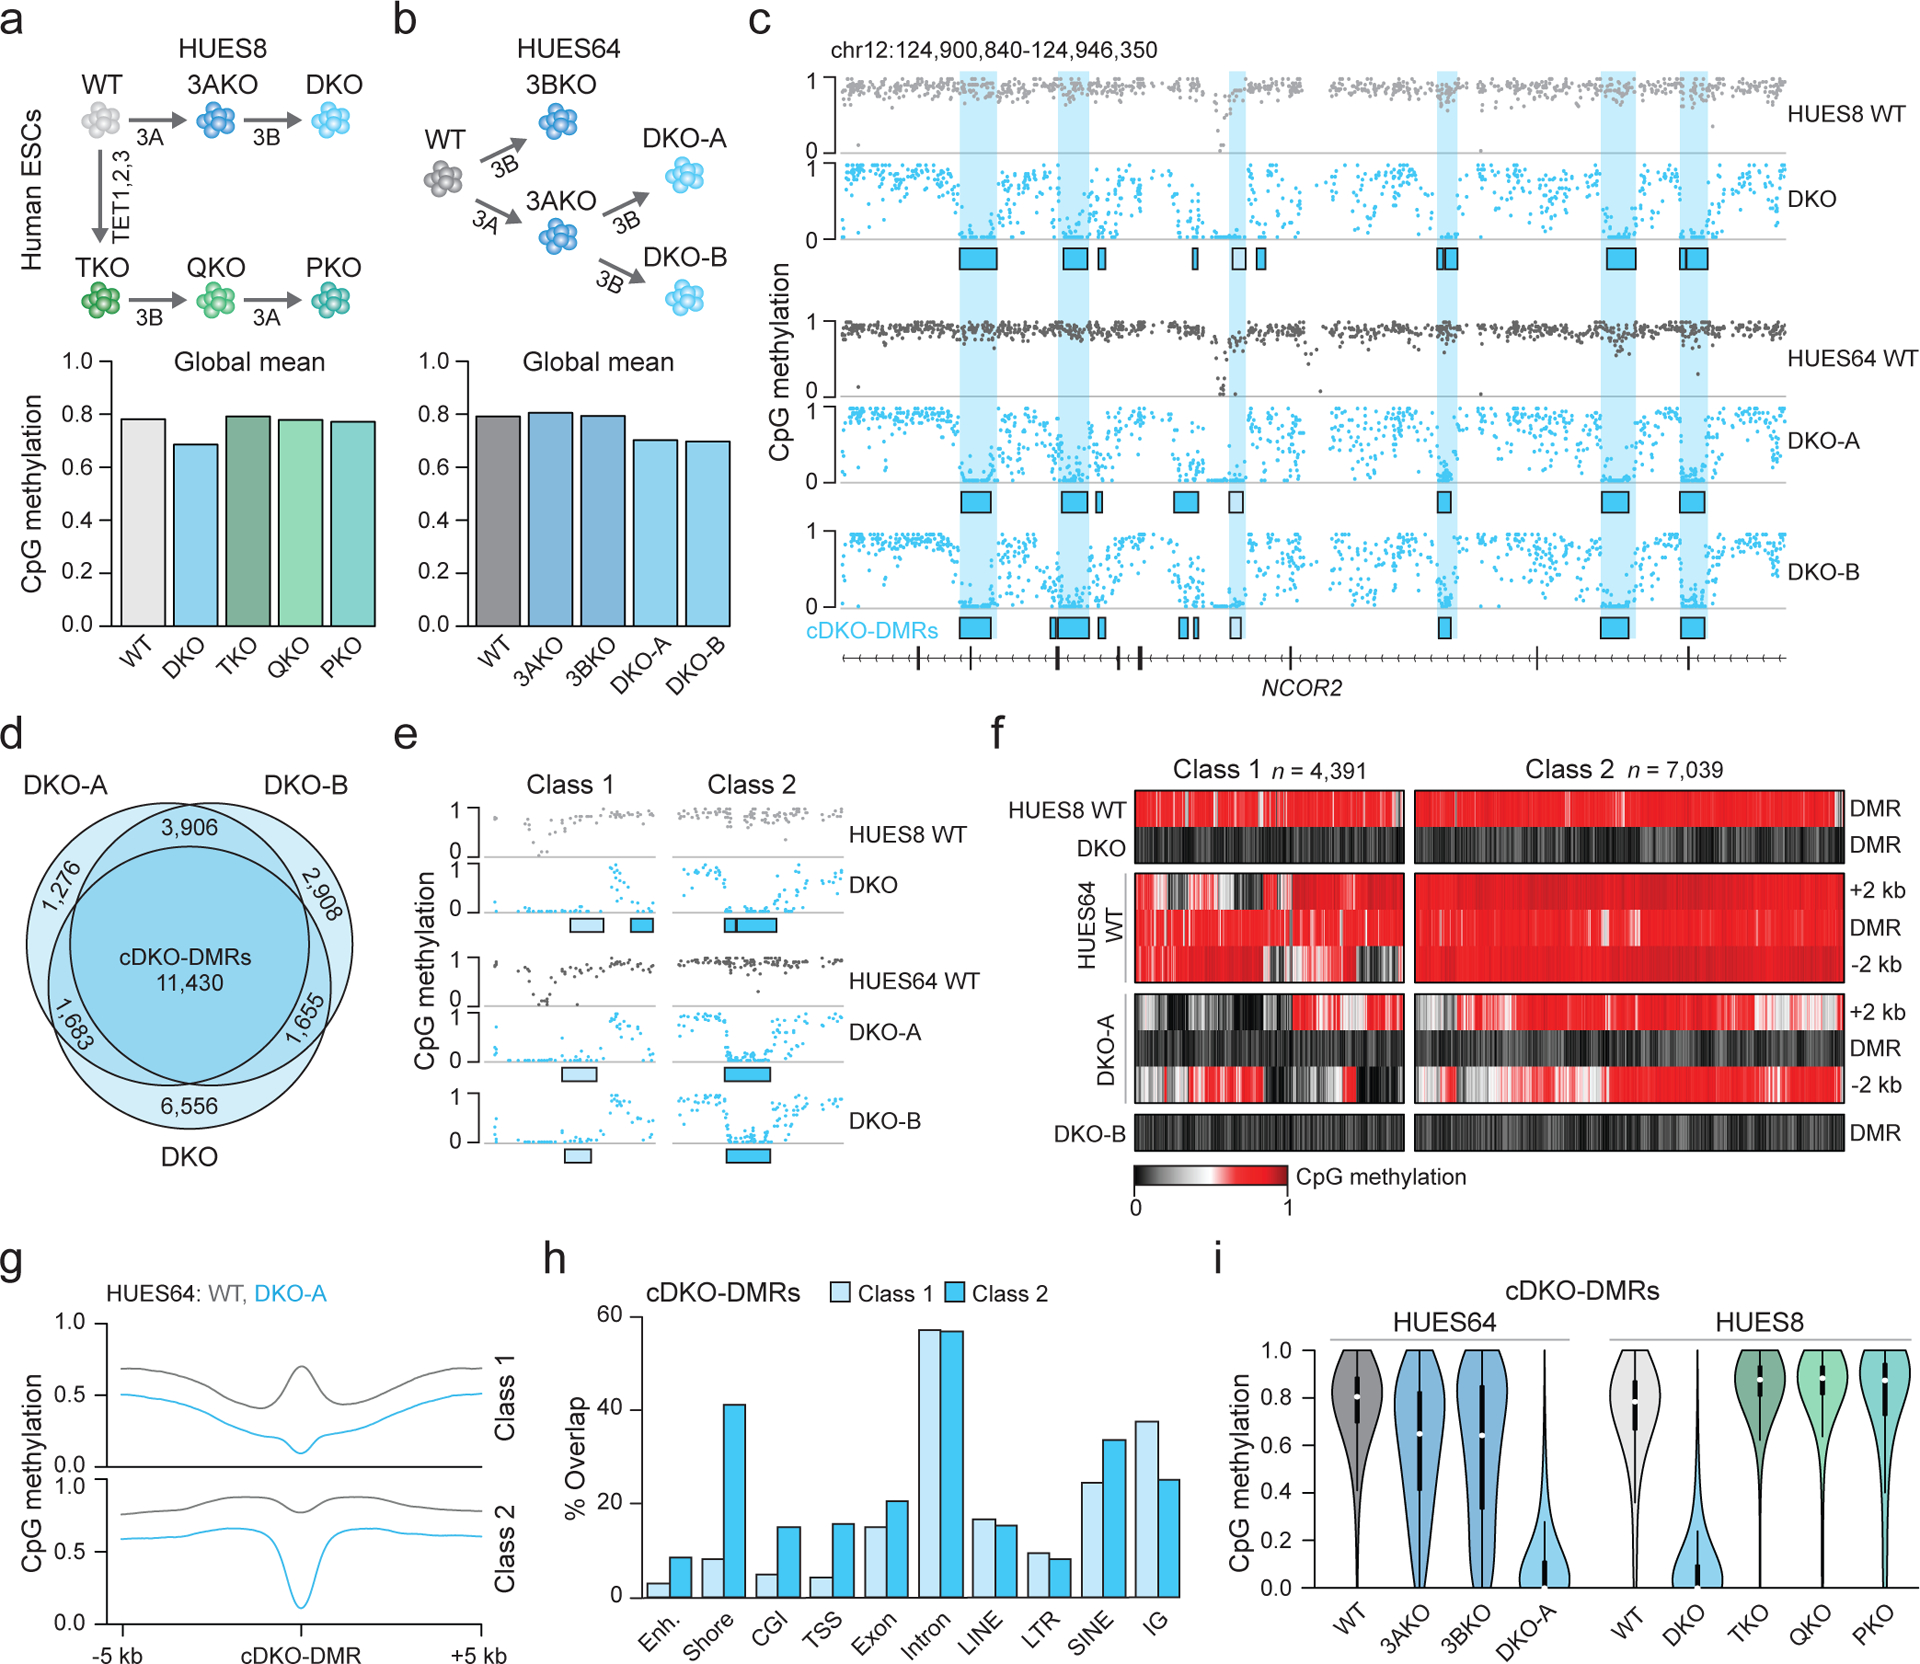
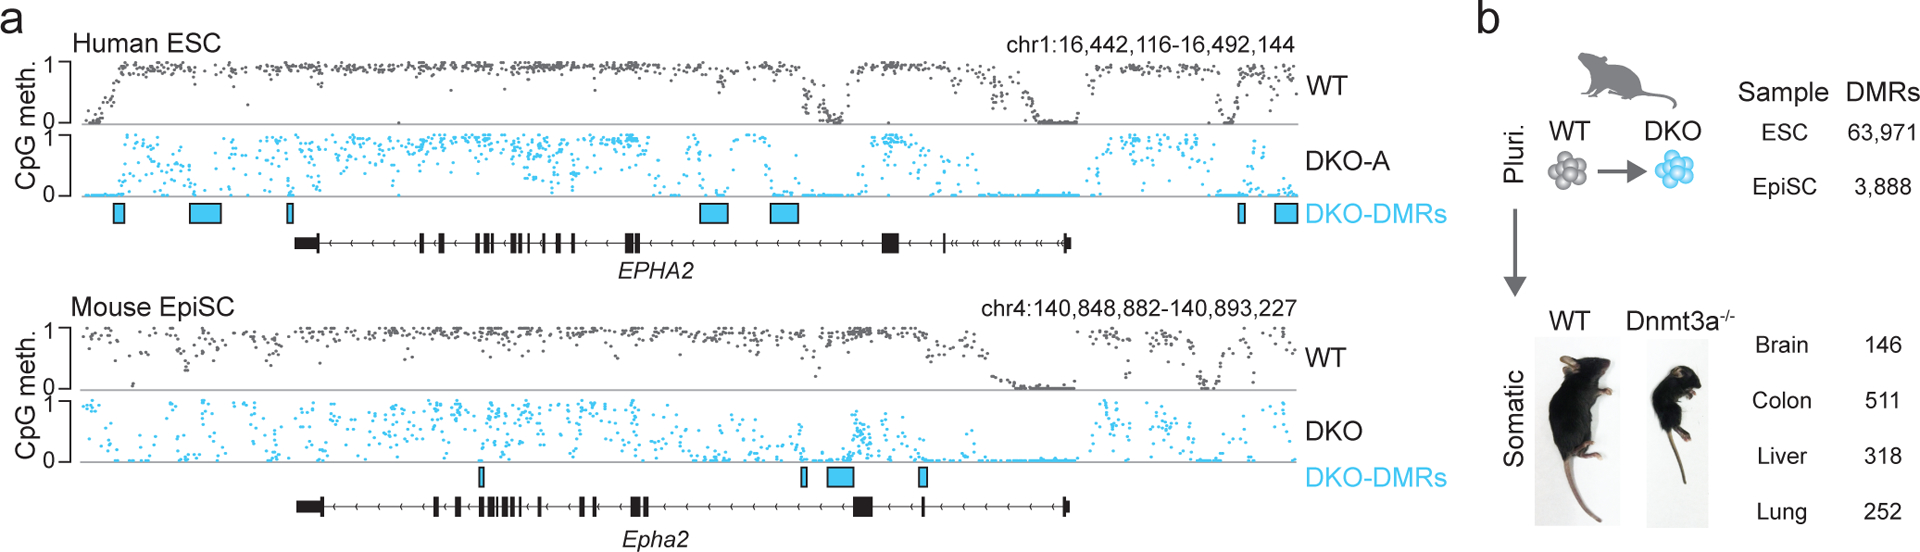
Mammalian cells stably maintain high levels of DNA methylation despite expressing both positive (DNMT3A/B) and negative (TET1-3) regulators. Here, we analyzed the independent and combined effects of these regulators on the DNA methylation landscape using a panel of knockout human embryonic stem cell (ESC) lines. The greatest impact on global methylation levels was observed in DNMT3-deficient cells, including reproducible focal demethylation at thousands of normally methylated loci. Demethylation depends on TET expression and occurs only when both DNMT3s are absent. Dynamic loci are enriched for hydroxymethylcytosine and overlap with subsets of putative somatic enhancers that are methylated in ESCs and can be activated upon differentiation. We observe similar dynamics in mouse ESCs that were less frequent in epiblast stem cells (EpiSCs) and scarce in somatic tissues, suggesting a conserved pluripotency-linked mechanism. Taken together, our data reveal tightly regulated competition between DNMT3s and TETs at thousands of somatic regulatory sequences within pluripotent cells.


Conflict of interest statement

Competing interests statement

The authors declare no competing interests.

Figures

Extended Data Fig. 1
Extended Data Fig. 1. Characterization of pentuple knockout ESCs
a) Sequencing data showing the mutations introduced into the DKO and PKO ESCs for DNMT3A. Green box = PAM sequence, grey box = sgRNA sequence. Codons are colored black or blue, grey text denotes non-coding DNA. The respective amino acid (aa) single letter name and sequence number is displayed below the DNA. b) Sequencing data for DNMT3B, as described in a. A different sgRNA was used to target DNMT3B in HUES8 ESCs compared to HUES64. c) Western blot for DNMT3A in HUES8 WT, HUES64 DKO clone A, HUES8 TKO, QKO and PKO cells. GAPDH is shown as the loading control. Full blots in Source Data Fig. 1. PKO cells were assessed for DNMT3A expression by Western blot six times with consistent results. d) HUES8 lines at 10X magnification showing that all KO cell lines appear morphologically normal. These images are representative of a full 10 cm culture dish over weeks of passaging. e) Heatmap showing RNA sequencing data as log2 TPM expression values for a set of pluripotency and self-renewal associated genes (highly expressed), as well as a subset of differentiation associated genes (low expression). DKO-A was collected at passage 6 and PKO at passage 12. f) Heatmap showing RNA sequencing data as log2 TPM expression values DNMTs and TETs, grey boxes depict genes that are knocked out in each sample. g) Comparison of global methylation levels between HUES64 and HUES8 wildtype cells where intensity of blue shading indicates density of data points. The Pearson correlation coefficient (cor.) is displayed.
Extended Data Fig. 2
Extended Data Fig. 2. Characterization of DKO-DMRs and TET rescue in PKO cells
a) Bar chart showing the proportion of CpGs with varying methylation loss in DKO cells compared to WT. CpGs that lost >60% methylation were generally located in closer proximity compared to CpGs that lost 10–20% methylation. b) The proportion of cDKO-DMRs with respective mean methylation levels in single DNMT3A−/− (3AKO) or DNMT3B−/− (3BKO) knockout ESCs. c) Composite plot showing methylation difference between passage (P) 20 and 6 in PKO cells as distance from cDKO-DMR. There is a small background loss (−0.045) with a slightly greater focal decrease (−0.07), but methylation levels stay generally high. d) The methylation level in HUES64 DKO-A, HUES64 WT and HUES8 TKO cells including the 2 kb either side is displayed. For regions where the neighboring 2 kb is hypomethylated in WT cells (class 1), almost every region shows an increase in methylation following TET loss. e) Violin plots showing methylation at TKO-DMRs across different HUES8 lines. We used stringent parameters to define TKO-DMRs that aberrantly gain methylation upon loss of TET expression (also described later in Extended Data Fig. 9a). Methylation levels were rescued by re-expression of TET. Violin plots extend from the data minima to the maxima, white dot indicates median, thick bar shows the interquartile range and thin bar shows 1.5x interquartile range. f) Methylation levels across 1 kb tiles for PKO ESCs rescued with either TET1s or TET2. Intensity of blue shading indicates density of data points. Pearson correlation coefficient (cor) is displayed. g) ChIP-seq enrichment (from Ref 21) for TET1 and DNMT3B over CpG islands (CGI), H1-specific enhancers and cDKO-DMRs. h) Representative browser tracks displaying methylation levels in WT and DKO cells as well as 5hmC levels in WT ESCs. Increased 5hmC is observed over the cDKO-DMR and at the border of the hypomethylated CGI, where TETs are known to localize.
Extended Data Fig. 3
Extended Data Fig. 3. LINE 5’UTRs are actively demethylated
a) Methylation composite plots for WT and DKO-A cells over LINE L1 elements (oriented with 5’UTR to the left). L1Hs are the youngest and L1PA4 the oldest class displayed. Methylation at the 5’UTR of younger elements appears more sensitive to DNMT3 loss. In particular, sensitivity appears associated with ZNF93 binding site loss within the 5’UTR. b) Smoothed scatter plots display the relationship between WT or DKO methylation level and CpG density within the 5’UTR, for all LINE L1 elements where intensity of blue shading indicates density of data points. Lower CpG density elements tend to retain methylation after DNMT3 loss while CpG dense 5’UTRs lose methylation. c) Histogram of read lengths generated from Nanopore sequencing for HUES64 WT cells. Top = all reads, bottom = reads < 100 kb. d) Example of CpG methylation across a group 4 L1Hs element (defined in Figure 3c) showing the focal decrease within the 5’UTR. Below, just the 5’UTR is displayed and CpGs with the most methylation loss following DNMT3 knockout are highlighted with a blue box. e) Each L1Hs 5’UTR was aligned to a consensus sequence. The CpG locations within this sequence are illustrated by vertical blue lines. Below, a summary for genetic variants at each position is shown for each group of L1Hs (defined in Figure 3c). Colored boxes display the proportion of bases that vary from the consensus sequence. For each group, nine example 5’UTR sequences are displayed, zoomed in on the six CpGs highlighted in d. Each element is represented as a grey bar with colored letters indicating variations from the consensus sequence (shown at the bottom of the panel). None of the groups exhibit a unique common variant. f) Density plots showing the distribution of 5’UTR GC content and CpG density for each group of L1Hs, from Figure 3c.
Extended Data Fig. 4
Extended Data Fig. 4. cDKO-DMRs overlap with tissue-specific enhancers
a) TET1 enrichment (from Ref 21) for LINE 5’UTRs and active H1 typical enhancers showing a greater enrichment at enhancers. b) A region within the gene NCOR2 that has many cDKO-DMRs. These lose methylation in different somatic tissues as shown below. H3K27ac and H3K4me1 tracks display ENCODE data derived from H1 ESCs. Methylation tracks are from Ref . c) The percentage of overlap with putative somatic enhancers (defined in Ref 32) for class 1 and class 2 cDKO-DMRs, an equal number of same-sized randomly selected regions, H3K4me1 peaks in ESCs (H1) and 1 kb tiles with matched CpG density to cDKO-DMRs (3.1–3.3%). d) B cell enhancers (defined in Ref 32) separated by methylation levels in WT ESCs, DKO ESCs and B cells. e) Composites showing methylation levels in passage (P) 3 and 28 DKO ESCs for P3 and P28 DKO-DMRs. f) For 86 different previously defined putative enhancer sets, the stacked bar plots display the proportion that are already hypomethylated in WT ESCs, lose methylation in DKO cells (WT – DKO difference > 0.2) or remain methylated in DKO cells. For this analysis, P28 DKO was used. g) Schematic of in vitro pancreatic islet cell differentiation (from Ref 33). h) The proportion of cDKO-DMRs or P28 DKO-DMRs that overlap with each set of cell type specific enhancers. Enhancers were previously defined. i) For regions defined as showing dynamic methylation changes during differentiation to beta islet cells, methylation levels are shown for these cell types as well as HUES64 WT and DKO-A ESCs.
Extended Data Fig. 5
Extended Data Fig. 5. Chromatin states and TF interaction at cDKO-DMRs
a) CpG density for random background regions, cDKO-DMRs and CGIs. b) For 1 kb tiles with CpG density matching cDKO-DMRs (3.1–3.3%), the mean methylation in HUES64 WT and DKO-A is shown. Methylation loss is not dependent on CpG density. c) ATAC-seq signal enrichment for cDKO-DMRs. d) Enrichment for chromatin modifications (ENCODE, H1 ESCs) as distance from cDKO-DMRs. e) A representative locus showing enrichment of H3K4me1 and 5hmC at a cDKO-DMR. P = passage. f) Methylation levels for ENCODE-defined H3K4me1 peaks (≥3 CpGs, methylation ≥0.1 in WT ESCs, n = 71,665) for WT and DKO cells at P28. Intensity of blue shading indicates density of data points. Many regions remain methylated indicating that H3K4me1 enrichment does not predict demethylation. g) For cDKO-DMRs that overlap with putative somatic enhancers, the proportion that are enriched with H3K4me1 and H3K27me3 is displayed. Overlap with both marks indicates a poised chromatin state that is more common for already hypomethylated poised enhancers. h) ChIP-seq enrichment (ENCODE, H1 ESCs) for different enhancer-associated factors at cDKO-DMRs and active ESC enhancers. i) HAND1 (GSM1505812) and GATA4 (GSM1505644) enrichment in HUES64 differentiated mesoderm (Ref 34) for cDKO-DMRs that show H3K27ac (GSM1505669) enrichment in mesoderm (i.e. enhancer-like chromatin state). j) Browser tracks displaying regions that lose methylation while gaining H3K27ac and transcription factor (HAND1) binding upon differentiation to mesoderm. The same CpGs also lose methylation in DKO ESCs. ChIP-seq data is from Ref . k) Enrichment for TF binding (ENCODE, H1 ESCs) at cDKO-DMRs, open DNA (based on HUES64 ATAC-seq) and active ESC enhancers is displayed. The most enriched factors at cDKO-DMRs (CTBP2, E2F6 and GABPA) show only low enrichment that could be confounded by the more open chromatin at cDKO-DMRs. No factor showed unique enrichment that would infer them as candidate factors for TET/DNMT recruitment. l) The percentage of cDKO-DMRs that overlap with different TF binding sites, defined by ChIP-seq peak data (Ref 34). Overlap is consistently low. m) Expression levels for differentially expressed genes between WT and DKO with examples to the right. P = passage. Each P28 DKO-DMR was assigned to its nearest gene, and those with a DKO-DMR assigned are highlighted with the blue bar. n) The distribution of absolute distance to the nearest gene for P28 DKO-DMRs. “DEG-linked” refers to DKO-DMRs that have been assigned to a differentially expressed gene by proximity. Statistics refer to a 2-sided T-test. For the box plots: median is shown in bold, box displays interquartile range, whiskers extend to 1.5x the interquartile range.
Extended Data Fig. 6
Extended Data Fig. 6. Generation of DNMT3A and 3B knockout mouse EpiSCs
a) Sequencing data showing the Dnmt3a and Dnmt3b mutations introduced into mouse DKO EpiSCs. Two different sgRNAs were used for each gene. Green box = PAM sequence, grey box = sgRNA sequence. Codons are colored black or blue, grey text denotes non-coding DNA. The respective single letter amino acid (aa) and protein sequence number is displayed above the DNA. b) Western blots showing protein levels for DNMT1, DNMT3A and DNMT3B in WT and DKO EpiSCs. PCNA is used as a loading control. Full blots in Source Data Fig. 2. Western blots were performed twice with consistent results. c) Violin plots display methylation levels for cDKO-DMRs and EpiSC DKO-DMRs in WT and DKO cells for each species. The UCSC LiftOver tool was used to map DKO-DMRs between species. Violin plots extend from the data minima to the maxima with the white dot indicating median, thick bar showing the interquartile range and thin bar showing 1.5x interquartile range. d) Schematic depicting how orthologous genes shared between human and mouse were assigned to the nearest DKO-DMR (left). Each gene was given a number (in kb) denoting the distance to the nearest DKO-DMR either up- or down-stream. Box plots for genes that were binned based in their distance to the nearest DKO-DMR in EpiSCs (shown in legend key), displaying the distance to the nearest DKO-DMR in human ESCs (right). A matched trend between distances in mouse and human cells in evident. For the box plots: the median is shown in bold, the box displays interquartile range and whiskers extend to 1.5 times the interquartile range. e) Venn diagram showing the overlap of orthologous genes that have a DKO-DMR within the gene body (i.e. 0 kb away, as shown in panel d) in mouse EpiSCs and human ESCs. This overlap was highly significant (hypergeometric test).
Extended Data Fig. 7
Extended Data Fig. 7. DNMT and TET expression in somatic tissues
a) Heat map showing Log2 RPKM for DNMTs and TETs across human somatic tissues, based on data from the human protein atlas (ebi.ac.uk) b) Heat map showing Log2 transcript counts per cell for murine somatic tissues, taken from single cell mouse atlas data.
Extended Data Fig. 8
Extended Data Fig. 8. DKO-DMRs are associated with pluripotency
a) Sequence mutations introduced into the DKO ESCs. Green box = PAM sequence, grey box = sgRNA. Codons are colored black or blue, grey text denotes non-coding DNA. Amino acid (aa) and protein sequence number are displayed above the DNA. b) Western blots for WT, DNMT3A−/− (3AKO), DNMT3B−/− (3BKO) and double knockout (DKO) mouse ESCs. GAPDH or H3 were used as loading controls. Full blots in Source Data Fig. 3. Western blots were performed three times with consistent results. c) Overlap between DKO-DMRs called in each Dnmt3a−/− tissue. d) The difference in methylation between WT and Dnmt3a−/− tissues, ESCs or EpiSCs. e) Methylation levels for EpiSC DKO-DMRs in EpiSCs and ESCs. Violin plots extend from the data minima to the maxima, white dot indicates median, thick bar shows the interquartile range and thin bar shows 1.5x interquartile range. f) Methylation levels for tissue-specific DKO-DMRs in WT and Dnmt3a−/− E6.5 epiblast and 8 day old tissues. Somatic DKO-DMRs were fully methylated in Dnmt3a−/− embryos following implantation due to DNMT3B expression hence must have lost methylation at a later stage. Violin plots extend from the data minima to the maxima, white dot indicates median, thick bar shows the interquartile range and thin bar shows 1.5x interquartile range. g) The number of DKO-DMRs identified when using a reduced stringency of 0.25 differential methylation instead of 0.6 to compensate for mixed cell types. We identified more DKO-DMRs (1,186–2,182) but still many less than in ESCs, and this may include false positives. h) The percentage of DKO-DMRs that fall into class 1 or 2 (described in Figure 1). i) The overlap of DKO-DMRs with genomic features. Categories are not exclusive. CGI = CpG island, TSS = transcription start site. j) Schematic showing the differentiation of human ESCs to motor neurons (MNs) via neuronal progenitor cells (NPCs). For WT and 3AKO ESCs expression of DNMT3A and DNMT3B is displayed across the time course. After day two, 3AKO cells are “DKO-like” as they do not express either DNMT3. k) The percentage of cDKO-DMRs with mean methylation <0.2 in each sample during differentiation. Only 1.3% and 2.4% of cDKO-DMRs lost methylation for WT and 3AKO MNs respectively. WGBS is from Ref . l) Expression of TET1–3 in WT and 3AKO ESCs during differentiation. RNA-seq is from Ref .
Extended Data Fig. 9
Extended Data Fig. 9. Identification of DMRs across human ESCs
a) Schematic illustrating how DMR calling was performed between each pair of samples. The number of DMRs that gain methylation (Incr.) in the cell type shown to the right is located above the arrow, and the number of DMRs that lose methylation (Decr.) is shown below the arrow. As we identified only few regions for other comparisons that met the same criteria as for DKO-DMRs (stringent DMRs; black) we also used less stringent criteria (Δ > 0.25) to define DMRs (blue). P = passage. b) CpG methylation of TKO-, QKO- and PKO-DMRs detected with lower stringency as defined in panel a. The n is lower than shown in panel a due to drop-out from requiring 10x coverage per region. c) Location of the DMRs shown in b. Features are not exclusive. Enh. = enhancer, CGI = CpG island, TSS = transcription start site, IG = intergenic. As expected and previously reported in Ref , the majority of DMRs that occur in the absence of TETs were CGI promoters or shores of developmental genes that may be more susceptible to hypermethylation due to lack of transcriptional activity. d) Low stringency TKO-DMRs are grouped by their methylation status in QKO and PKO cells. Of the TKO-DMRs, 23% lost the aberrantly gained methylation upon KO of DNMT3B (in QKO), 21% only upon further loss of DNMT3A (PKO) and 56% remained highly methylated despite loss of both DNMT3s pointing to the importance of TET activity in keeping these loci demethylated. e) The difference in methylation over passaging across each genomic feature. f) The location of DMRs identified between PKO at P6 and P20. Categories are not exclusive. g) CpG methylation levels for a representative early-replicating region, where methylation in DKO cells decreases the most, (left) and a representative late-replicating region, where PKO cells show the strongest methylation loss (right).
Extended Data Fig. 10
Extended Data Fig. 10. Broad TET activity results in genome-wide 5hmC enrichment and methylation heterogeneity
a) Mean 5hmC level in HUES64 differentiated motor neurons (MN) over gene bodies grouped into categories according to their expression status, d = day. The median is shown in bold, the box displays interquartile range and whiskers extend to 1.5x the interquartile range. b) The difference (d60 – d16) in 5hmC vs. methylation for MNs at different genomic features. CGI = CpG island, TSS = transcription start site, IG = intergenic. c) Transcript expression for genes involved in TET-mediated demethylation and base excision repair pathways. d) For genomic features, the difference in methylation between ESCs is displayed. e) Cell counts for HUES8 WT and TKO cells over 5d culture. Center points show the mean and error bars display the standard deviation for three independent cell culture replicates. f) Schematic showing how stochastic turnover of cytosine modification can lead to intercellular heterogeneity. mC = methylcytosine (black circle), 5hmC = hydroxymethylcytosine (grey circle), C = unmethylated cytosine (white circle). g) Representative browser tracks showing the methylation status for CpGs detected using hairpin bisulfite sequencing (BS; top) and WGBS (bottom). Each CpG covered by hairpin-BS is colored according to dyad methylation state. h) Proportion of CpG dyads that were methylated, unmethylated or hemi-methylated in arrested HUES64 WT or PKO ESCs. i) For regions enriched with different chromatin marks (ENCODE, H1 ESCs), the proportion of CpG dyads with each methylation status is displayed. j) The percentage of CpG dyads that were hemi-methylated according to location within each genomic feature. TE = active typical enhancer. k) Single cell RRBS data showing the percentage of unmethylated CpGs per cell. The violin plot extends from the data minima to the maxima where each dot is a single cell. Of CpGs that are normally methylated in bulk WGBS (≥ 0.9), we observed that 6.6% ±3.37 showed zero methylation in individual cells. These may have been targeted by TETs and are likely an underestimate as 5hmCs cannot be detected with our RRBS based approach. l) The proportion of CpGs with zero, intermediate (not exactly zero or one) or one methylation status for arrested WT ESCs. In bulk populations, ESC arrest removes replication-associated heterogeneity and causes most CpGs to become fully methylated. However, 25% remain intermediate. The density plot shows methylation loss for each category of CpGs with intermediate CpGs showing the greatest loss suggesting they may be more frequently targeted by TETs hence TET activity may contribute to intermediate methylation levels in bulk populations.
Figure 1:
Figure 1:. Focal demethylation by TET enzymes in the absence of DNMT3s
a) Schematic overview. Knockouts are shown under each arrow. 3A = DNMT3A, 3B = DNMT3B. Barplot shows the global mean methylation for each sample using matched CpGs (n = 6,708,067) generated by WGBS. DKO and PKO ESCs were passaged six times. b) Schematic as in a. Barplot shows the global mean methylation for each sample (CpGs match panel a). DKO-A and DKO-B denote clone A and B (passage 3), respectively. 3AKO and 3BKO are from published datasets. c) Genome browser tracks displaying WT and DKO methylation levels, sample-specific DKO-DMRs (boxes) and shared cDKO-DMRs (shaded vertical bars). d) The overlap between DKO-DMRs hypomethylated in each sample. e) Genome browser track of selected DKO-DMRs shown in panel c. Class 1 (light shading) border already hypomethylated regions and class 2 (dark shading) are flanked by highly methylated DNA. f) Heatmap of cDKO-DMRs including 2 kb on either side, separated by class. g) Methylation composite plot of class 1 and class 2 cDKO-DMRs with 5 kb on either side. h) The percentage of cDKO-DMRs that overlap with the shown genomic features. Categories are not exclusive. CGI = CpG island, TSS = transcription start site and IG = intergenic. Enhancers are defined from H1 ESCs. i) Violin plots for CpGs located within cDKO-DMRs (n = 214,732, 180,019, 138,424, 215,263, 203,504, 182,322, 202,028, 212,215, 145,869 CpGs respectively). Violin plots extend from the data minima to the maxima with the white dot indicating median, thick bar showing the interquartile range and thin bar showing 1.5× interquartile range.
Figure 2:
Figure 2:. Re-expression of TET enzymes demethylated PKO cDKO-DMRs
a) TET1s, TET2 and TET3 were reintroduced into PKO cells using PiggyBac transposition. Control transfection was performed with only the transposase (PBase). A schematic diagram depicts the experimental design with the constructs shown below, w = weeks, Ins = insulator sequence. b) WGBS-based mean methylation barplots for matched CpGs. P20 = passage 20. c) Genome browser tracks across a 39-kb region of the LRP1 locus for HUES8 WT and seven of the modified HUES8 lines. Re-expression of TET1s, TET2 or TET3 in PKO cells causes global and specific loss of methylation at cDKO-DMRs (blue boxes). d) Violin plots displaying methylation levels for CpGs within cDKO-DMRs (n = 176,669, 186,438, 155,912, 180,233, 128,709 CpGs respectively). Violin plots extend from the data minima to the data maxima with the white dot indicating median, thick bar showing the interquartile range and thin bar showing 1.5× interquartile range. e) Composite plot of mean methylation levels for each class of cDKO-DMR, including 5 kb on either side for PKO cells at P20, control cells as well as the three TET rescue lines. f) Hydroxymethylcytosine (5hmC) levels in WT HUES64 cells shown as distance from class 1 or class 2 cDKO-DMR center, CGIs or active ESC (H1) enhancers (enh).
Figure 3:
Figure 3:. TETs demethylate LINEs and somatic enhancers following DNMT3 loss
a) The proportion of class 1 or class 2 cDKO-DMRs that overlap with selected features. b) Genome browser tracks showing cDKO-DMR overlap within the 5’UTR of a human LINE (L1PA3) element. Fr = frontal. DKO-A is shown at passage 3 here and for all panels. c) Heatmap displays methylation levels for L1Hs 5’UTRs as measured by Oxford Nanopore sequencing separated into groups by the methylation state. Loess-smoothed regression for methylation levels across full length L1Hs elements in each group are shown on the right, with the 5’UTR shaded in grey. d) Genome browser tracks show extension of hypomethylation at an unmethylated active ESC enhancer following DNMT3 loss. e) Heatmap of active ESC enhancer methylation levels, in HUES64 WT and DKO-A cells, including 5 kb on either side. f) Genome browser tracks showing cDKO-DMR overlap with putative tissue-specific enhancers in the frontal lobe. g) Binary heatmap of cDKO-DMR overlap with tissue-specific enhancers. Each row represents the enhancer set of a different tissue or cell type. Rows for H1 ESCs, frontal lobe and CD19+ B-cells are highlighted. Dark shading indicates overlap with a cDKO-DMR. Hierarchical clustering of rows and columns was performed using the complete linkage method. h) Frontal lobe enhancers separated by their methylation status in WT, DKO-A and the frontal lobe. i) Composite plots of H3K4me1 and H3K27ac enrichment across cDKO-DMRs in comparison to active ESC (H1) enhancers.
Figure 4:
Figure 4:. Targeted demethylation in the absence of DNMT3 appears conserved in mice
a) Genome browser tracks for an orthologous locus in human ESCs and mouse EpiSCs show the conserved presence of DKO-DMRs following DNMT3 double knockout. b) A comparison of DKO-DMRs identified in mouse DKO ESCs, DKO EpiSCs and a range of DKO-like Dnmt3a knockout mouse tissues. The number of DMRs derives from one experiment per condition. Homozygous Dnmt3a knockout mice (−/−) were generated by crossing Dnmt3a heterozygous mice (+/−). A representative photo of a WT and knockout mouse at day 23 is shown to highlight the expected runted phenotype in line with prior studies. To the right, the number of DMRs identified for each cell type or each tissue is shown. Pluri. = Pluripotent.
Figure 5:
Figure 5:. TET enzymes also have widespread global activity
a) Mean methylation for matched CpGs (n = 7,905,649) in DKO and PKO ESCs. Background CpGs represent CpGs outside of defined enhancers or cDKO-DMRs. b) Methylation difference over passaging for DKO and PKO cells (left and center) and WT hydroxymethylcytosine (5hmC) levels (right). CpGs are separated according to replication timing taken from previous repli-BS-seq data: S1 is early replicating and enriched for euchromatin, while S6 is late replicating and enriched for heterochromatin. c) 5hmC levels in WT cells across different genomic features, CGI = CpG island, IG = intergenic. d) Genome browser tracks of representative high and low 5hmC enrichment in WT cells. Genomic regions with higher 5hmC in WT lose more methylation in DKO cells. e) For 1-kb tiles with different mean 5hmC levels, the difference in methylation between WT and DKO, TKO and WT or PKO and DKO cells is displayed. Boxes display the interquartile range while the bold line shows the median and whiskers extend to 1.5× the interquartile range. f) Human ESCs were differentiated into motor neurons (MNs) and cultured for 60 days (d). WGBS and oxBS were performed at d16 and d60 and the respective methylation and 5hmC levels across different genomic features are displayed. TSS = transcription start site. g) Genome browser tracks display methylation and 5hmC levels for MNs at d16 and d60. An increase in 5hmC is observed over the transcribed FOXP1 gene body, but also within the nearby intergenic region.

References

    1. Jadhav U et al. Extensive Recovery of Embryonic Enhancer and Gene Memory Stored in Hypomethylated Enhancer DNA. Molecular cell 74, 542–554.e545, doi:10.1016/j.molcel.2019.02.024 (2019). - DOI - PMC - PubMed
    1. Zhou W et al. DNA methylation loss in late-replicating domains is linked to mitotic cell division. Nature genetics 50, 591–602, doi:10.1038/s41588-018-0073-4 (2018). - DOI - PMC - PubMed
    1. Jin Z & Liu Y DNA methylation in human diseases. Genes & diseases 5, 1–8, doi:10.1016/j.gendis.2018.01.002 (2018). - DOI - PMC - PubMed
    1. Klutstein M, Nejman D, Greenfield R & Cedar H DNA Methylation in Cancer and Aging. Cancer research 76, 3446–3450, doi:10.1158/0008-5472.can-15-3278 (2016). - DOI - PubMed
    1. Gangisetty O, Cabrera MA & Murugan S Impact of epigenetics in aging and age related neurodegenerative diseases. Frontiers in bioscience (Landmark edition) 23, 1445–1464 (2018). - PubMed

Publication types

MeSH terms

Substances