

Reconstruction of the human blood-brain barrier in vitro reveals a pathogenic mechanism of APOE4 in pericytes
- PMID: 32514169
- PMCID: PMC7704032
- DOI: 10.1038/s41591-020-0886-4
Reconstruction of the human blood-brain barrier in vitro reveals a pathogenic mechanism of APOE4 in pericytes
Erratum in
-
Author Correction: Reconstruction of the human blood-brain barrier in vitro reveals a pathogenic mechanism of APOE4 in pericytes.Nat Med. 2021 Feb;27(2):356. doi: 10.1038/s41591-021-01250-8. Nat Med. 2021. PMID: 33514950 No abstract available.
Abstract
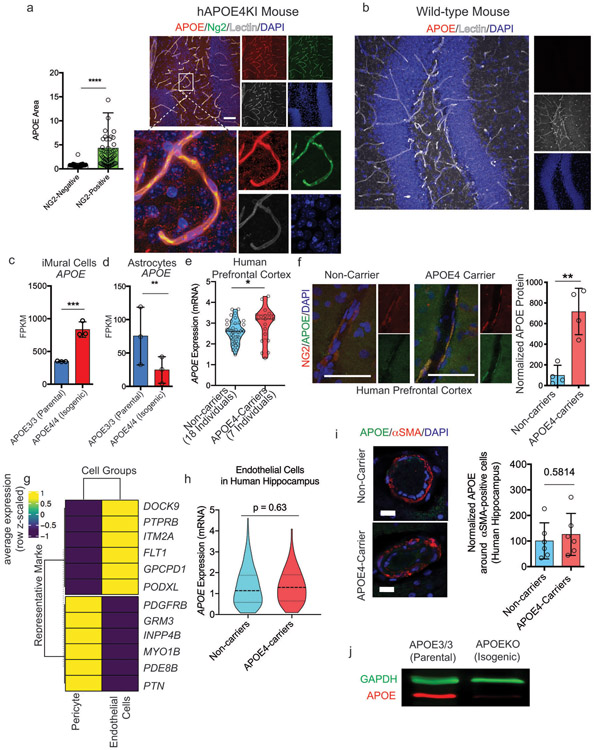
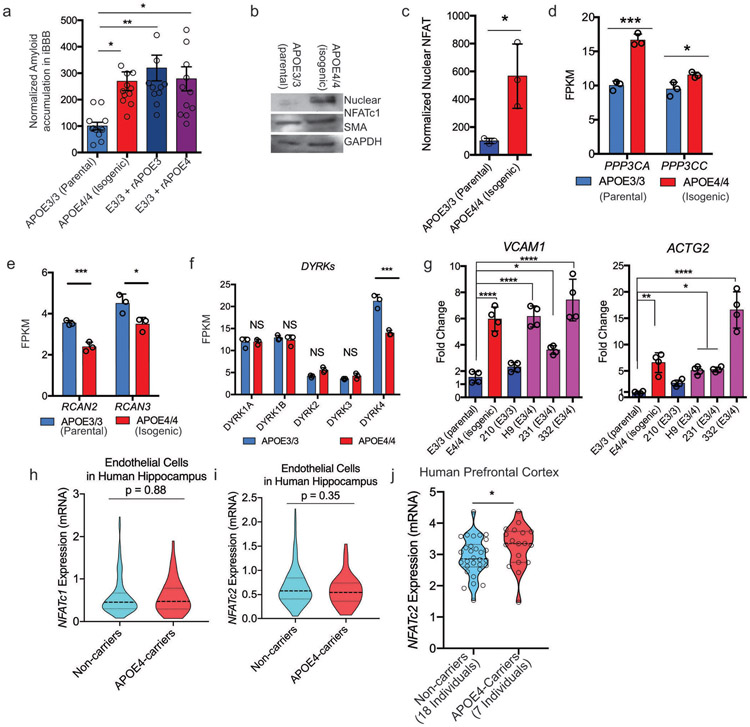
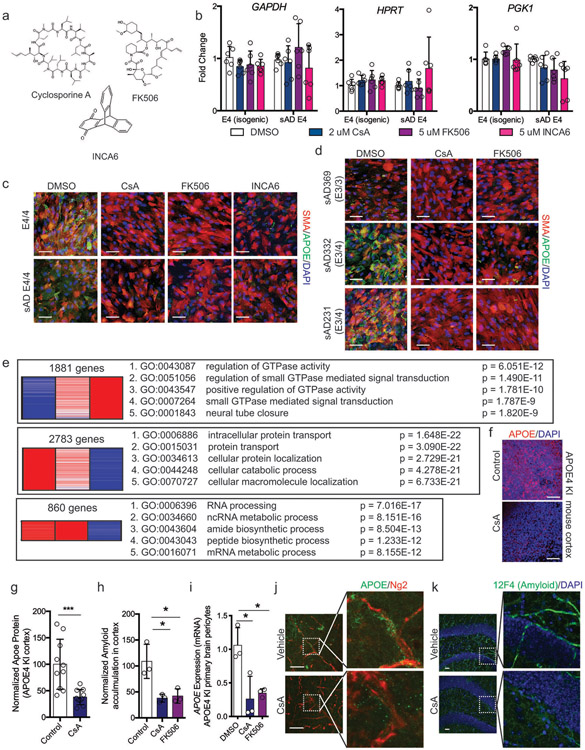
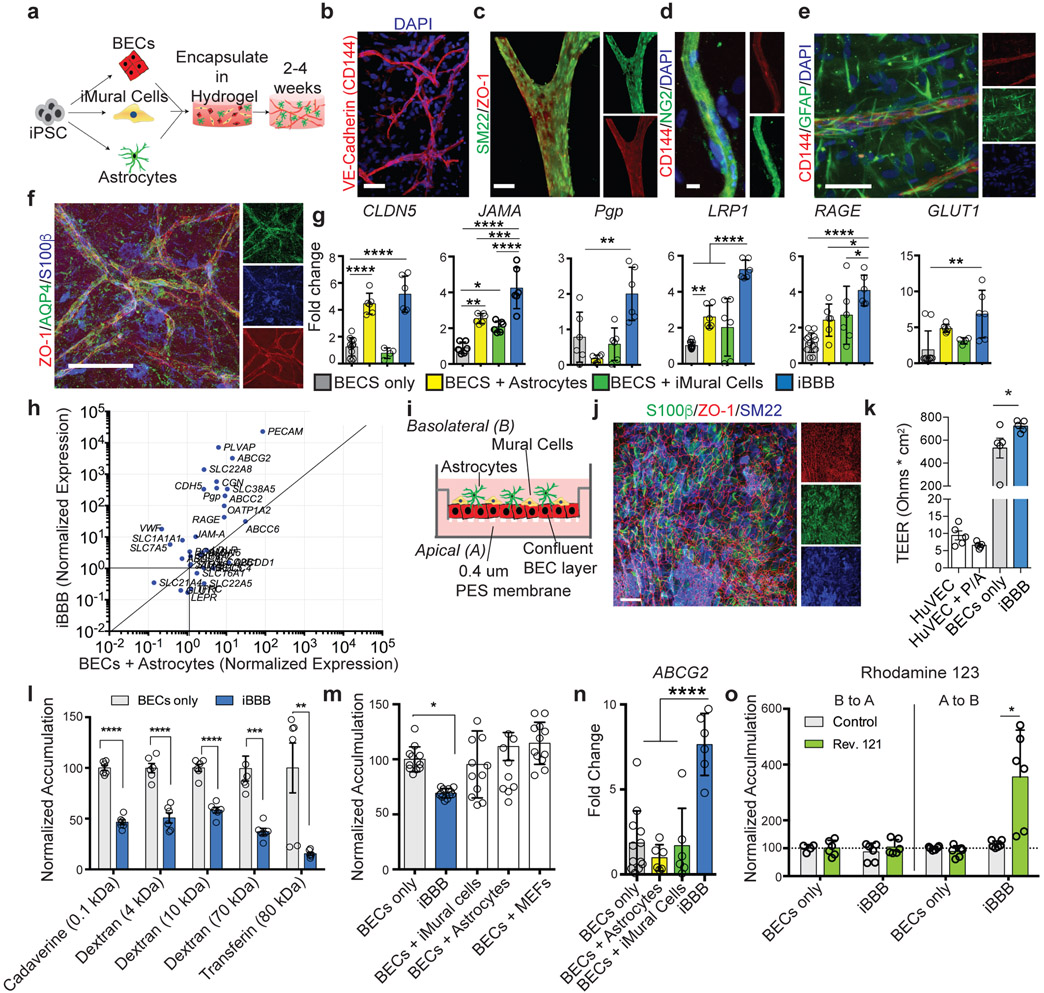
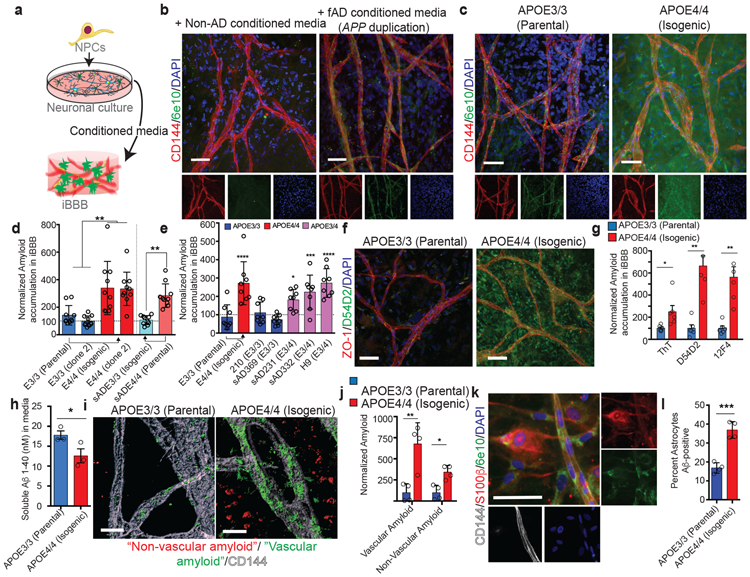
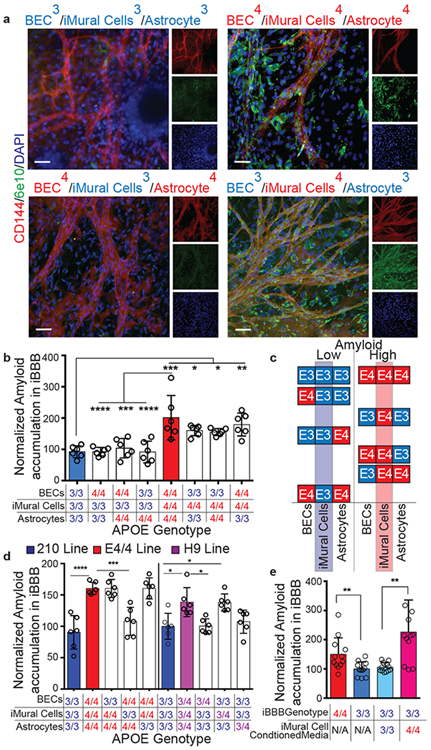
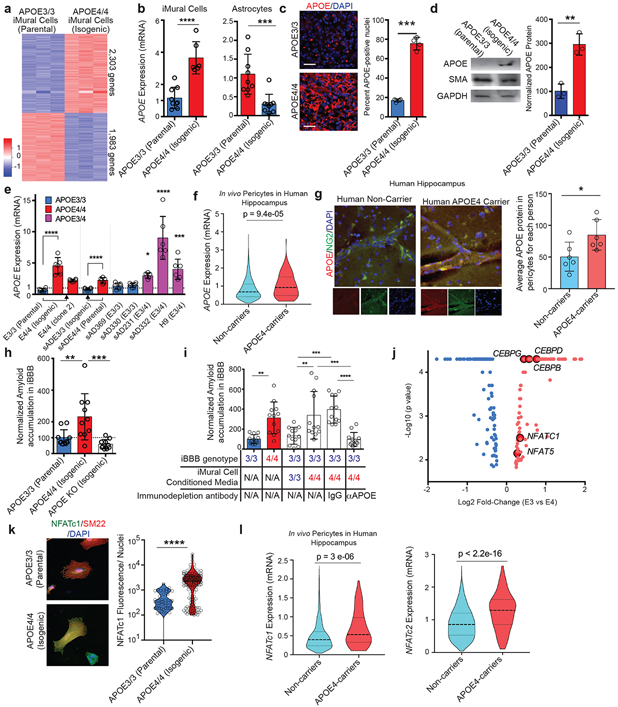
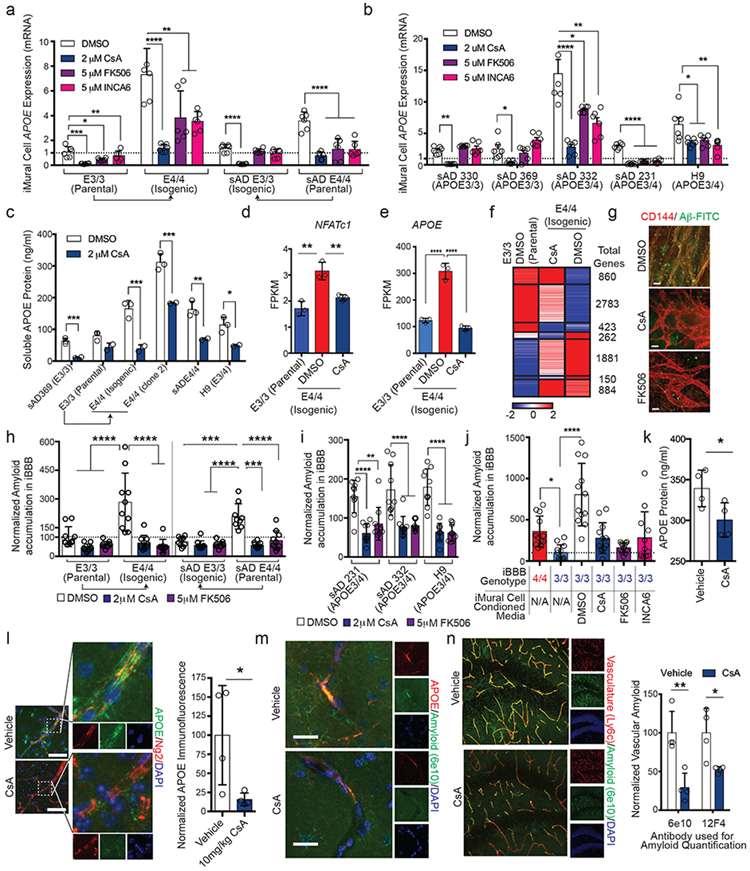
In Alzheimer's disease, amyloid deposits along the brain vasculature lead to a condition known as cerebral amyloid angiopathy (CAA), which impairs blood-brain barrier (BBB) function and accelerates cognitive degeneration. Apolipoprotein (APOE4) is the strongest risk factor for CAA, yet the mechanisms underlying this genetic susceptibility are unknown. Here we developed an induced pluripotent stem cell-based three-dimensional model that recapitulates anatomical and physiological properties of the human BBB in vitro. Similarly to CAA, our in vitro BBB displayed significantly more amyloid accumulation in APOE4 compared to APOE3. Combinatorial experiments revealed that dysregulation of calcineurin-nuclear factor of activated T cells (NFAT) signaling and APOE in pericyte-like mural cells induces APOE4-associated CAA pathology. In the human brain, APOE and NFAT are selectively dysregulated in pericytes of APOE4 carriers, and inhibition of calcineurin-NFAT signaling reduces APOE4-associated CAA pathology in vitro and in vivo. Our study reveals the role of pericytes in APOE4-mediated CAA and highlights calcineurin-NFAT signaling as a therapeutic target in CAA and Alzheimer's disease.
Figures
References
Publication types
MeSH terms
Substances
Grants and funding
LinkOut - more resources
Full Text Sources
Other Literature Sources
Molecular Biology Databases
Miscellaneous
