. 2020 Jul;26(7):1070-1076.
doi: 10.1038/s41591-020-0944-y. Epub 2020 Jun 8.

A single-cell atlas of the peripheral immune response in patients with severe COVID-19

Affiliations

A single-cell atlas of the peripheral immune response in patients with severe COVID-19

Aaron J Wilk et al. Nat Med. 2020 Jul.

Abstract

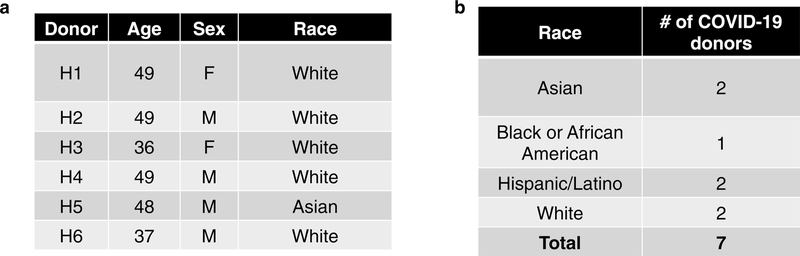
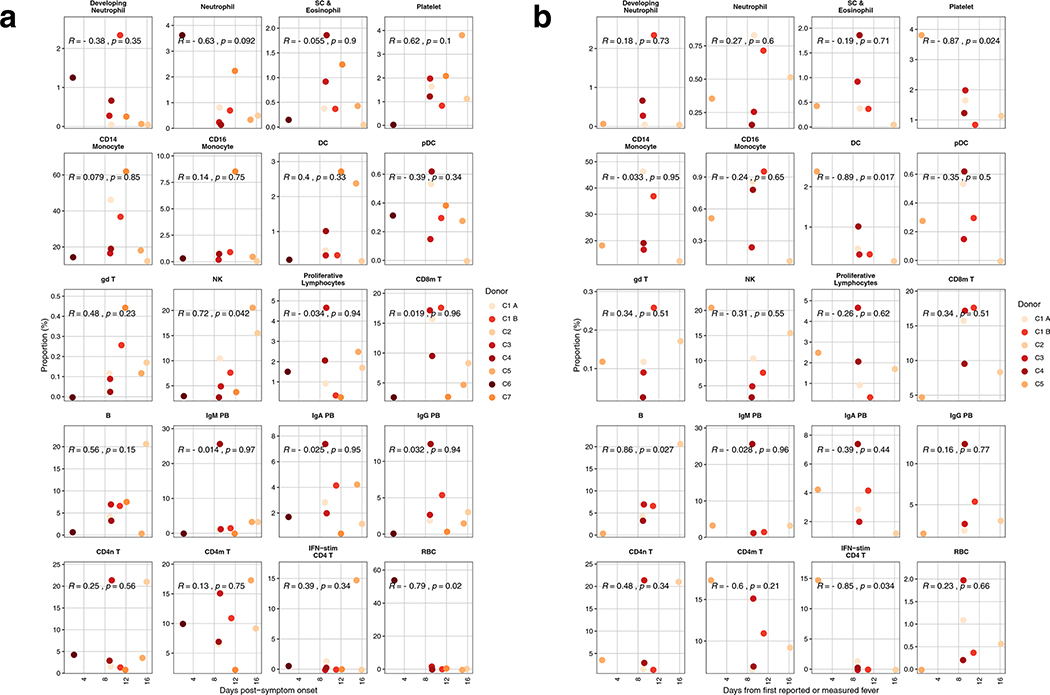
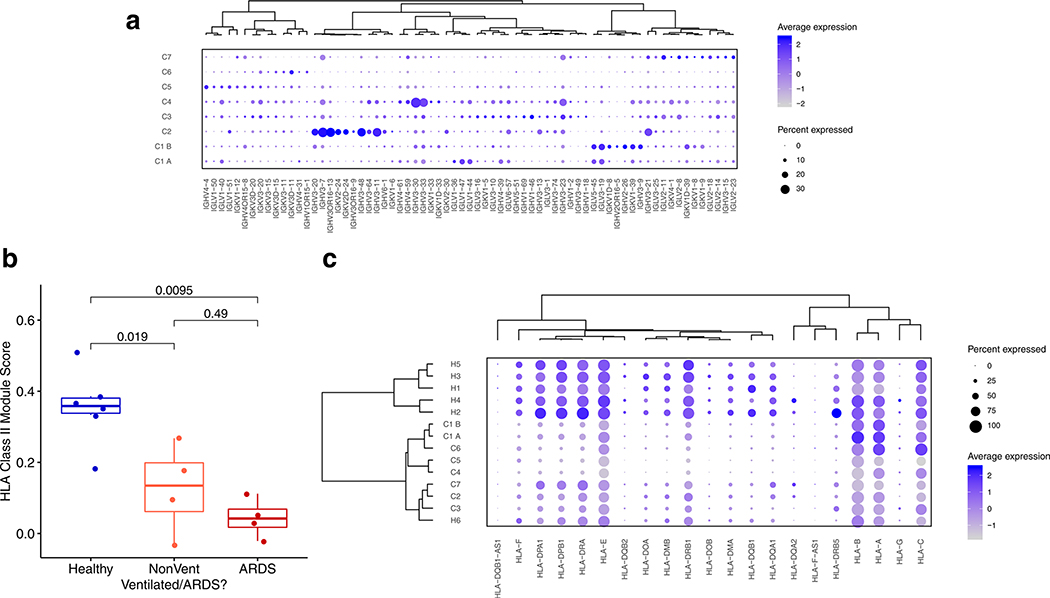
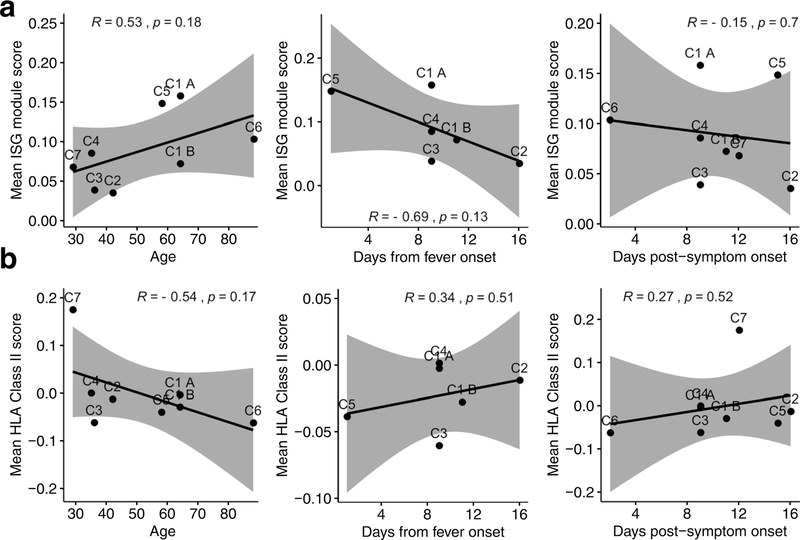
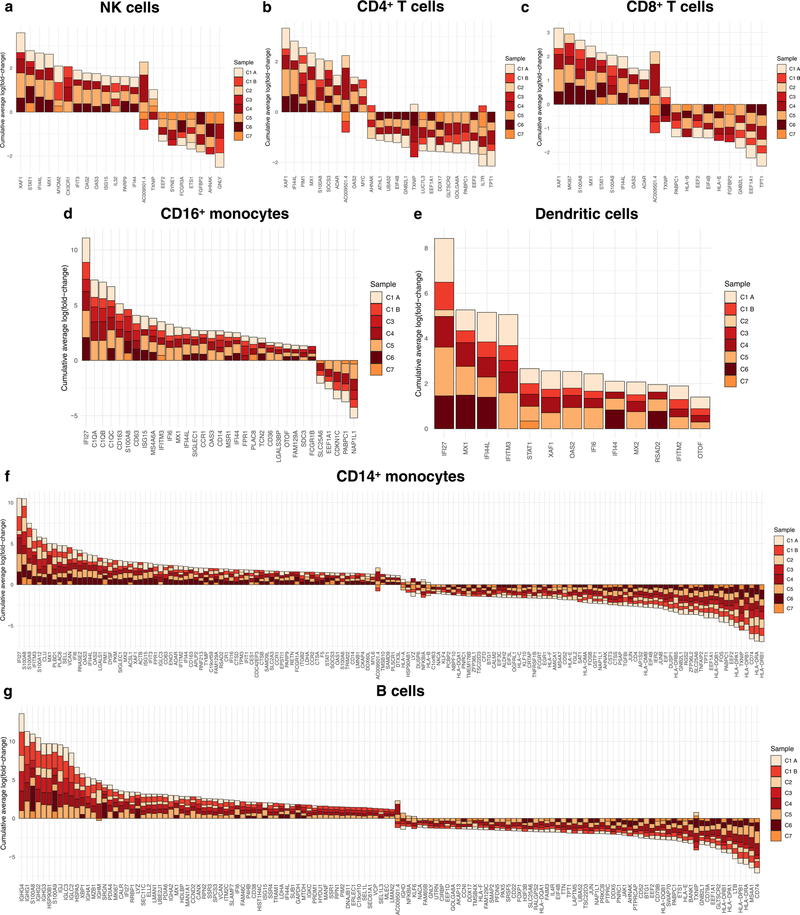
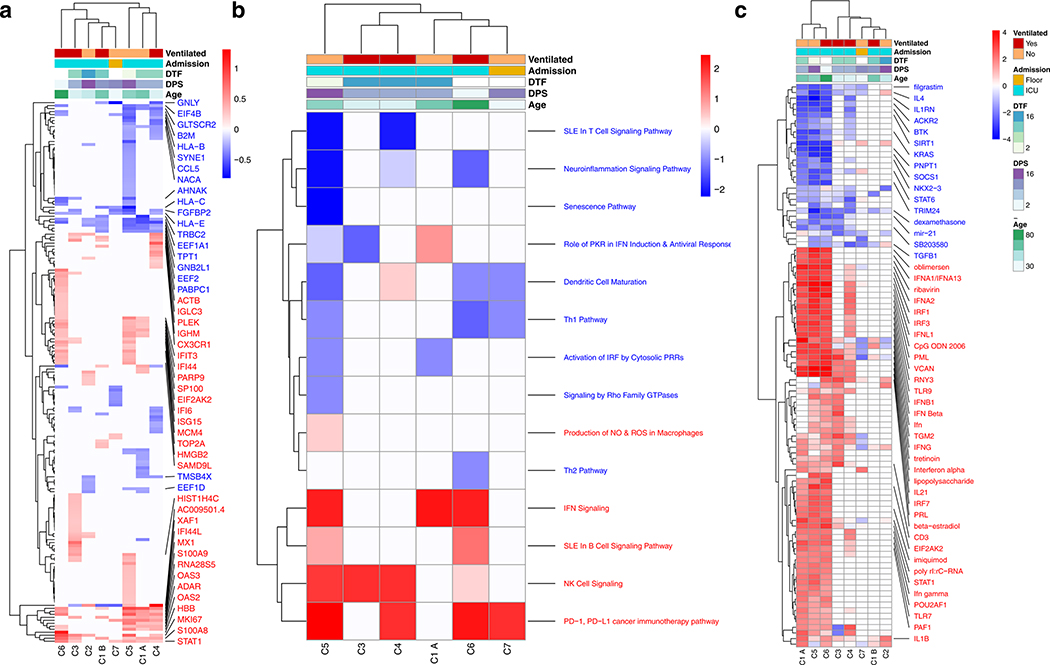
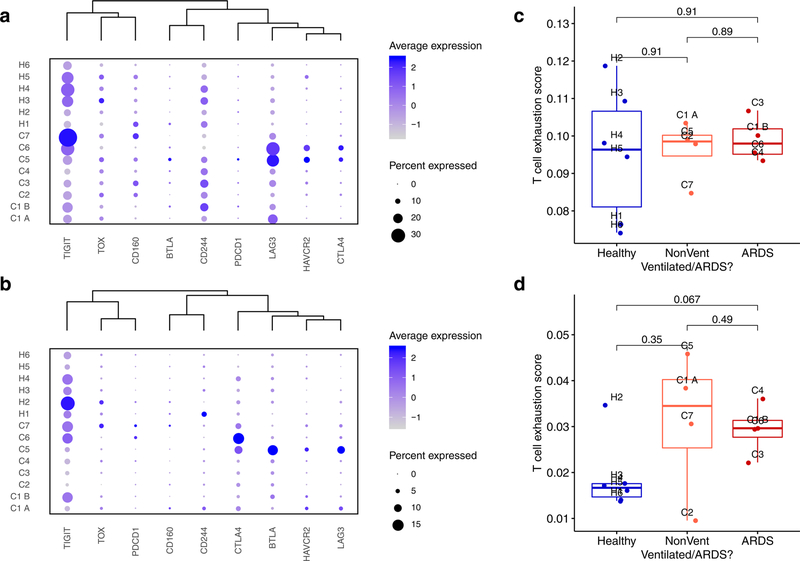
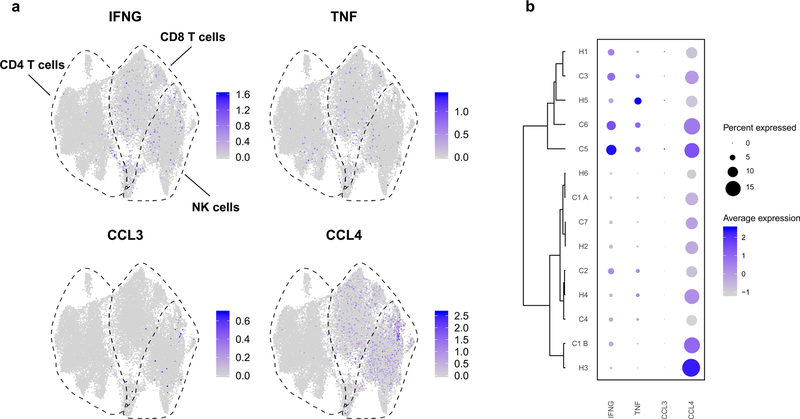
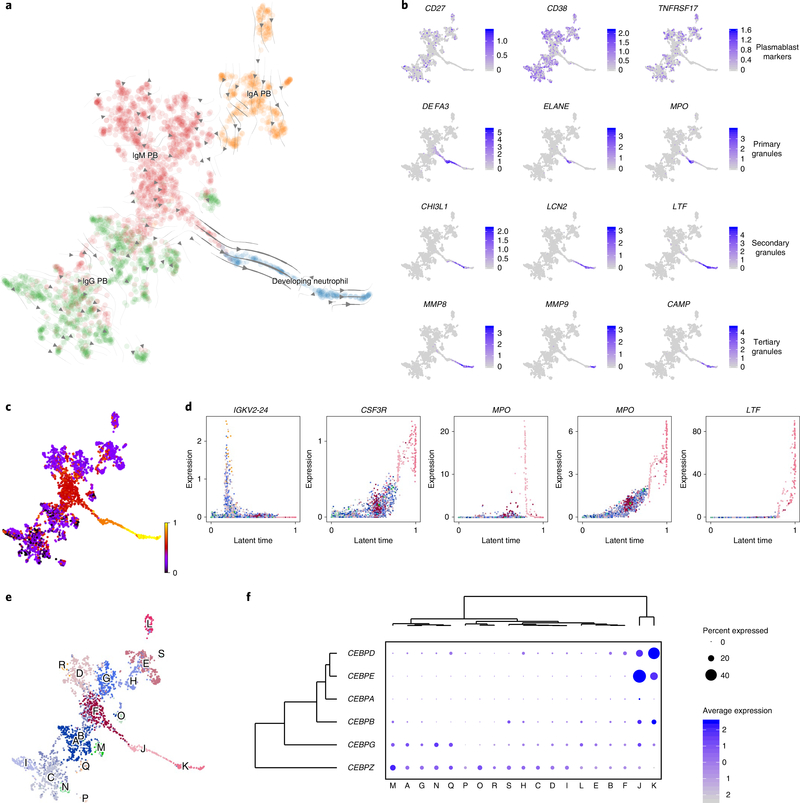
There is an urgent need to better understand the pathophysiology of Coronavirus disease 2019 (COVID-19), the global pandemic caused by SARS-CoV-2, which has infected more than three million people worldwide1. Approximately 20% of patients with COVID-19 develop severe disease and 5% of patients require intensive care2. Severe disease has been associated with changes in peripheral immune activity, including increased levels of pro-inflammatory cytokines3,4 that may be produced by a subset of inflammatory monocytes5,6, lymphopenia7,8 and T cell exhaustion9,10. To elucidate pathways in peripheral immune cells that might lead to immunopathology or protective immunity in severe COVID-19, we applied single-cell RNA sequencing (scRNA-seq) to profile peripheral blood mononuclear cells (PBMCs) from seven patients hospitalized for COVID-19, four of whom had acute respiratory distress syndrome, and six healthy controls. We identify reconfiguration of peripheral immune cell phenotype in COVID-19, including a heterogeneous interferon-stimulated gene signature, HLA class II downregulation and a developing neutrophil population that appears closely related to plasmablasts appearing in patients with acute respiratory failure requiring mechanical ventilation. Importantly, we found that peripheral monocytes and lymphocytes do not express substantial amounts of pro-inflammatory cytokines. Collectively, we provide a cell atlas of the peripheral immune response to severe COVID-19.


Conflict of interest statement

Competing interests

The authors declare no competing interests.

Figures

Extended Data Fig. 1 |
Extended Data Fig. 1 |. Demographic characteristics of all analyzed donors.
a, Age, sex, and race of n = 6 profiled healthy donors. b, Races represented by n = 7 patients with COVID-19 in this study.
Extended Data Fig. 2 |
Extended Data Fig. 2 |. Proportions of PBMC cell subsets do not correlate with days post-symptom onset or days to fever onset.
Proportions of each cell type in each sample colored by donor of origin. The x-axis corresponds to a, the days post-symptom onset (n = 8 COVID-19 samples) or b, the days from first reported or measured fever (n = 6 COVID-19 samples from patients who had experienced fever). Shown are the Pearson correlation coefficient and exact two-sided p-values for each scatter plot.
Extended Data Fig. 3 |
Extended Data Fig. 3 |. Heterogeneity of Ig V gene usage and HLA class II downregulation in B cells of COVID-19 patients.
a, Dot plot depicting average and percent expression of all detected Ig genes by n = 8 COVID-19 samples. Number of cells: C1 A – 182, C1 B – 618, C2 – 123, C3 – 351, C4 – 1,577, C5 – 196, C6 – 32, C7 – 29. b, Boxplot depicting the mean HLA class II expression score for all B cells of each sample in the dataset, colored by ventilation/ARDS status (healthy controls are colored in blue, n = 6; non-ventilated COVID-19 patients in orange, n = 4; ventilated COVID-19 patients in red, n = 4). Shown are exact two-sided p values by the Wilcoxon rank-sum test. Boxplot features correspond to: minimum whisker = 25th percentile - 1.5 * inter-quartile range (IQR) or the lowest value within; minimum box = 25th percentile; center = median; maximum box = 75th percentile; maximum whisker = 75th percentile + 1.5 * IQR or greatest value within. c, Dot plot showing percent and average expression of all detected HLA genes by B cells for n = 8 COVID-19 samples and n = 6 healthy controls. Number of cells: C1 A – 351, C1 B – 1,020, C2 – 495, C3 – 883, C4 – 1,835, C5 – 246, C6 – 77, C7 – 298, H1 – 190, H2 – 299, H3 – 298, H4 – 588, H5 – 511, H6 – 200.
Extended Data Fig. 4 |
Extended Data Fig. 4 |. Trends between ISG or HLA class II expression scores and clinical parameters in total PBMCs.
a, b, Scatter plots depicting the correlation between (a) the mean ISG expression score or (b) the mean HLA class II expression score and patient age, days from fever onset, or days post-symptom onset (Supplementary Table 25). For all plots, only n = 8 COVID-19 patient samples are included. For plots depicting correlations with days from fever onset, n = 6 as the two COVID-19 patients who never reported fever (C6 and C7) are excluded. Pearson correlation coefficients, exact two-sided p-values, and the 95% confidence interval are shown for each comparison.
Extended Data Fig. 5 |
Extended Data Fig. 5 |. Consensus of DE genes in each major cell type.
Each bar plot represents genes differentially expressed in at least half (4) of n = 8 COVID-19 samples relative to all healthy controls. DE genes were considered those with an average |log(fold-change)| > ± 0.25 and a two-sided p value < 0.05 as determined by Seurat’s implementation of the Wilcoxon rank-sum test. Each bar represents the cumulative log(fold-change) of each DE gene, colored by the contributions of individual COVID-19 samples. DE genes are shown for a, NK cells, b, CD4+ T cells, c, CD8+ T cells, d, CD16+ monocytes, e, Dendritic cells, f, CD14+ monocytes, and g, B cells. There were no DE genes in at least four COVID-19 samples for γδ T cells. Total number of cells per donor: C1 A – 3,222, C1 B – 4,889, C2 – 1,695, C3 – 6,206, C4 – 3,559, C5 – 2,391, C6 – 794, C7 – 3,145; cells from all healthy controls (n = 16,231 cells) were used to generate comparisons with each COVID-19 sample.
Extended Data Fig. 6 |
Extended Data Fig. 6 |. Differentially regulated genes, canonical pathways, and upstream regulators in CD8+ T cells.
a, Heatmap of DE genes for each COVID-19 sample colored by average log(fold-change). DE genes were calculated by comparing gene expression of individual COVID-19 samples with gene expression of all healthy controls using Seurat’s implementation of the Wilcoxon rank-sum test. Only DE genes with a two-sided p value<0.05 adjusted for multiple comparisons by Bonferroni’s correction are shown. These DE genes were used to identify b, enriched canonical pathways and c, upstream regulators, both colored by z-score, using Ingenuity Pathway Analysis (IPA). The (a) 50 genes, (b) 14 pathways, or (c) 50 regulators with the highest absolute average log(fold-change) or z-score across all donors are labeled. Genes with a net positive average log(fold-change) or z-score are labeled in red; genes with a net negative average log(fold-change) or z-score are labeled in blue. All (b) pathways and (c) upstream regulators are statistically significant by IPA’s implementation of Fisher’s exact test at a right-sided p < 0.05. Number of cells: C1 A – 563, C1 B – 904, C2 – 176, C3 – 1,437, C4 – 432, C5 – 183, C6 – 80, C7 – 102; cells from all healthy controls (n = 2,885 cells) were used to generate comparisons with each COVID-19 sample.
Extended Data Fig. 7 |
Extended Data Fig. 7 |. CD8+ and CD4+ T cells from COVID-19 patients do not consistently express higher levels of exhaustion markers.
a, b, Dot plot depicting the percent and average expression of canonical genes associated with T cell exhaustion by (a) CD8+ and (b) CD4+ T cells from n = 8 COVID-19 samples and n = 6 healthy controls. c-d, Boxplot showing the mean T cell exhaustion of module score (see Supplementary Table 25) of CD8+ T cells (c) or CD4+ T cells (d) from each sample, colored by healthy donors (n = 6, blue), non-ventilated COVID-19 patients (n = 4, orange), or ventilated COVID-19 patients (n = 4, red). Shown are exact two-sided p values by Wilcoxon rank-sum test. Boxplot features correspond to: minimum whisker = 25th percentile - 1.5 * inter-quartile range (IQR) or the lowest value within; minimum box = 25th percentile; center = median; maximum box = 75th percentile; maximum whisker = 75th percentile + 1.5 * IQR or greatest value within.
Extended Data Fig. 8 |
Extended Data Fig. 8 |. Expression of pro-inflammatory cytokines is not a feature of circulating cytotoxic lymphocytes in COVID-19.
a, UMAP embedding of CD4+ T, CD8+ T, and NK cells colored by expression of canonical pro-inflammatory cytokines IFNG, TNF, CCL3, and CCL4. n = 22,016 cells are plotted from n = 14 biologically independent samples. Dotted lines correspond to the cell type boundaries identified in Fig. 3b. b, Dot plot depicting average and percent expression of canonical cytotoxic lymphocyte pro-inflammatory cytokines by CD8+ T cells from n = 8 COVID-19 samples and n = 6 healthy controls.
Extended Data Fig. 9 |
Extended Data Fig. 9 |. Developing neutrophils likely do not represent multiplets.
Complexity, defined as the number of genes detected per cell divided by the number of UMIs in that cell, for each cell in the dataset grouped by annotated cell type. Complexity of all n = 44,721 cells from n = 8 COVID-19 samples and n = 6 healthy controls is depicted. Each violin plot is trimmed at the maximum and minimum value for each cell type.
Extended Data Fig. 10 |
Extended Data Fig. 10 |. The spectrum of plasmablast-to-granulocyte phenotype is present in patients experiencing ARDS and this putative transdifferentiation is likely unrelated to transcriptional dynamics of canonical neutrophils.
a, UMAP embedding of plasmablasts and activated granulocytes faceted by COVID-19 sample. n = 3,187 cells are plotted from n = 14 biologically independent samples. b-c, UMAP embeddings of plasmablasts, activated granulocytes, and canonical neutrophils overlaid with RNA velocity stream (b) or velocity grid (c). n = 3,911 cells are plotted from n = 14 biologically independent samples.
Fig. 1 |
Fig. 1 |. Expansion of plasmablasts and depletion of multiple innate immune cell subsets in the periphery of patients with COVID-19.
a, Demographics, sample characteristics and disease course of patients with COVID-19. b, UMAP dimensionality reduction embedding of peripheral blood mononuclear cells (PBMCs) from all profiled samples (n = 44,721 cells) colored by donor of origin. IDs of patients with COVID-19 (n = 7) begin with ‘C’ and are colored in shades of orange (patients who were not ventilated at the time of draw) or red (patients with ARDS who were ventilated at the time of draw) and those of healthy donors begin with ‘H’ (n = 6) and are colored in blues. c, UMAP embedding of the entire dataset colored by orthogonally generated clusters labeled by manual cell type annotation. d, Proportions of each cell type in each sample colored by donor of origin. The x axes correspond to the ventilation or ARDS status of each patient. Shown are exact two-sided P values by the Wilcoxon rank-sum test. n = 6, n = 4 and n = 4 biologically independent samples for Healthy, NonVent and ARDS, respectively. Boxplot features: minimum whisker, 25th percentile − 1.5 × inter-quartile range (IQR) or the lowest value within; minimum box, 25th percentile; center, median; maximum box, 75th percentile; maximum whisker, 75th percentile + 1.5 × IQR or greatest value within.
Fig. 2 |
Fig. 2 |. Robust HLA class II downregulation and type I interferon-driven inflammatory signatures in monocytes are characteristics of SARS-CoV-2 infection.
a, UMAP embedding of all monocytes colored by sample of origin. n = 10,339 cells are plotted from n = 14 biologically independent samples. b, UMAP embedding of monocytes colored by CD14 and FCGR3A (encoding CD16a, to distinguish between CD14+ and CD16+ monocytes), HLA-DPB1 and HLA-DMA (illustrating HLA class II downregulation in patients with COVID-19) and S100A9 and IFI27 (demonstrating canonical inflammatory signatures in patients with COVID-19). c, UMAP embedding of monocytes colored by genes encoding pro-inflammatory cytokines previously reported to be produced by circulating monocytes in severe COVID-19, namely TNF, IL6, IL1B, CCL3, CCL4 and CXCL2. d,g,h, Heatmaps of DE genes (d), differentially regulated canonical pathways (g) and differentially regulated predicted upstream regulators (h) between CD14+ monocytes of each COVID-19 sample compared to CD14+ monocytes of all healthy controls. The heatmap in d is colored by average log(fold-change), while heatmaps in g and h are colored by z-score. All displayed genes, pathways and regulators are statistically significant at the P < 0.05 confidence level by Seurat’s implementation of the Wilcoxon rank-sum test (two-sided, adjusted for multiple comparisons using Bonferroni’s correction, in d) or Ingenuity Pathway Analysis (IPA) implementation of the Fisher exact test (right-tailed, in g and h). The 50 genes (d), 25 pathways (g) or 50 regulators (h) with the highest absolute average log(fold-change) or z-score across all donors are labeled. Genes with a net positive average log(fold-change) or z-score are labeled in red; genes with a net negative average log(fold-change) or z-score are labeled in blue. DPS, days post-symptom onset; DTF, days from first reported or measured fever. e, Boxplot showing the mean HLA class II module score of CD14+ monocytes from each sample, colored by healthy donors (blue), non-ventilated patients with COVID-19 (orange) or ventilated patients with COVID-19 (red). Shown are exact P values by two-sided Wilcoxon rank-sum test. n = 6, n = 4 and n = 4 biologically independent samples for Healthy, NonVent and ARDS, respectively. f, Dot plot depicting percent expression and average expression of all detected HLA genes in CD14+ monocytes by donor. i, Boxplot showing the IFNA module score of each cell, colored by healthy donors (blue), non-ventilated patients with COVID-19 (orange) or ventilated patients with COVID-19 (red). j, Scatter plots depicting the correlation between the mean ISG module score of CD14+ monocytes in each sample and the patient age (top) and time–distance from first measured or reported fever (bottom). Shown are Pearson’s r, exact two-sided P values and the 95% confidence interval. n = 8 (top) and n = 6 (bottom) independent biological samples. Number of cells for d,fi: C1 A, 1,561; C1 B, 1,858; C2, 217; C3, 1,102; C4, 713; C5, 462; C6, 277; C7, 2,095; H1, 680; H2, 325; H3, 215; H4, 166; H5, 444; H6, 224. For d,gh, cells from all healthy controls (n = 2,054 cells) are used to generate comparisons with each COVID-19 sample. For e,i, boxplot features: minimum whisker, 25th percentile − 1.5 × IQR or the lowest value within; minimum box, 25th percentile; center, median; maximum box, 75th percentile; maximum whisker, 75th percentile + 1.5 × IQR or greatest value within.
Fig. 3 |
Fig. 3 |. Heterogeneous patterns of NK cell exhaustion and IFN response in COVID-19.
a, UMAP embedding of CD4+ T cells, CD8+ T cells and NK cells colored by sample of origin. b, UMAP embedding colored by lineage genes (CD3D, CD3G, CD4, CD8A, FCGR3A and NCAM1) and selected functional/phenotypic markers (GZMB and MKI67). For a,b, n = 22,016 cells are plotted from n = 14 biologically independent samples. c, Boxplots depicting proportions of CD56dim NK cells, CD56bright NK cells and proliferating lymphocytes among total T and NK cells by sample of origin. The cells used to calculate each proportion are highlighted in bold black in the adjacent UMAP embeddings and were identified by manually labeling clusters generated by clustering CD4+ T cells, CD8+ T cells and NK cells alone. Shown are exact two-sided P values from the Wilcoxon rank-sum test. n = 386 (top), n = 4,899 (middle), n = 781 (bottom) total from n = 6, n = 4 and n = 4 biologically independent samples for Healthy, NonVent and ARDS, respectively. d, Boxplot showing the mean expression score by only NK cells of three canonical markers of NK cell exhaustion: LAG3, PDCD1 (encoding PD-1) and HAVCR2 (encoding TIM-3). Shown are exact two-sided P values by Wilcoxon rank-sum test. e, Boxplot showing the mean expression score by only NK cells of four canonical NK cell cytokine genes (CCL3, CCL4, IFNG and TNF). Shown are exact P values by Wilcoxon rank-sum test. For d,e, n = 6, n = 4 and n = 4 biologically independent samples for Healthy, NonVent and ARDS, respectively. In ce, boxplot features: minimum whisker, 25th percentile − 1.5 × IQR or the lowest value within; minimum box, 25th percentile; center, median; maximum box, 75th percentile; maximum whisker, 75th percentile + 1.5 × IQR or greatest value within. f,g, Heatmaps of DE genes (f) and differentially regulated predicted upstream regulators (g) between NK cells of each COVID-19 sample compared to NK cells of all healthy controls. As in Fig. 2, f is colored by average log(fold-change), while g is colored by z-score. All displayed genes and regulators are statistically significant at the P < 0.05 confidence level by Seurat’s implementation of the Wilcoxon rank-sum test (two-sided, adjusted for multiple comparisons using Bonferroni’s correction, f) or IPA’s implementation of Fisher exact test (right-tailed, g). The 50 genes or regulators with the highest absolute average log(fold-change) or z-score across all donors are labeled. Genes with a net positive average log(fold-change) or z-score are labeled in red; genes with a net negative average log(fold-change) or z-score are labeled in blue. DPS, days post-symptom onset; DTF, days from first reported or measured fever. Number of cells for f,g: C1 A, 354; C1 B, 387; C2, 271; C3, 328; C4, 104; C5, 518; C6, 58; C7, 130; cells from all healthy controls (n = 4,707 cells) were used to generate comparisons with each COVID-19 sample. h,i, Heatmaps of differentially upregulated ISGs (h; Supplementary Table 25) and cytokines (i; Supplementary Table 25) in donors with COVID-19, colored by the number of COVID-19 samples in which the gene was differentially expressed relative to all healthy controls. DE genes used to construct these heatmaps are provided in Supplementary Tables 4–10. An ISG or cytokine was counted as differentially expressed if it had an average log(fold-change) > 0.25 and an adjusted two-sided P value < 0.05 by Seurat’s implementation of the Wilcoxon rank-sum test. n = 8 biologically independent COVID-19 samples compared to n = 6 biologically independent healthy controls.
Fig. 4 |
Fig. 4 |. Developing neutrophils are characteristic of patients with severe COVID-19 and may differentiate from plasmablasts.
a, UMAP embedding of plasmablasts and developing neutrophils, colored by annotated cell type and overlaid with the RNA velocity stream. b, UMAP embedding colored by canonical plasmablast marker genes (CD27, CD38 and TNFRSF17) and genes encoding primary (DEF3A, ELANE and MPO), secondary (CHI3DL1, LCN2 and LTF) and tertiary (MMP8, MMP9 and CAMP) neutrophil granule proteins,,. c, UMAP embedding colored by inferred latent time. d, Scatter plots showing expression of a selection of cluster-defining genes across inferred latent time. e, UMAP embedding colored by orthogonally generated clusters. f, Dot plot depicting expression of CEBP family members in each identified cluster. For all panels, n = 3,187 cells from n = 8 biologically independent COVID-19 samples and n = 6 biologically independent healthy controls.

Update of

References

    1. Dong E, Du H & Gardner L An interactive web-based dashboard to track COVID-19 in real time. Lancet Infect. Dis 20, 533–534 (2020). - PMC - PubMed
    1. Wu Z & McGoogan JM Characteristics of and important lessons from the coronavirus disease 2019 (COVID-19) outbreak in China: summary of a report of 72314 cases from the Chinese Center for Disease Control and Prevention. JAMA 323, 1239–1242 (2020). - PubMed
    1. Huang C et al. Clinical features of patients infected with 2019 novel coronavirus in Wuhan, China. Lancet 395, 497–506 (2020). - PMC - PubMed
    1. Chen G et al. Clinical and immunologic features in severe and moderate Coronavirus Disease 2019. J. Clin. Invest (in the press). - PMC - PubMed
    1. Zhou Y et al. Pathogenic T cells and inflammatory monocytes incite inflammatory storm in severe COVID-19 patients. Natl Sci. Rev (in the press). - PMC - PubMed

Publication types

MeSH terms