Comparative Study
. 2020 Sep;16(9):964-972.
doi: 10.1038/s41589-020-0558-1. Epub 2020 Jun 8.

Comparative tRNA sequencing and RNA mass spectrometry for surveying tRNA modifications

Affiliations
Comparative Study

Comparative tRNA sequencing and RNA mass spectrometry for surveying tRNA modifications

Satoshi Kimura et al. Nat Chem Biol. 2020 Sep.

Abstract

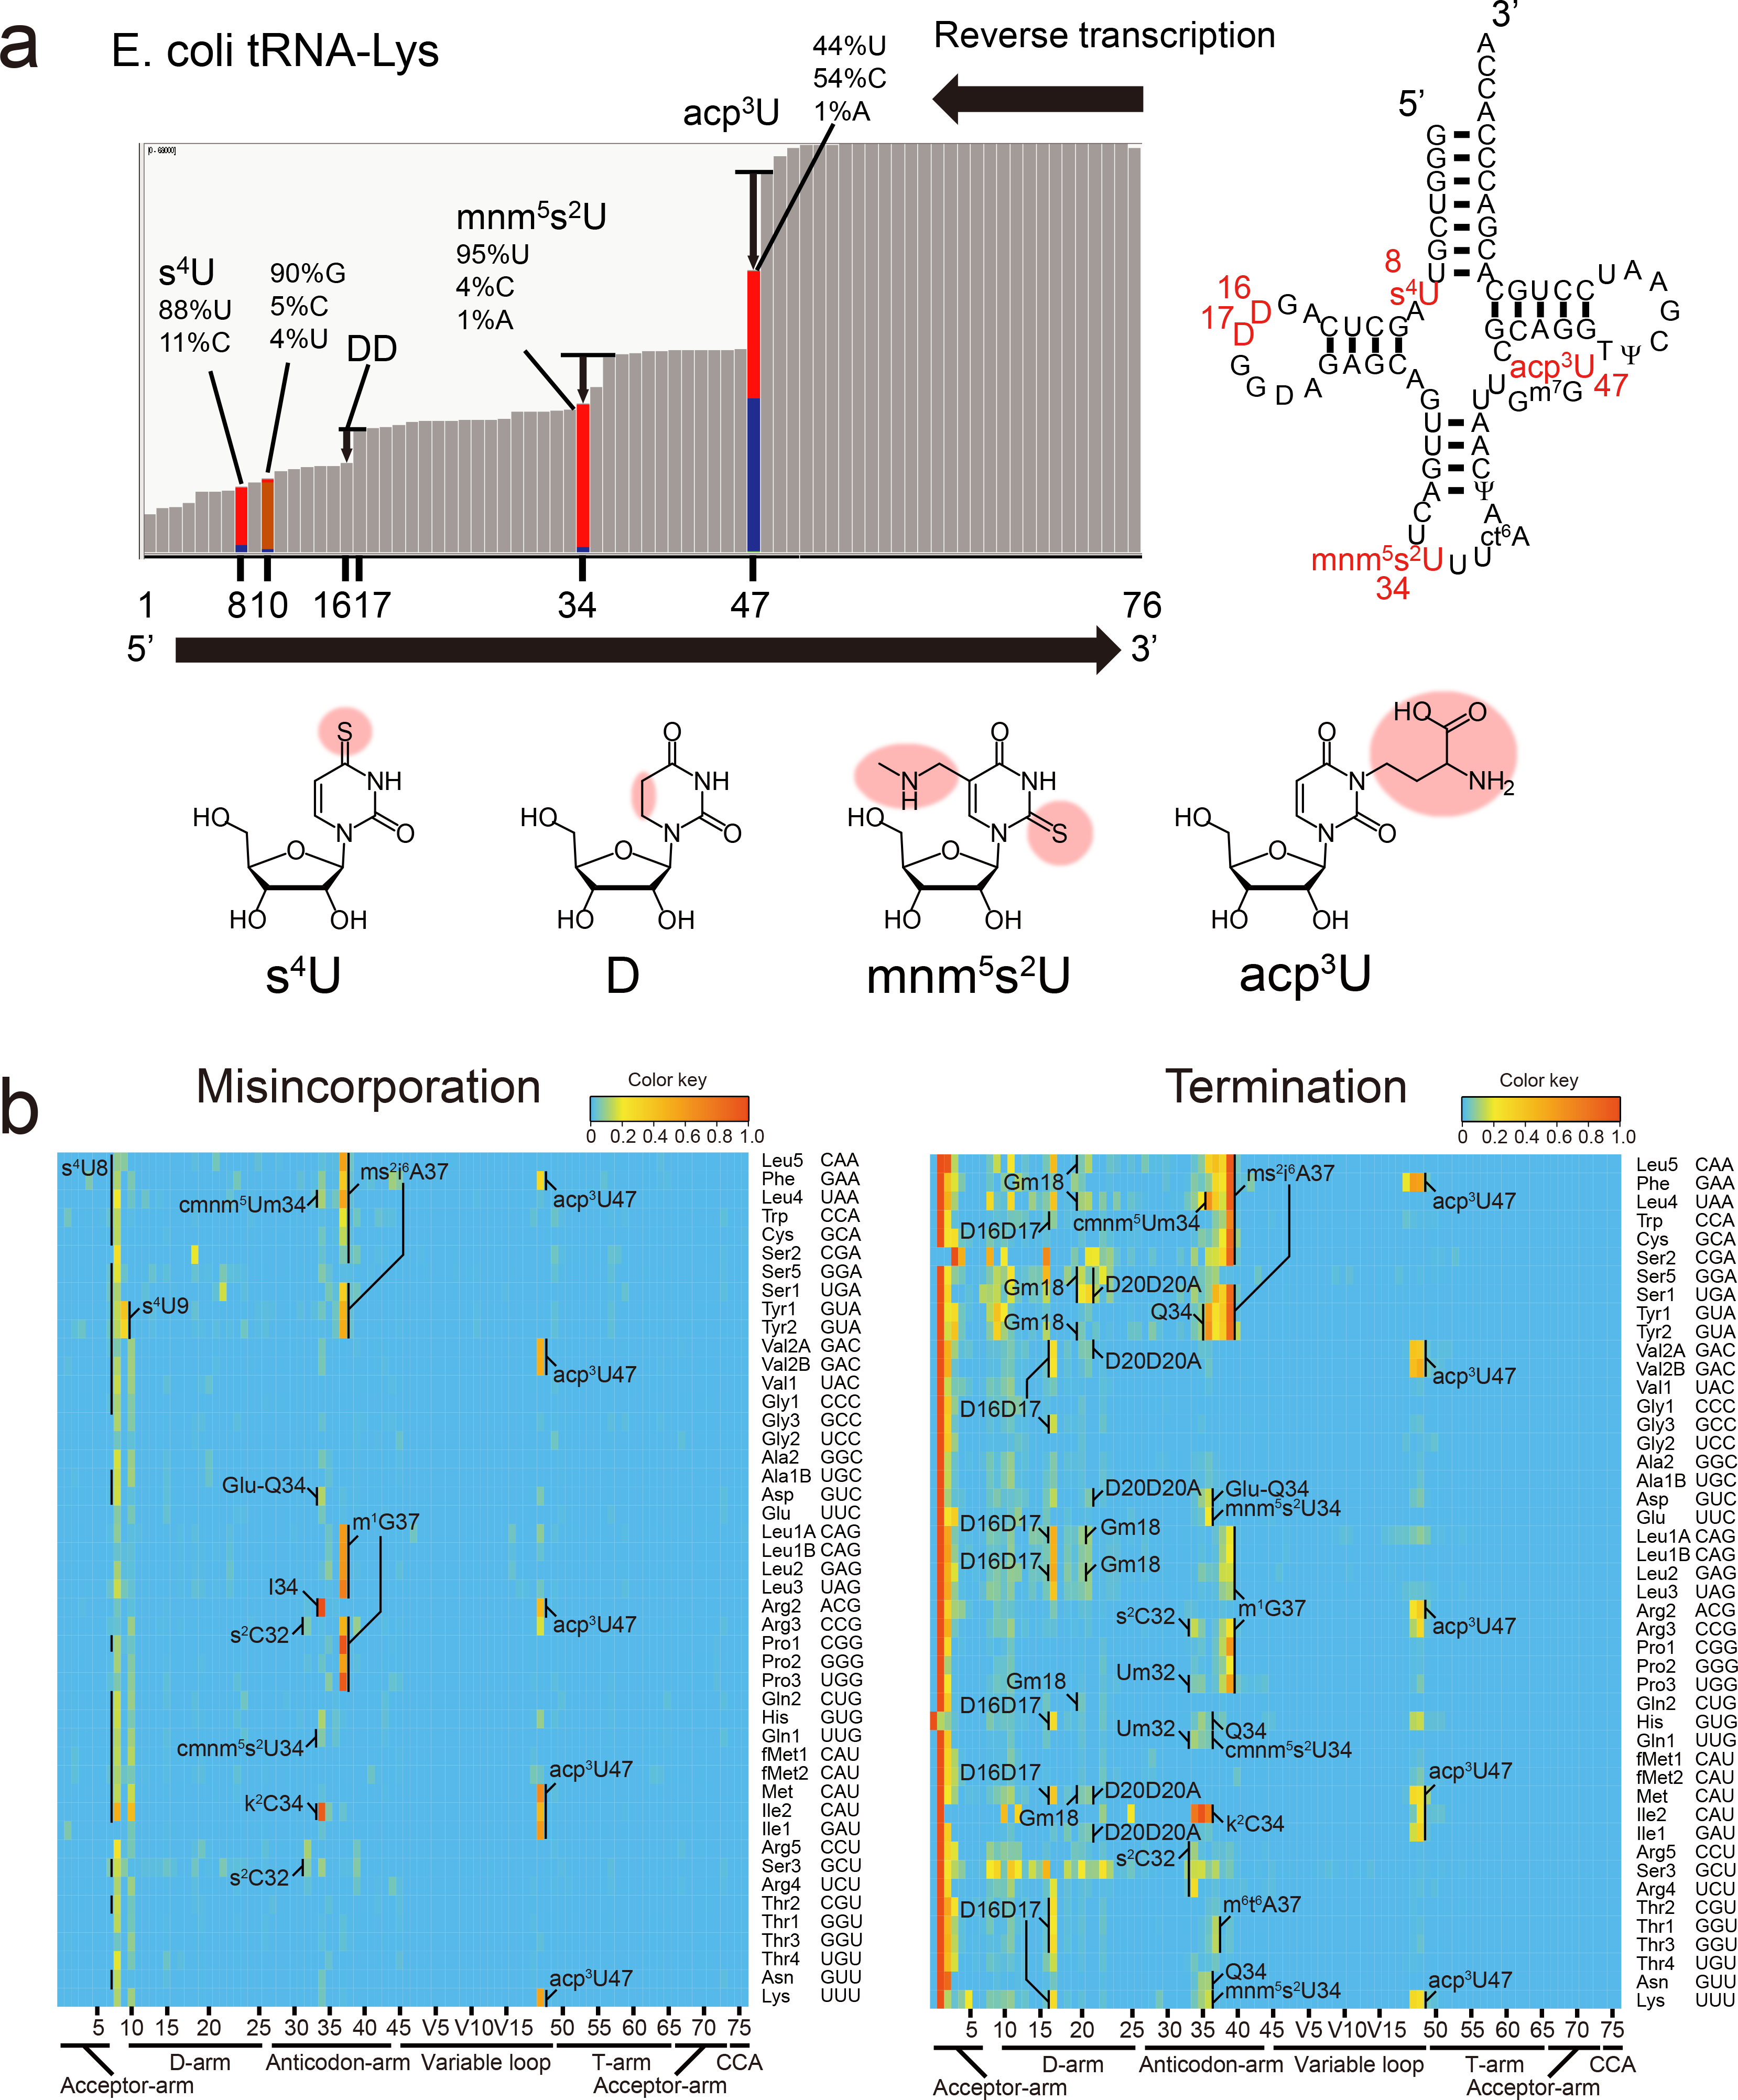
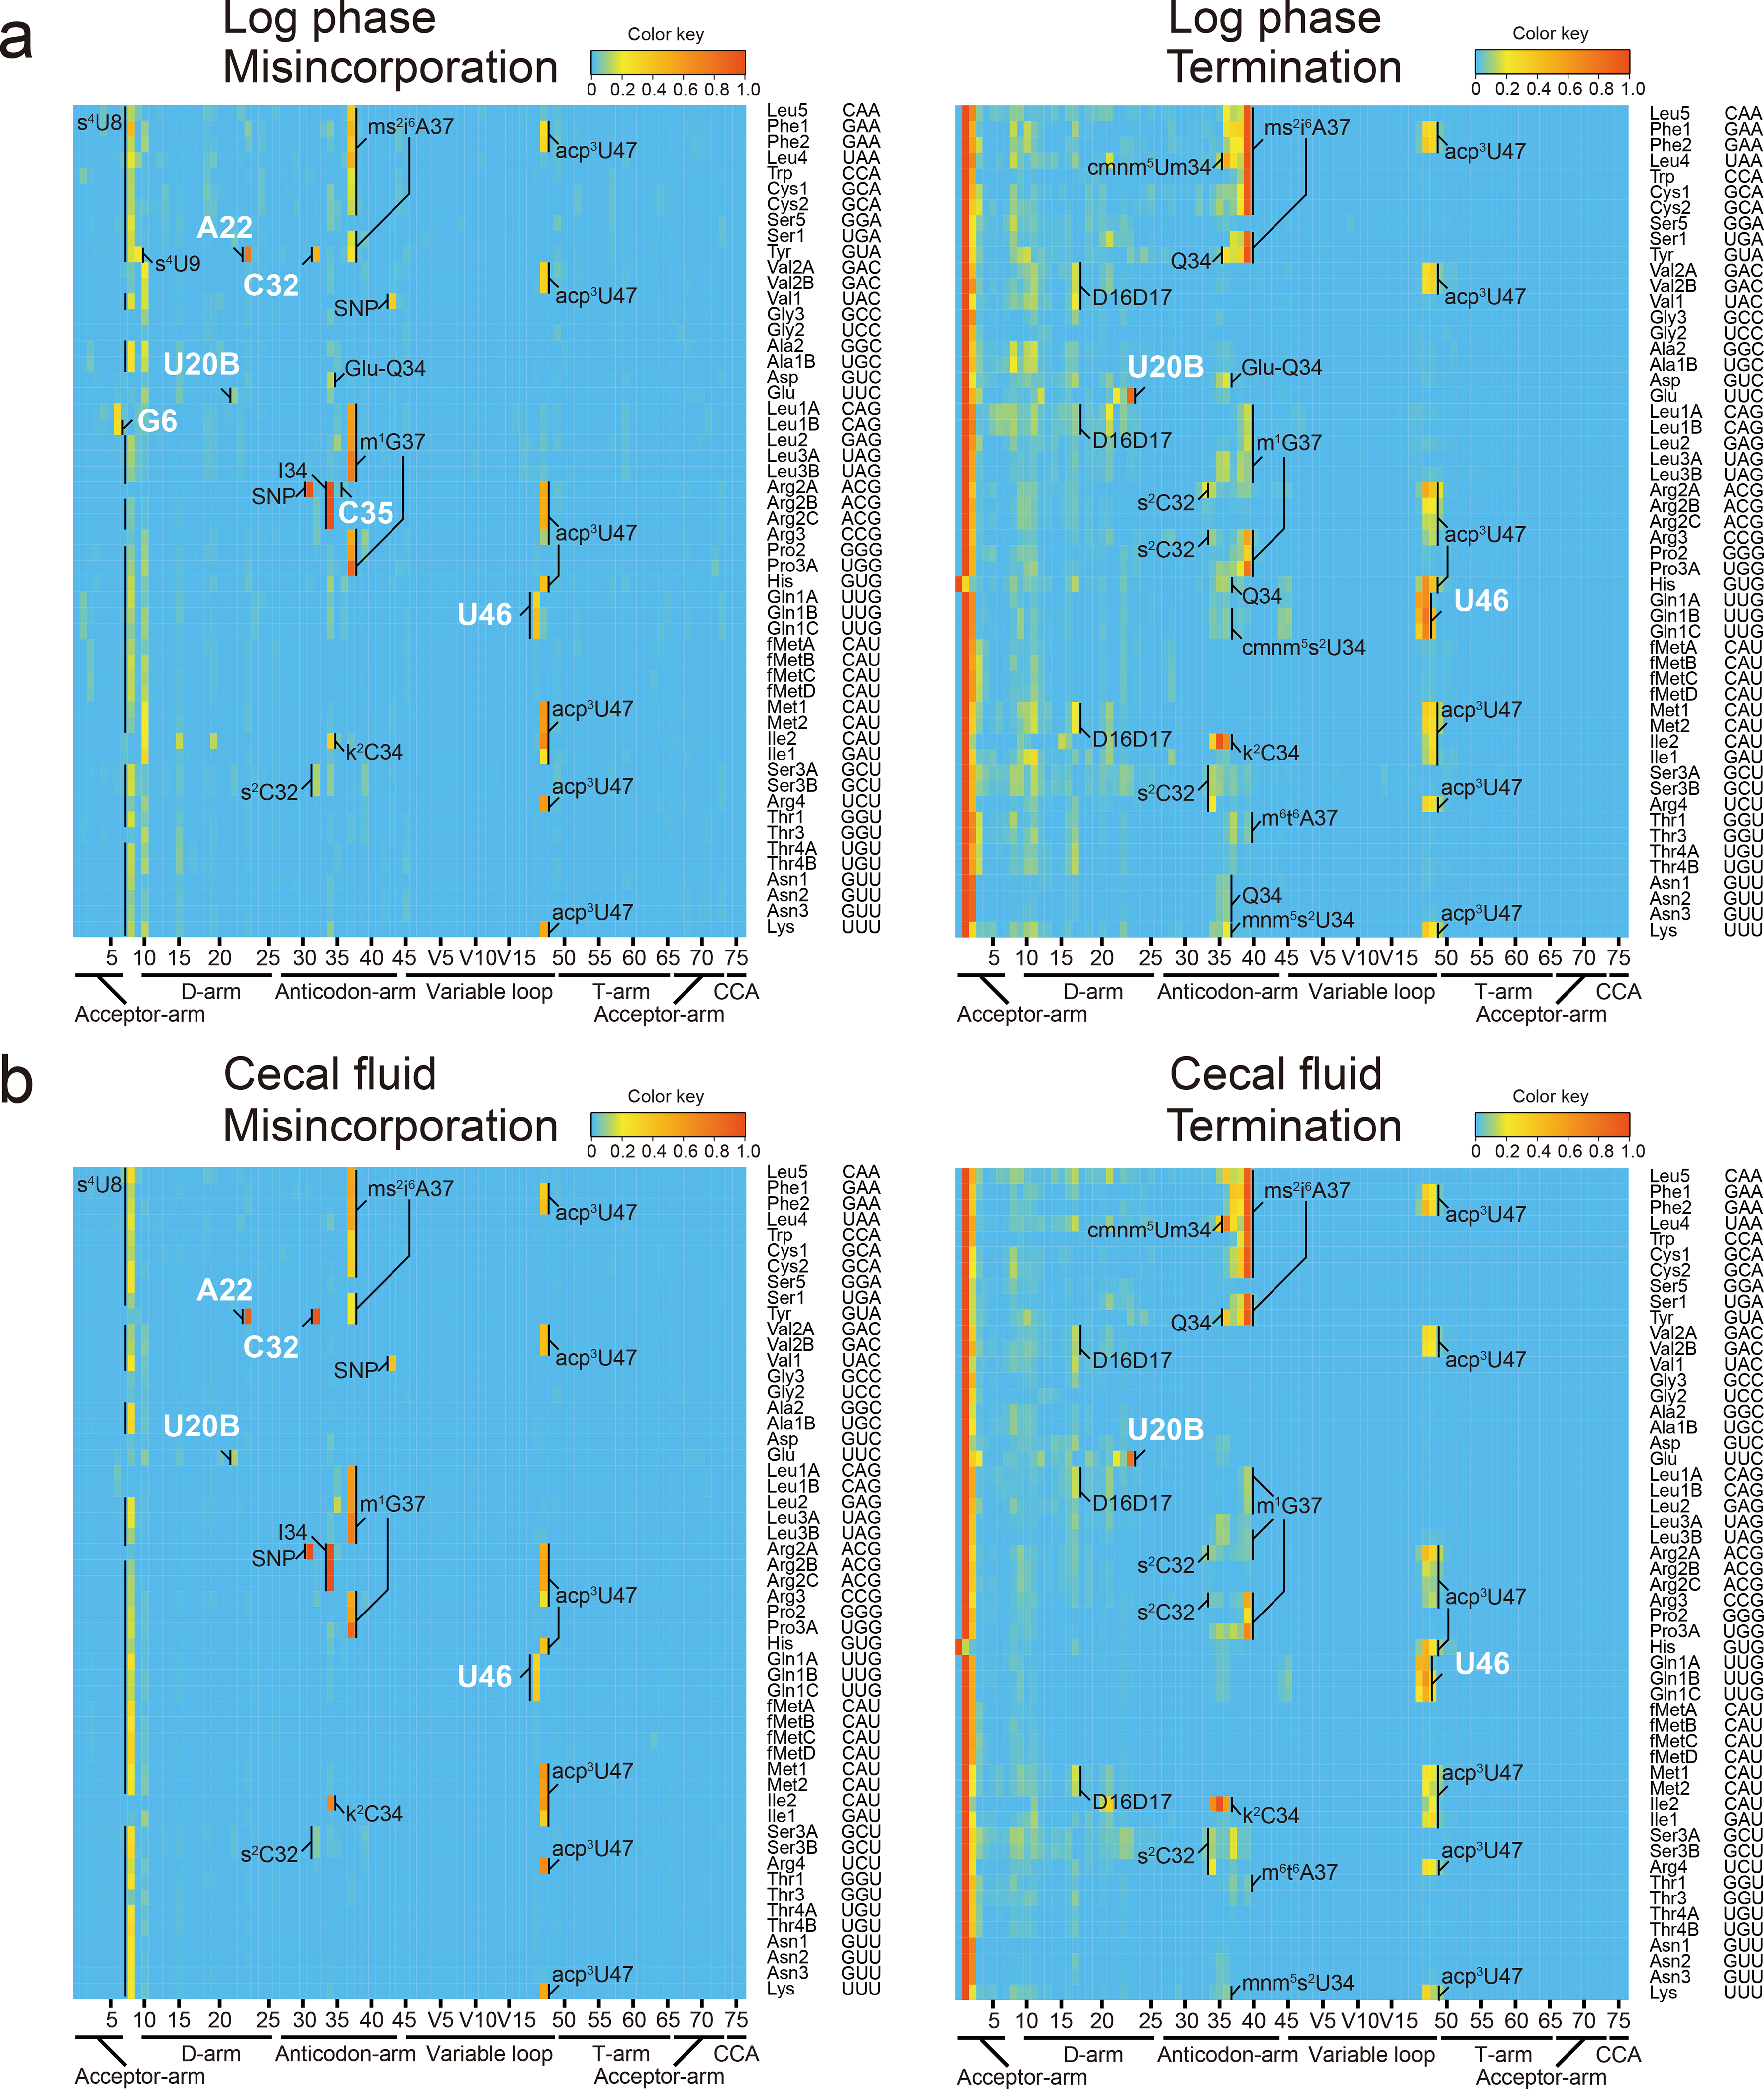
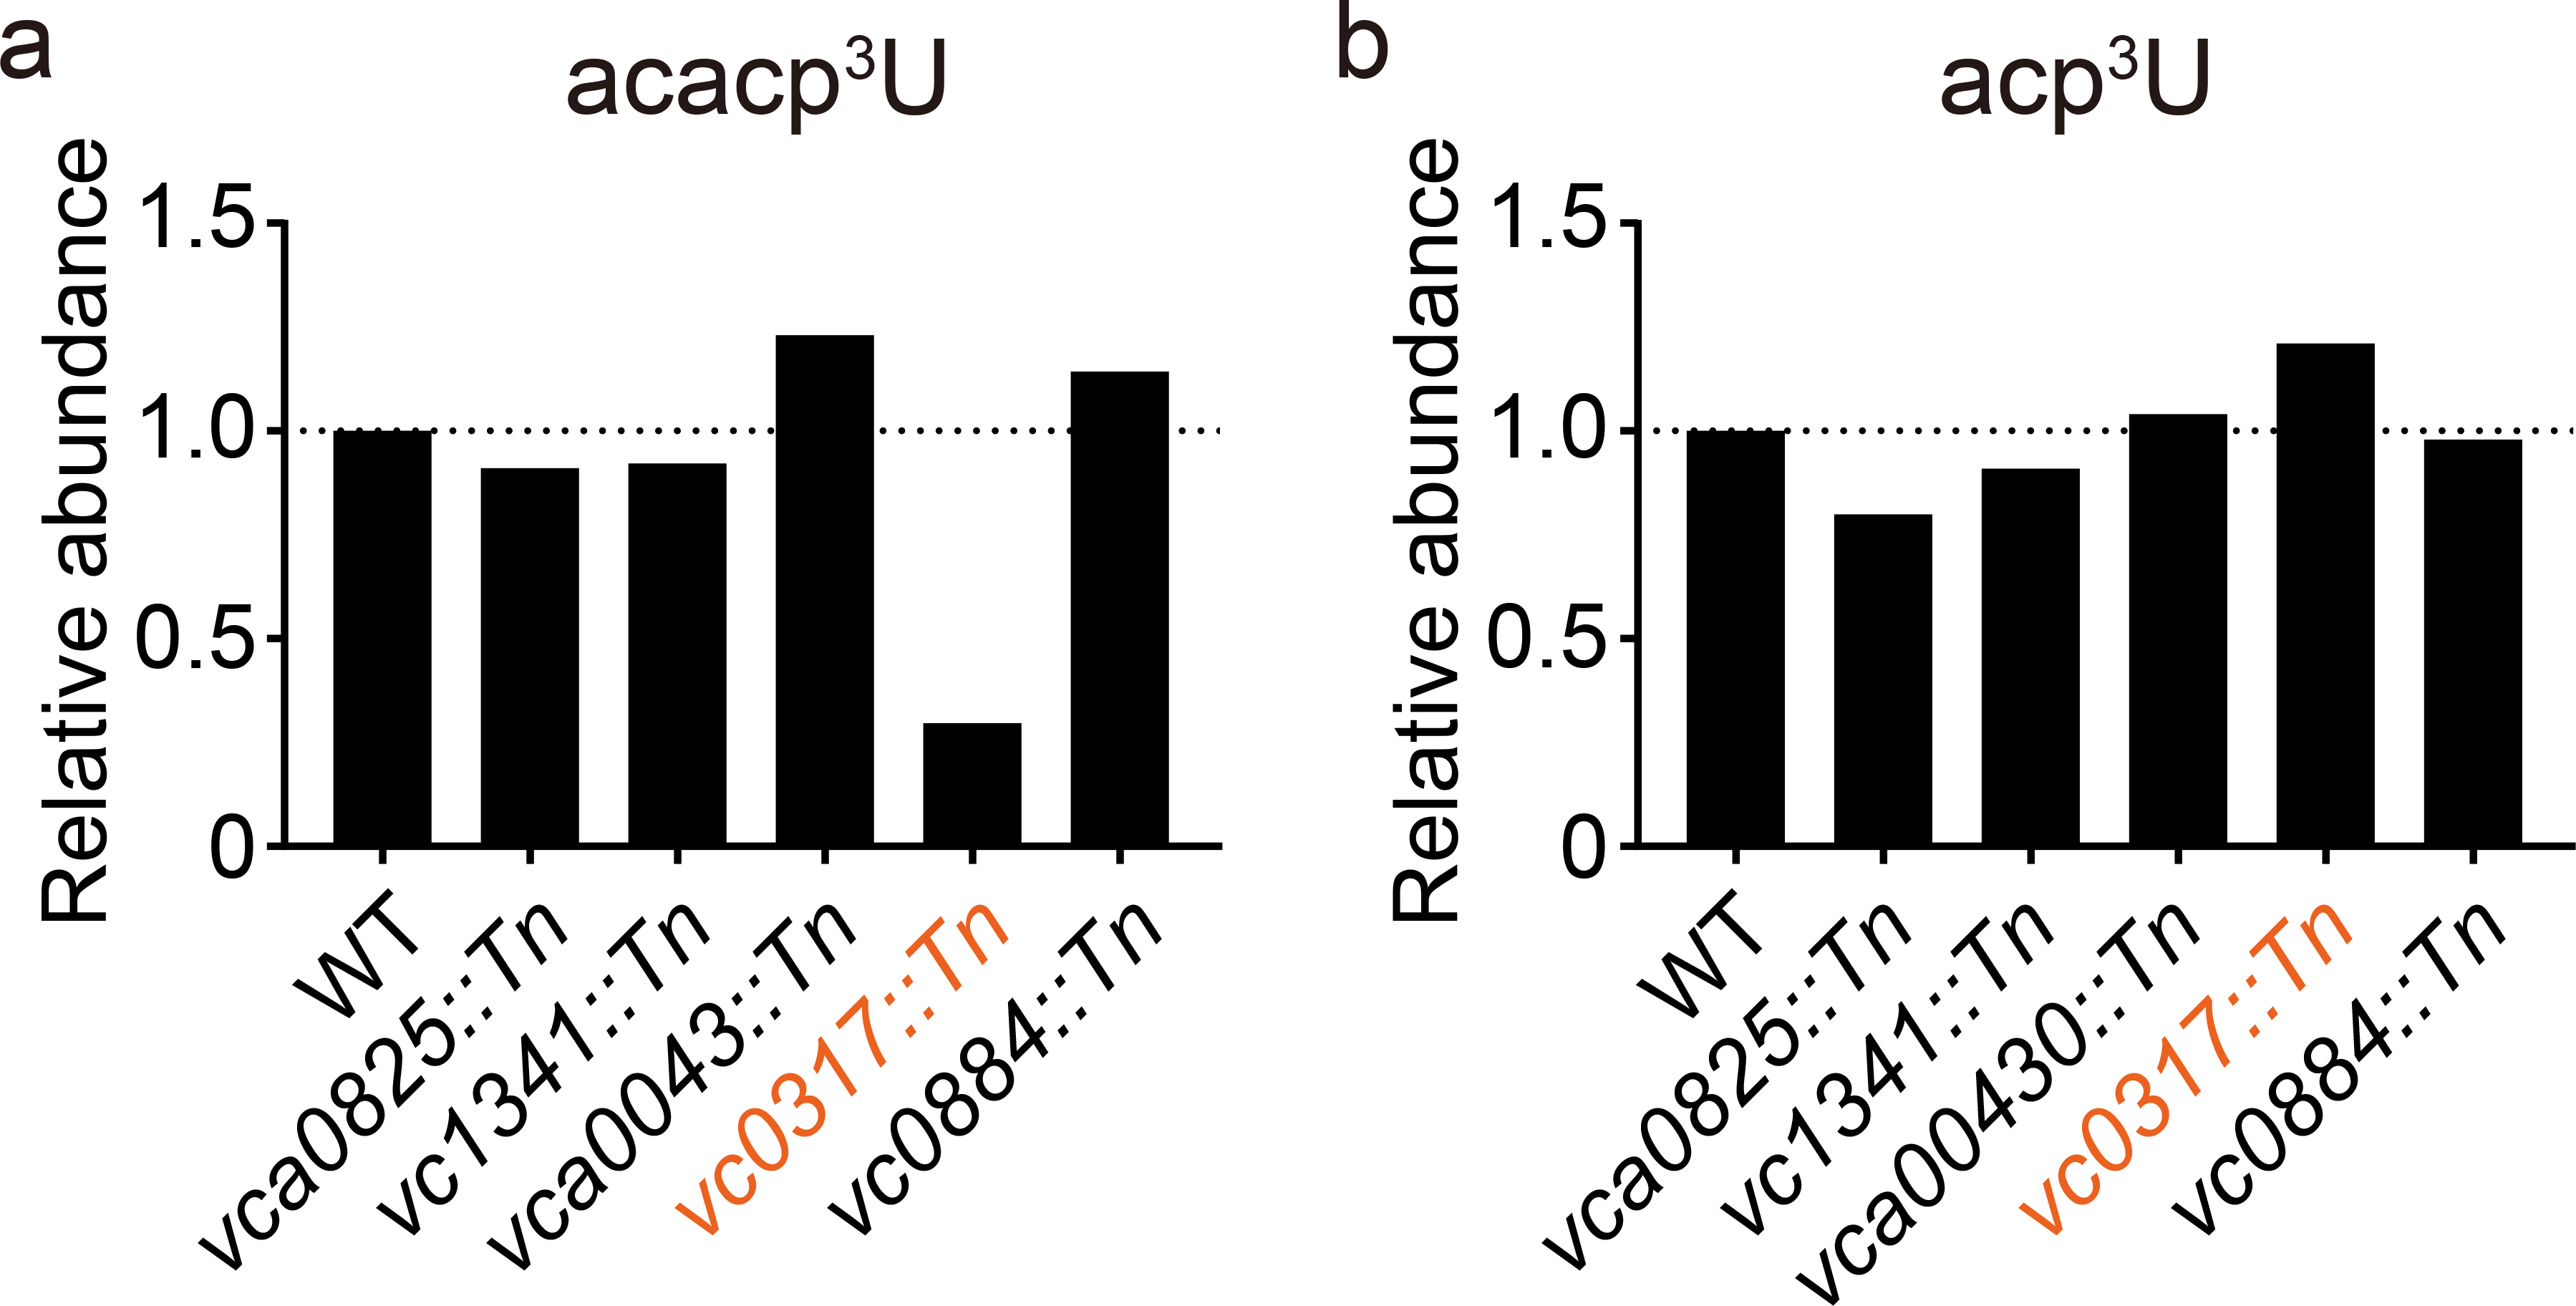
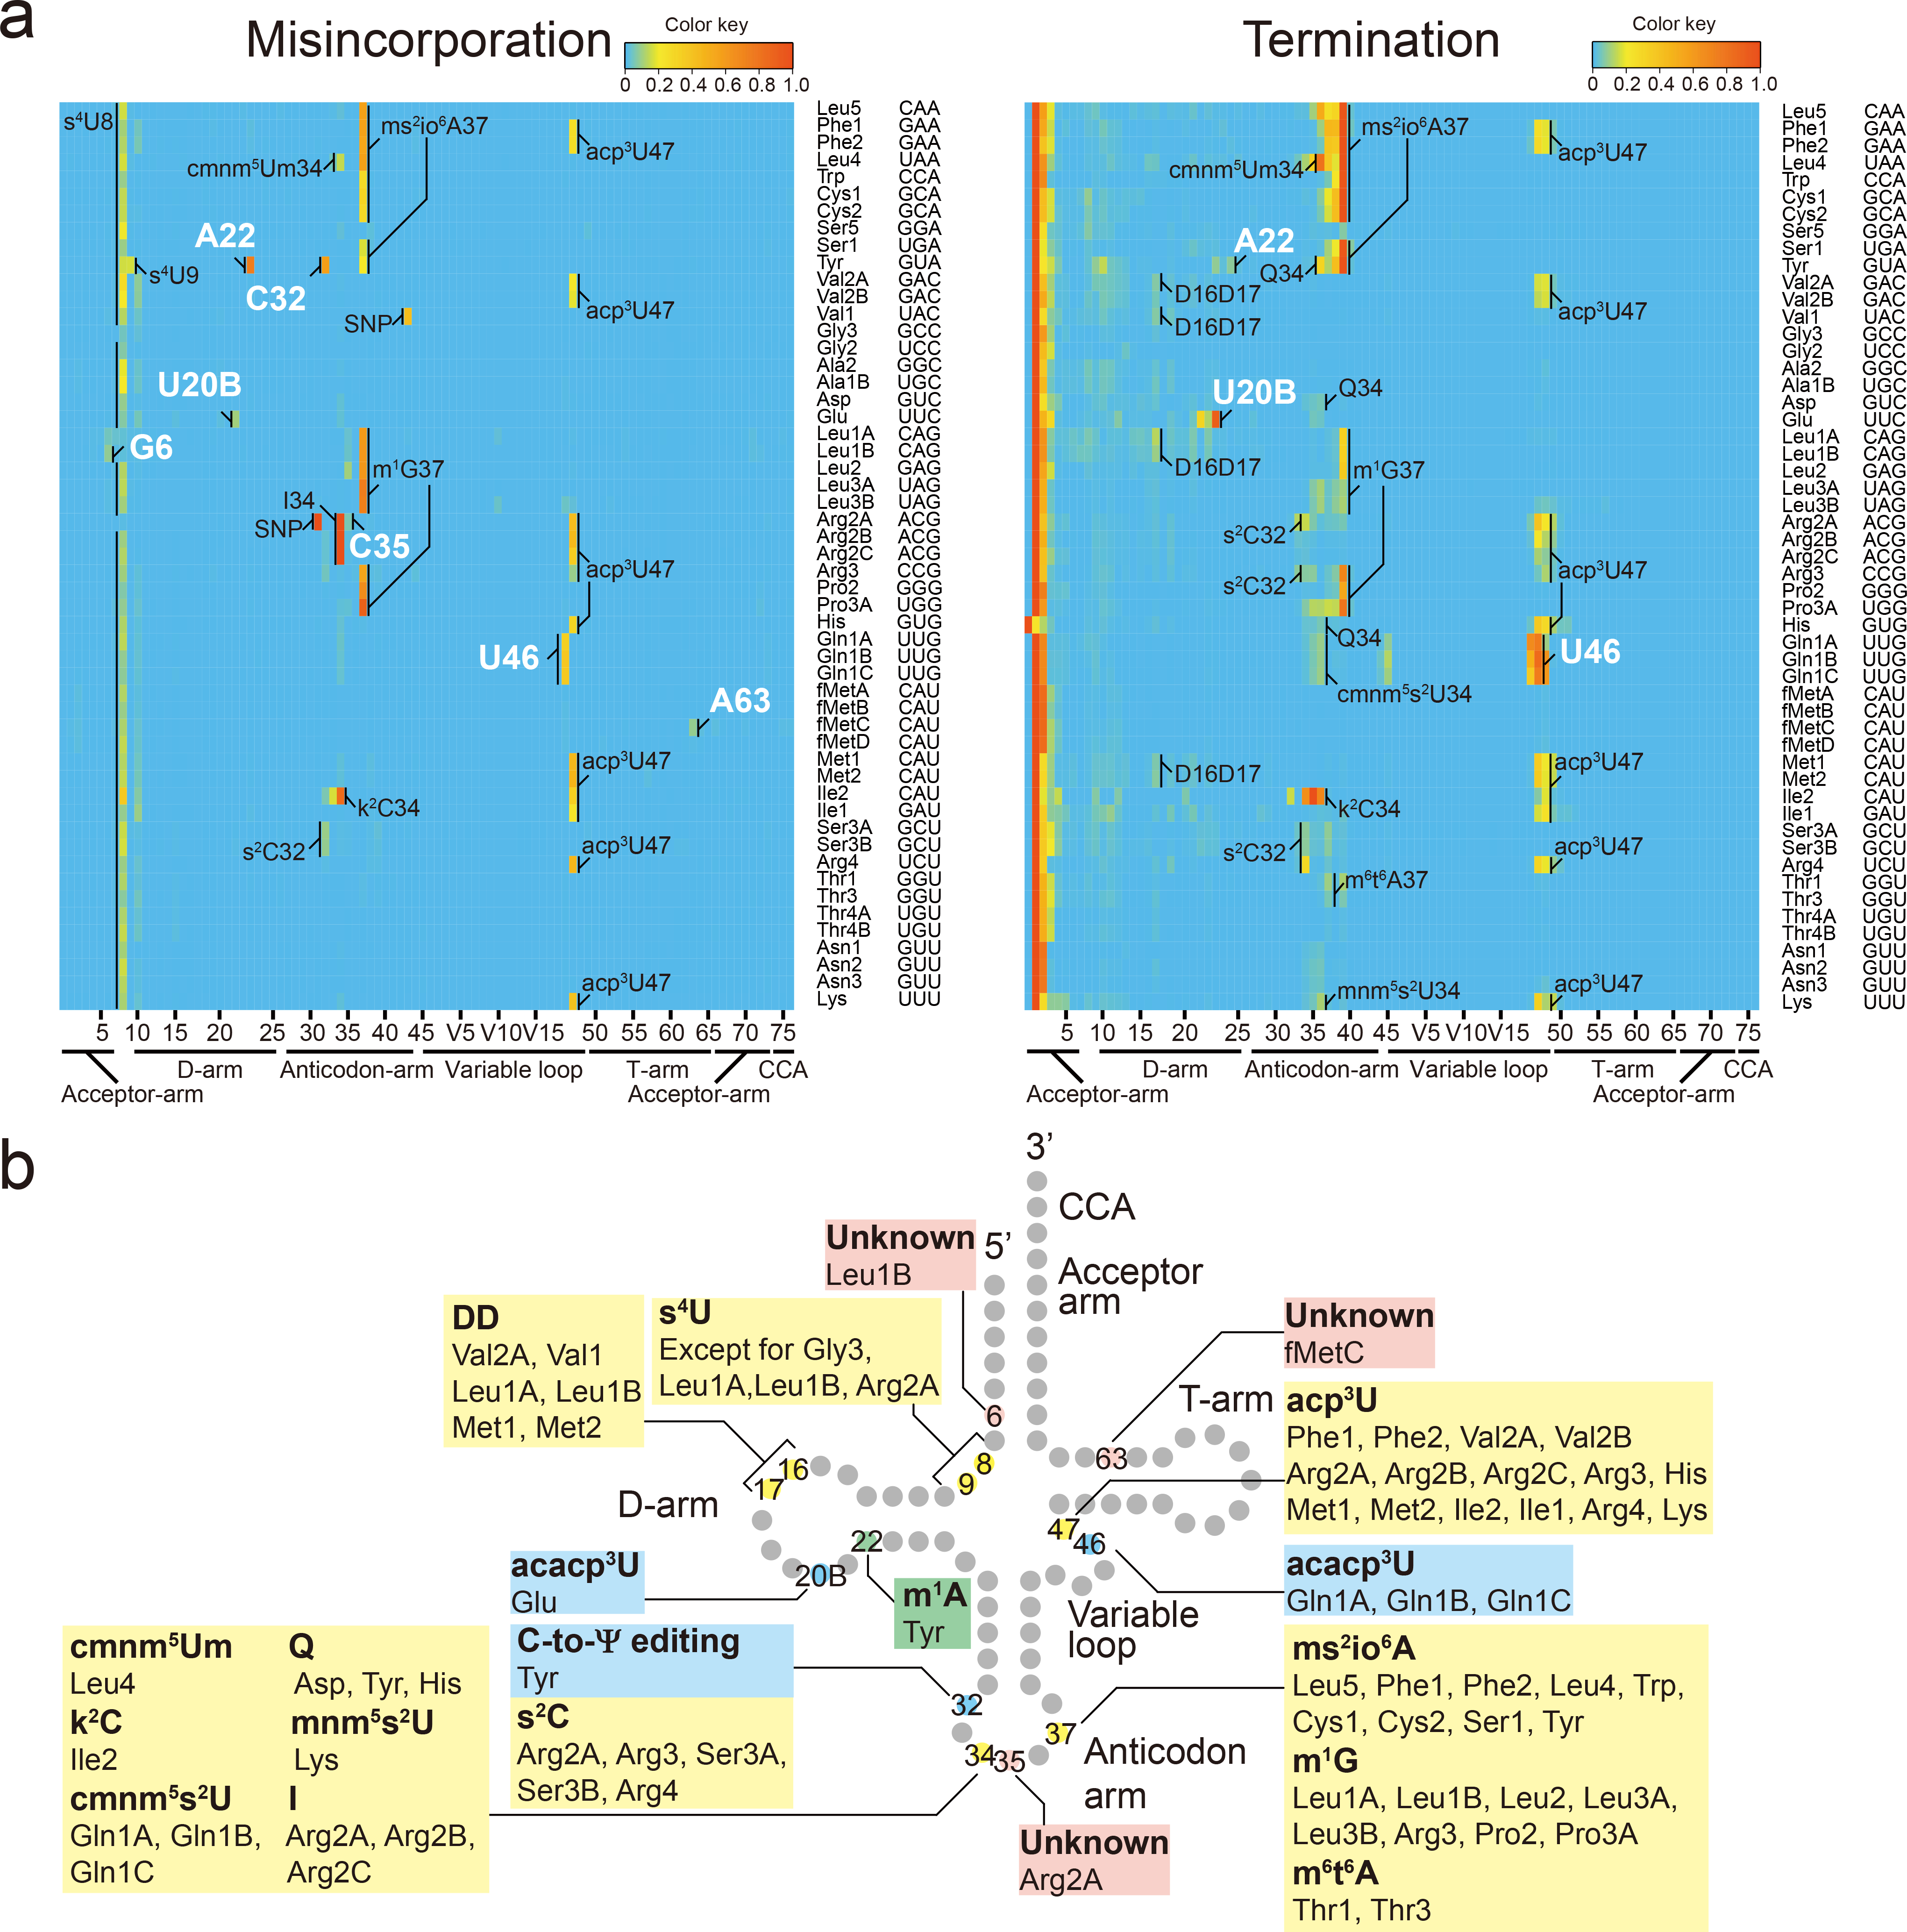
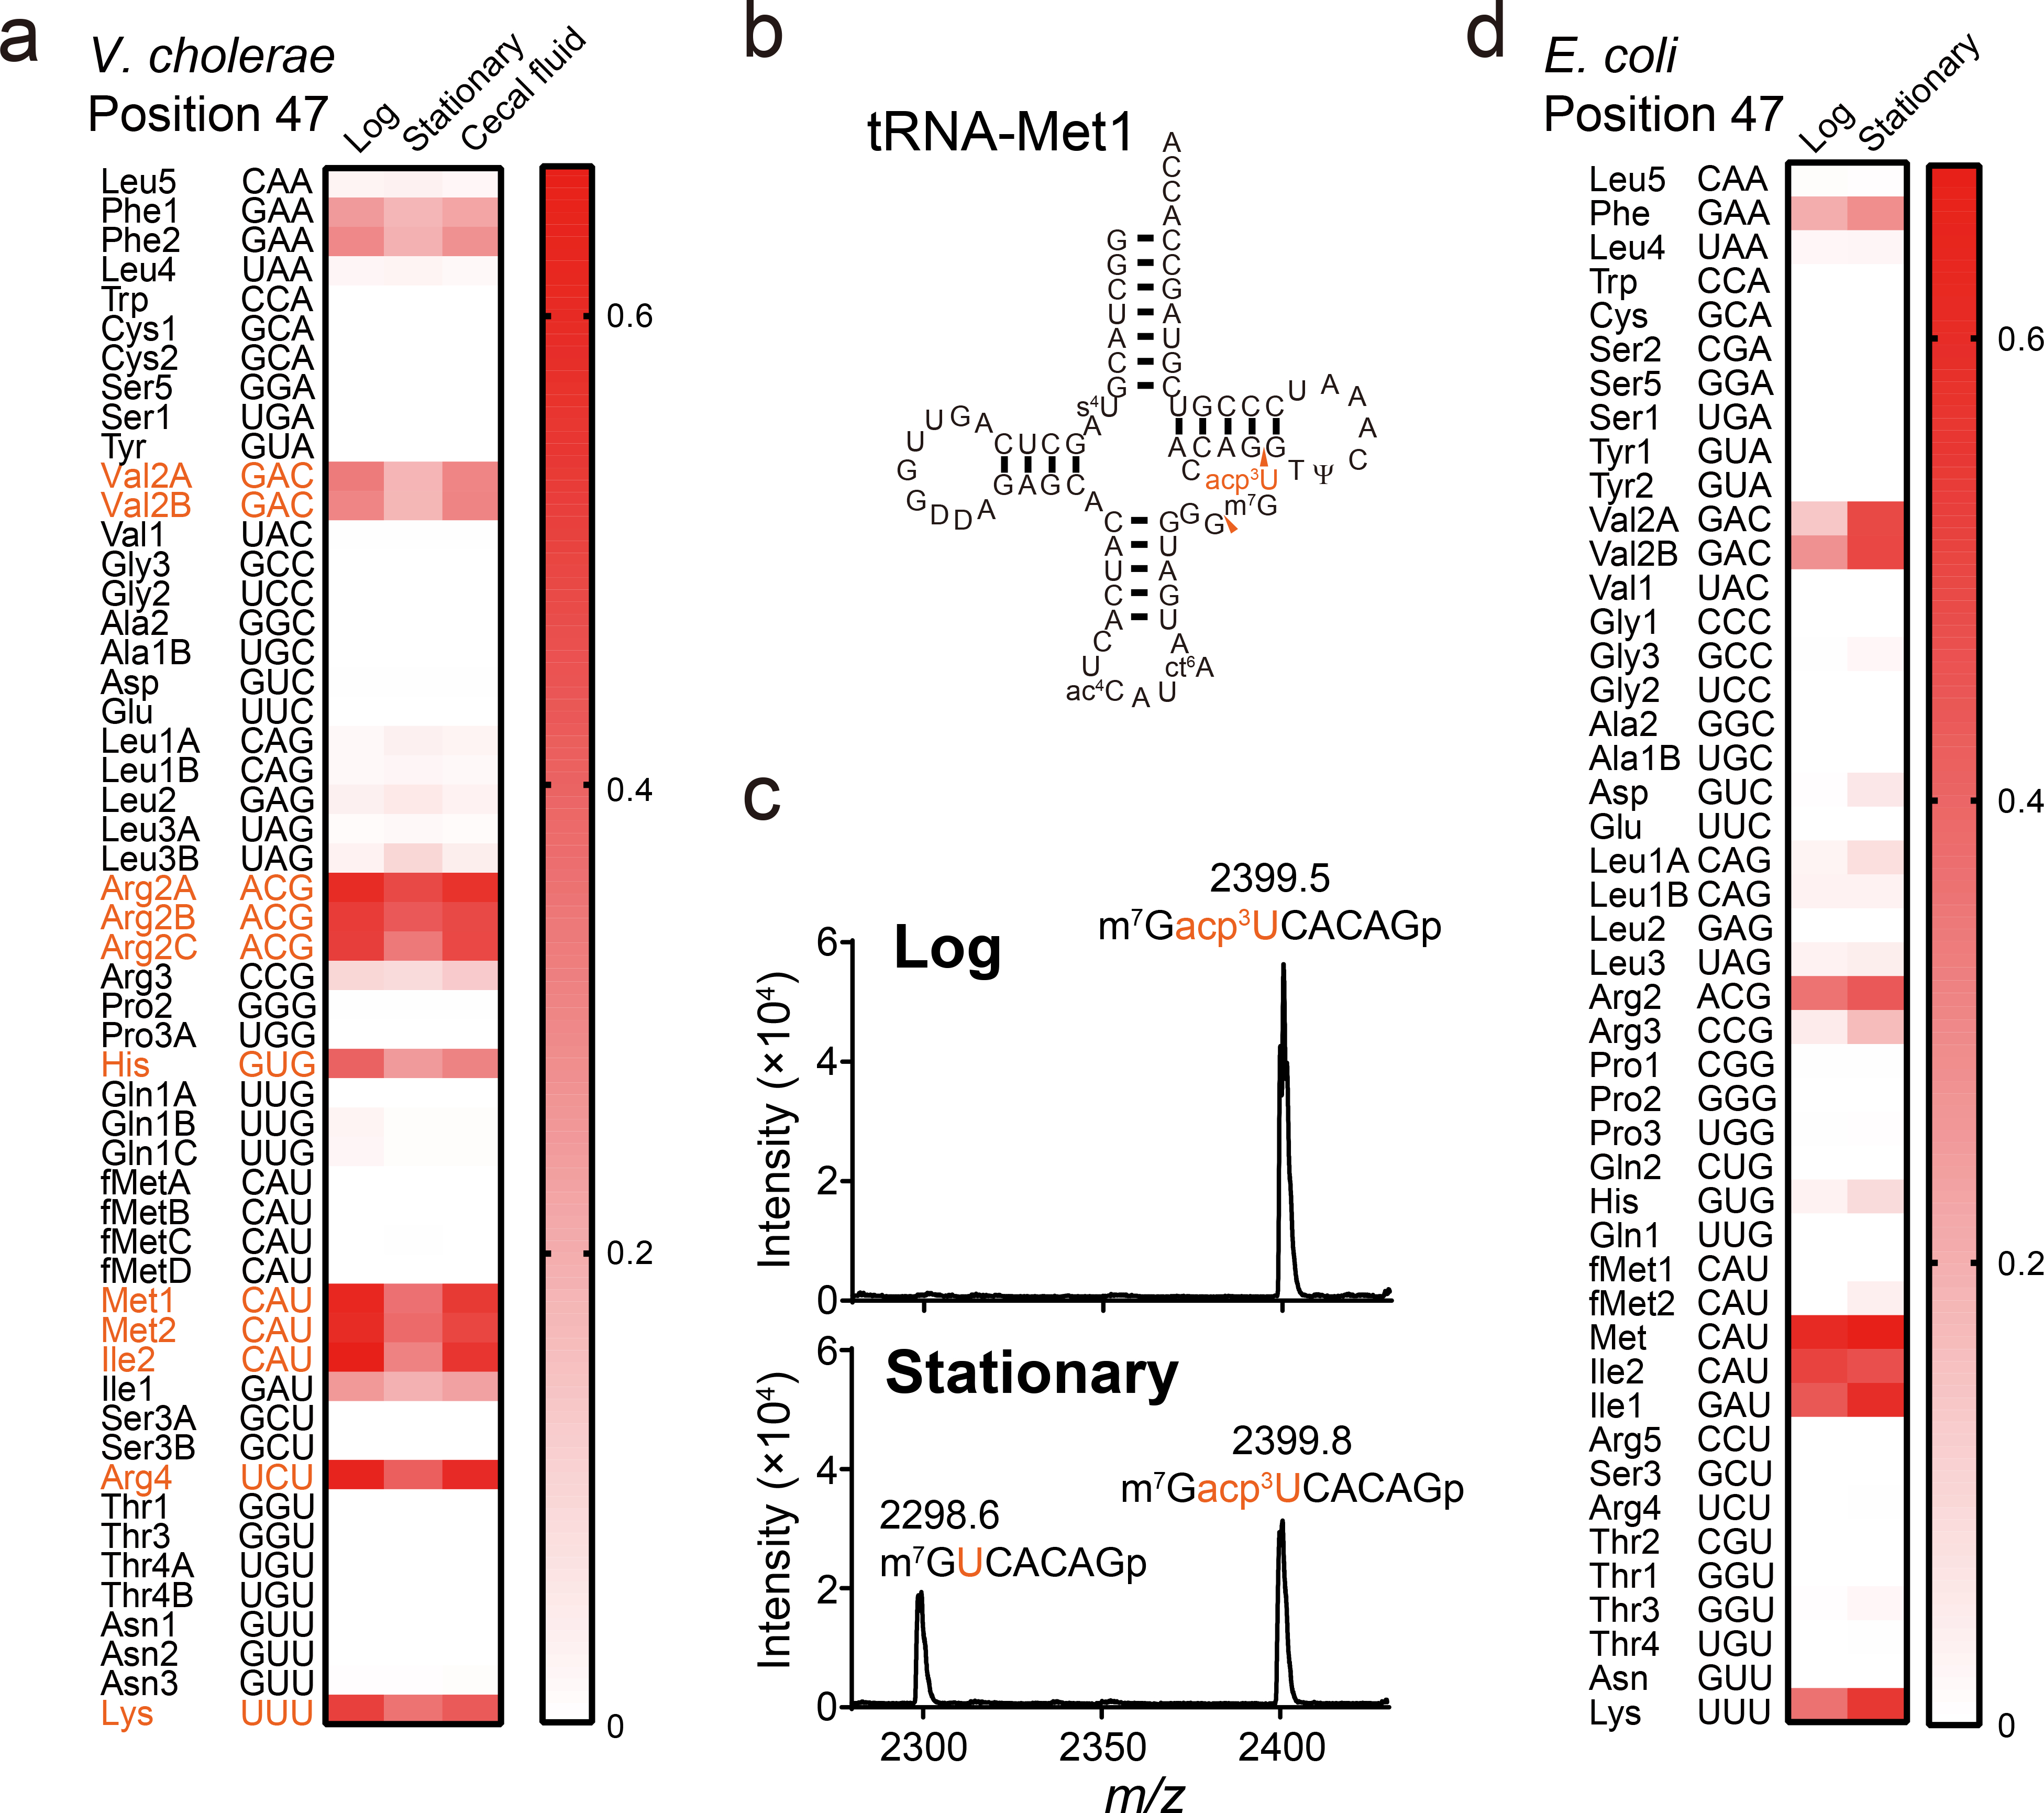
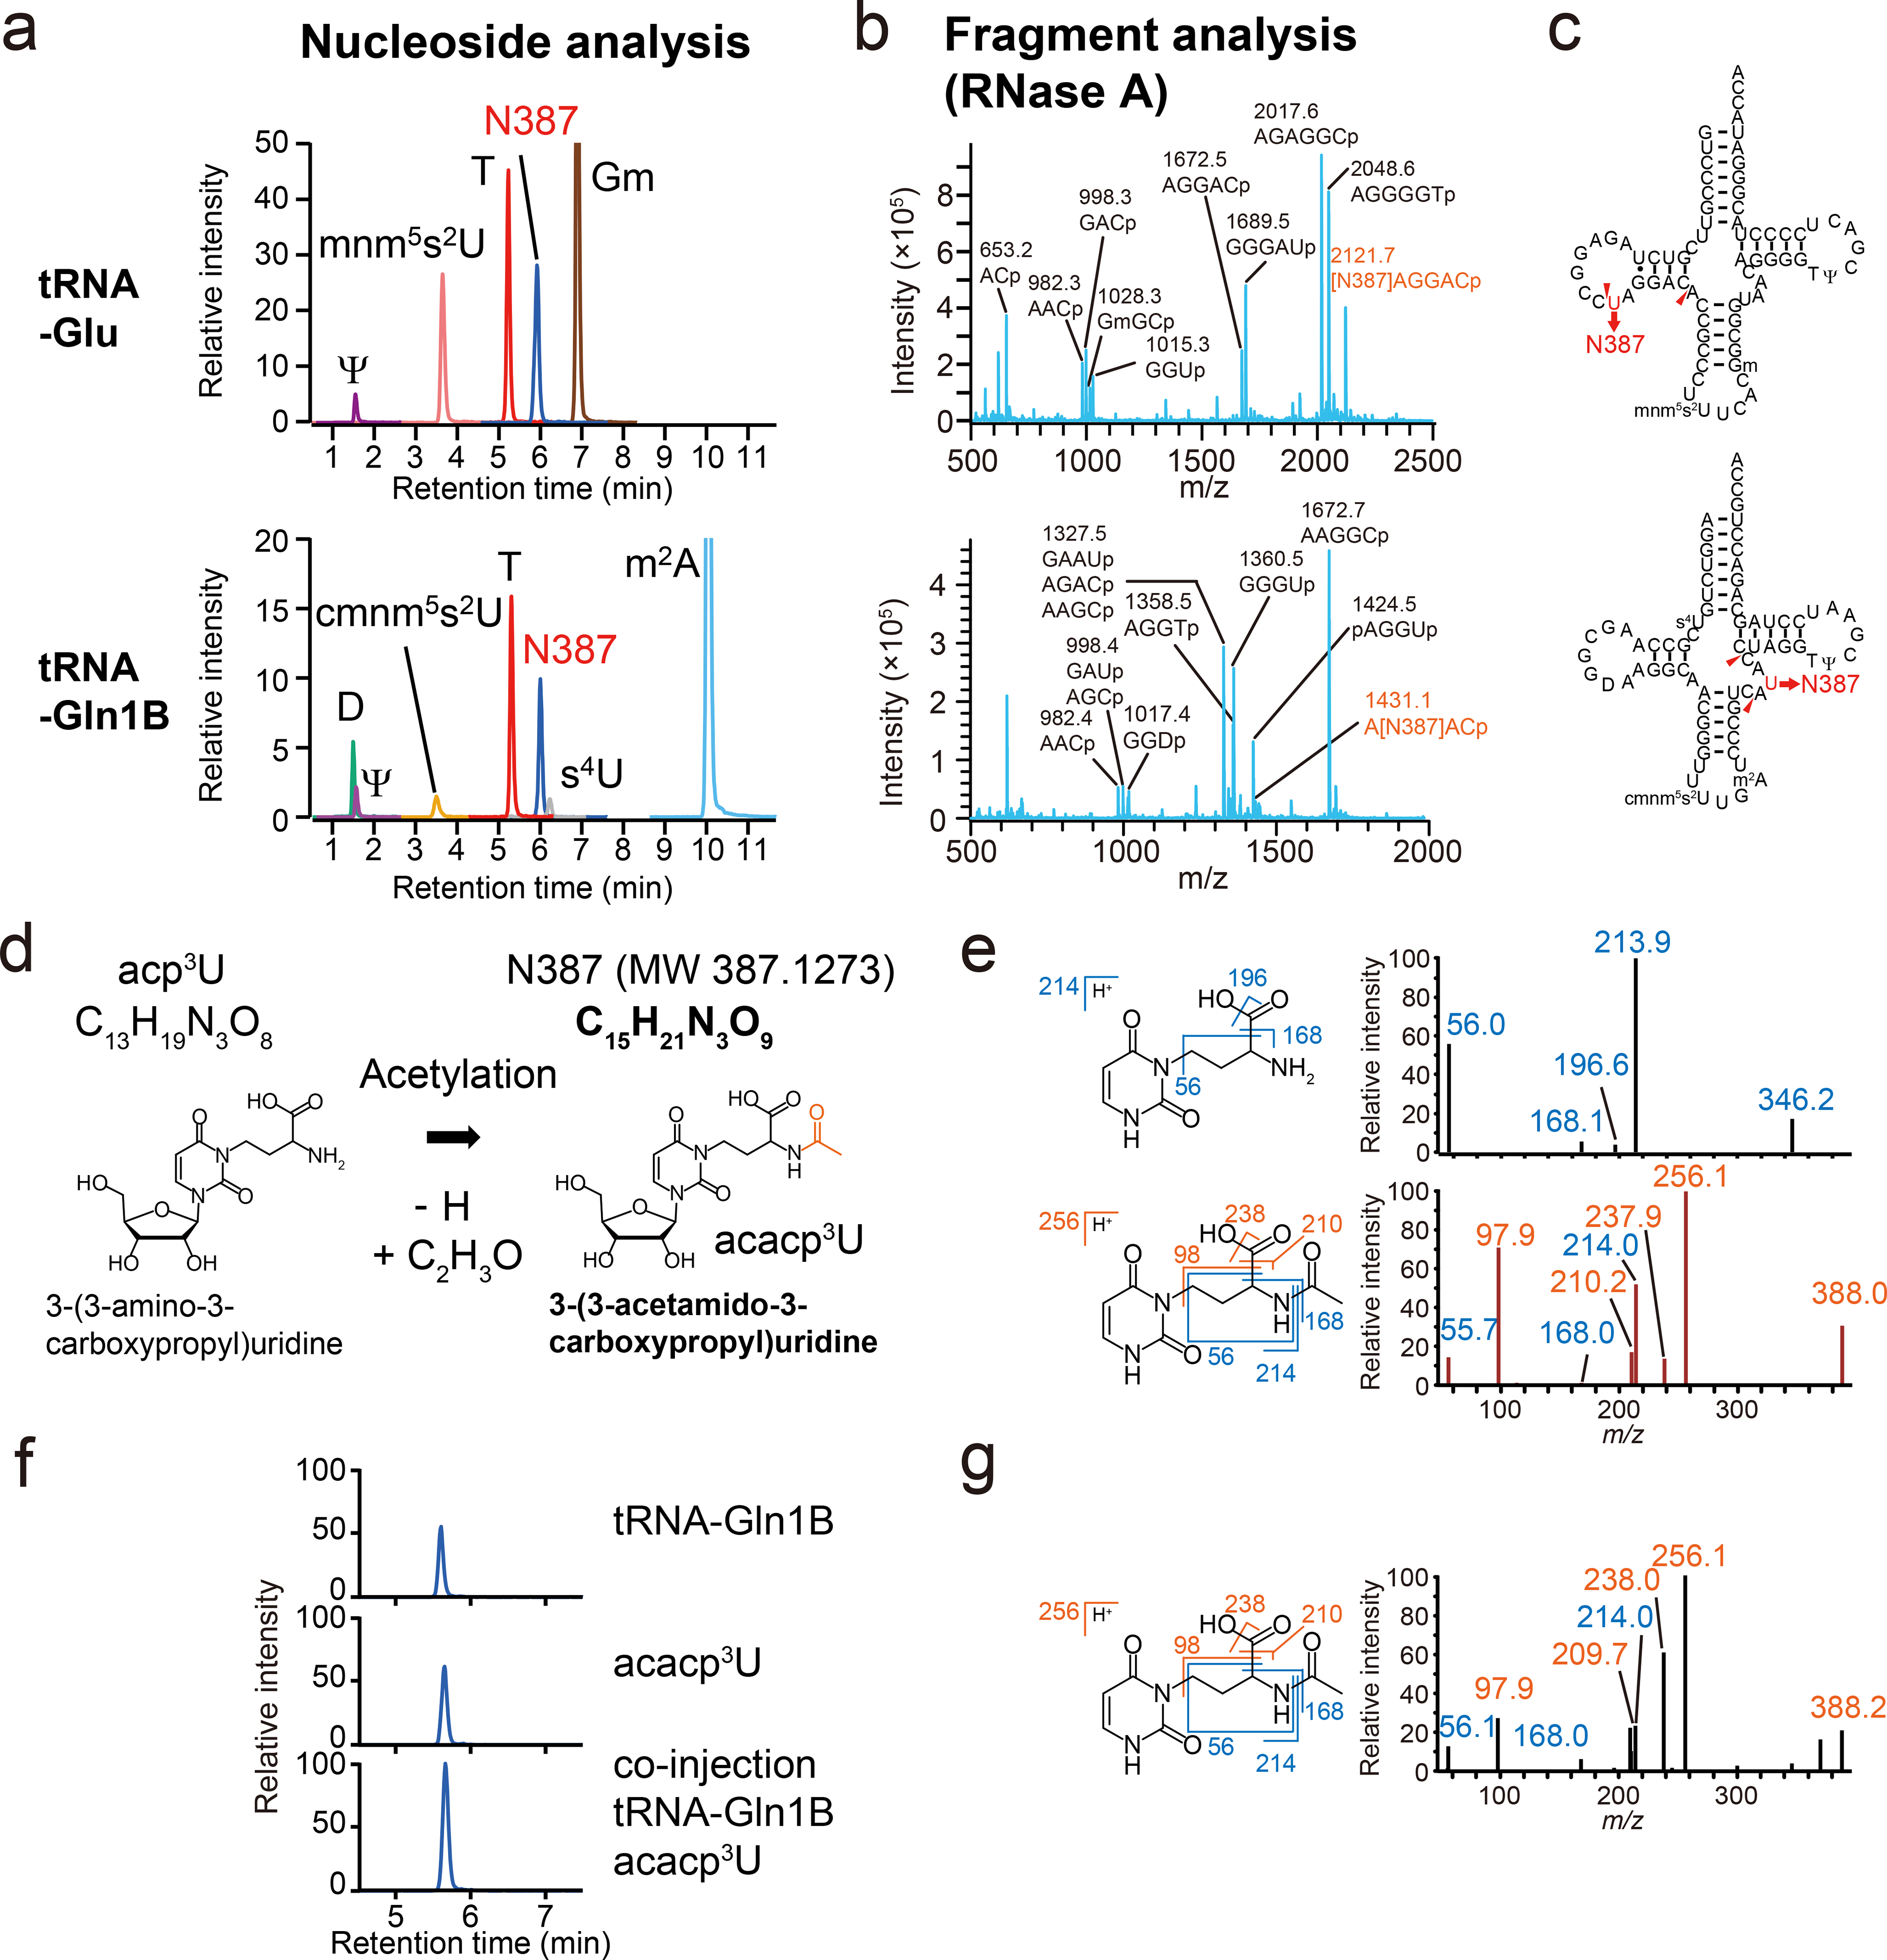
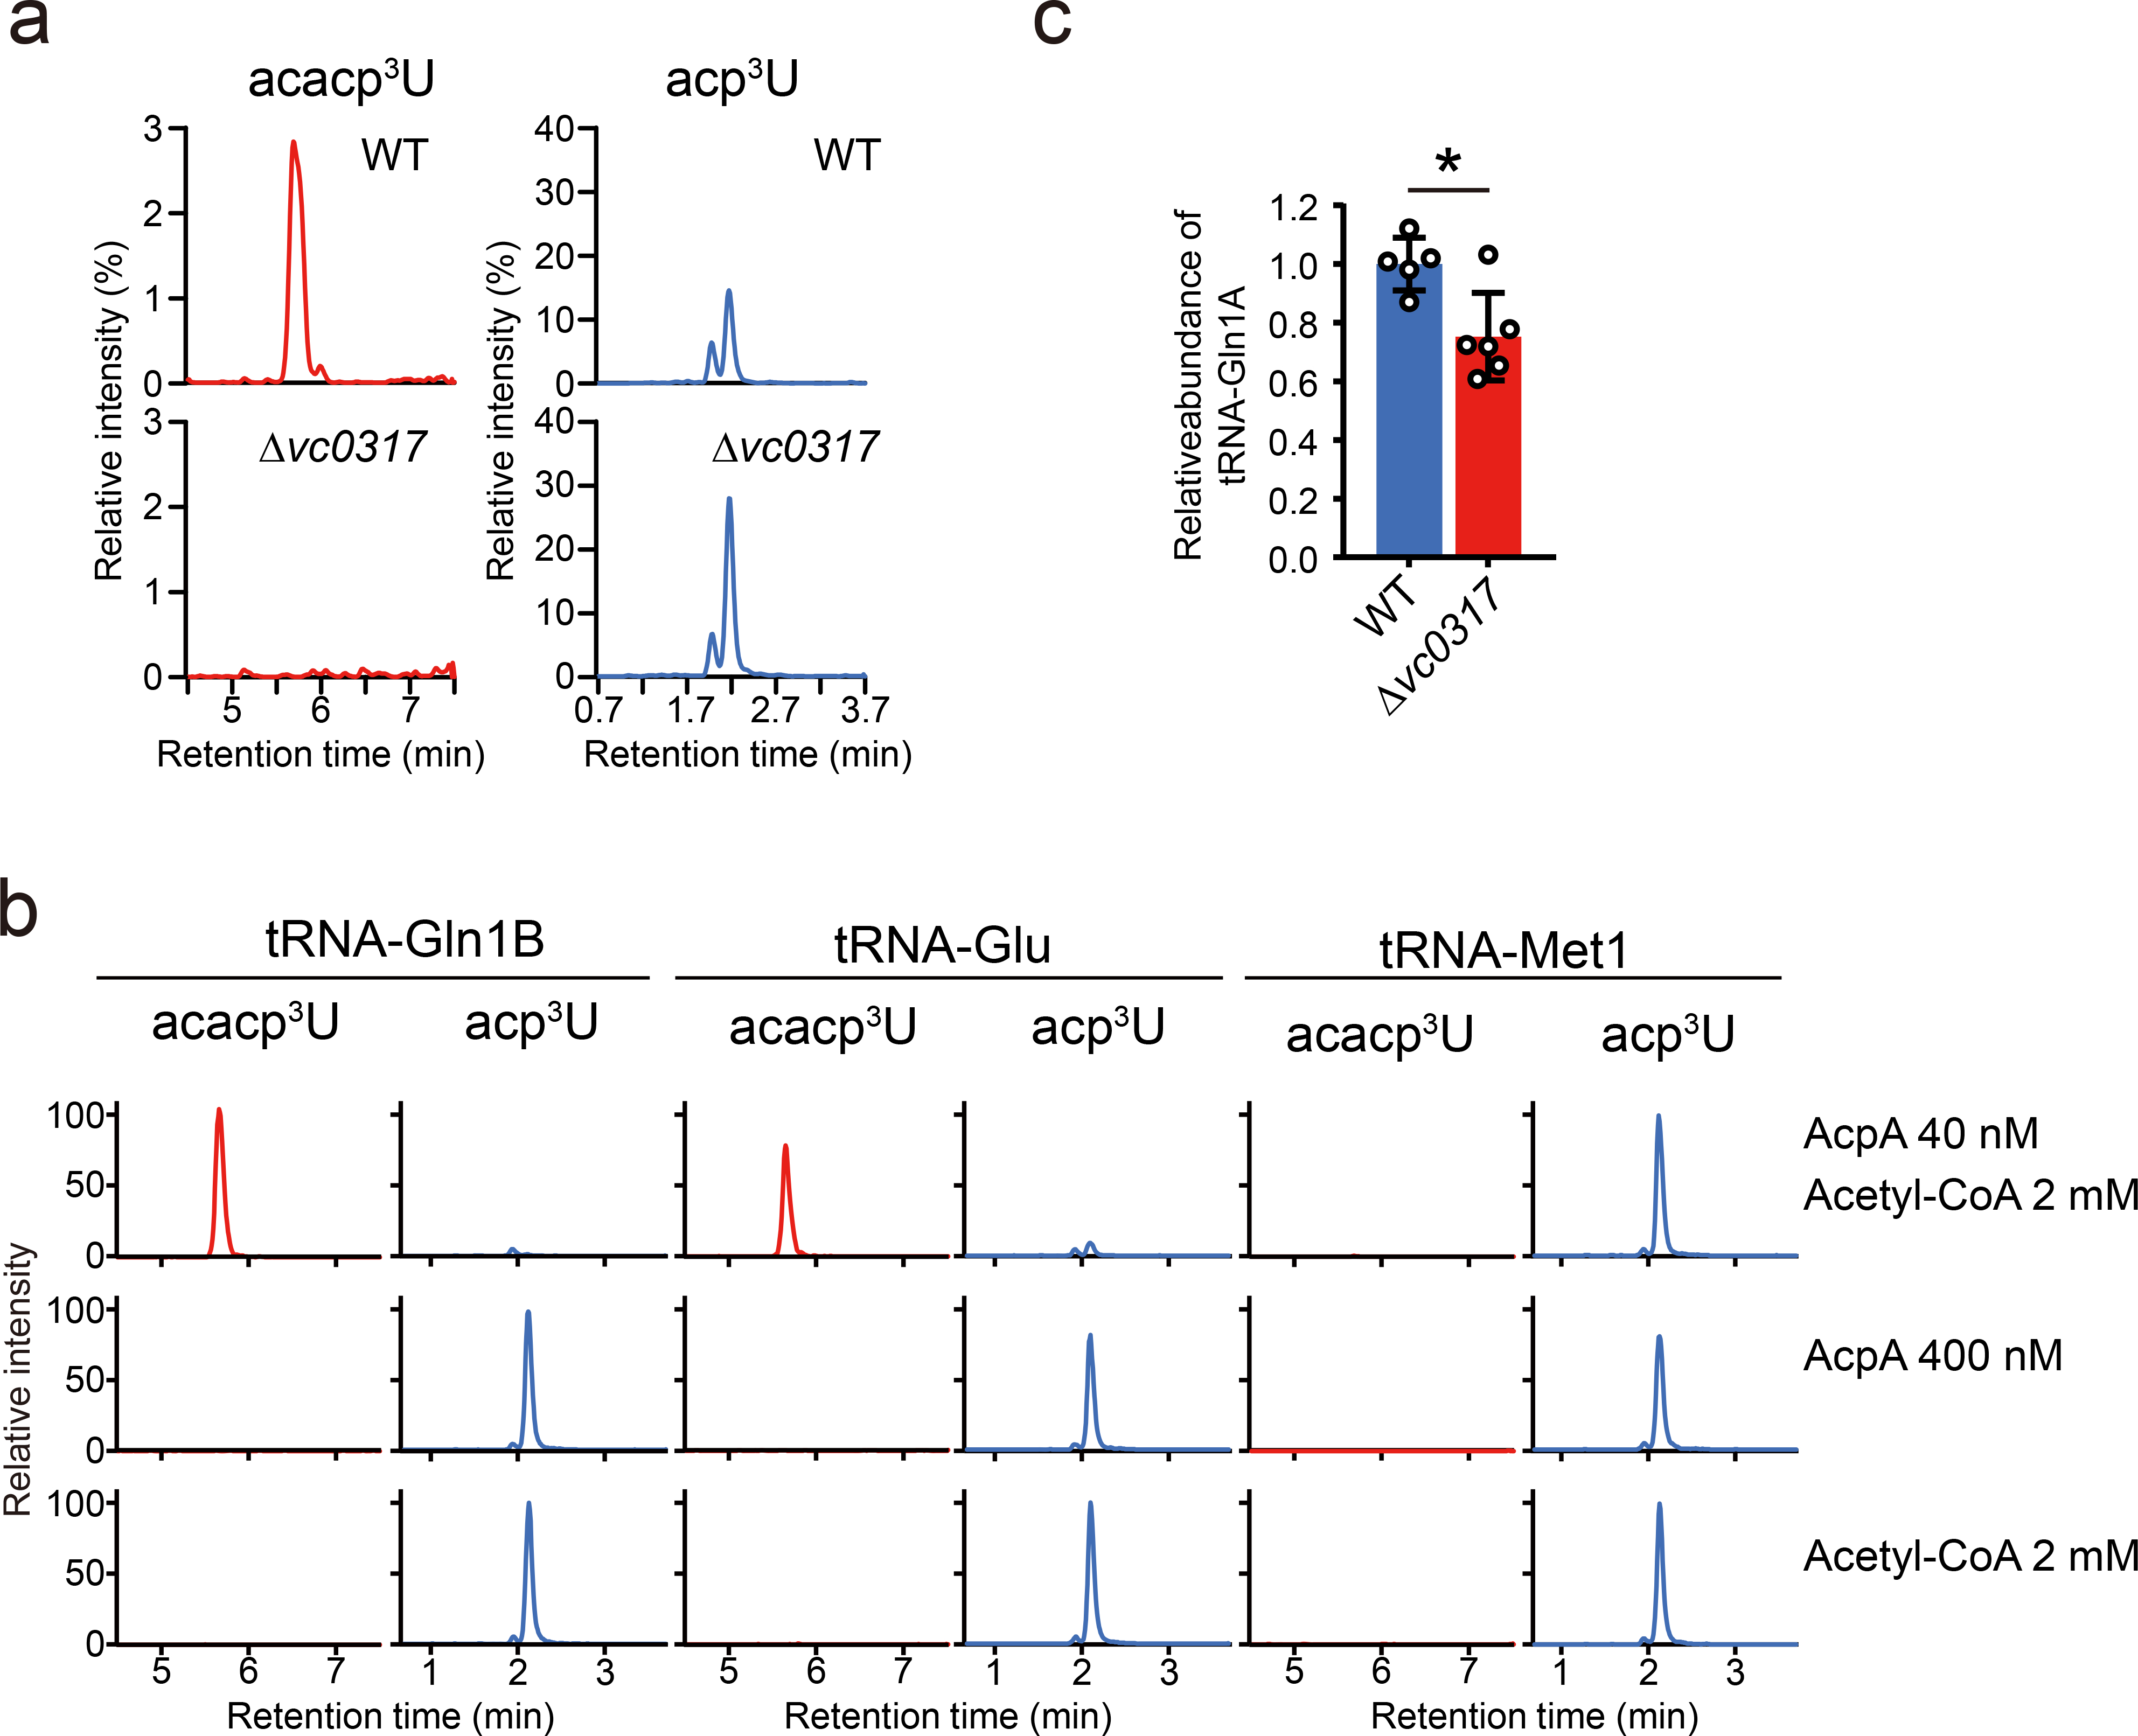
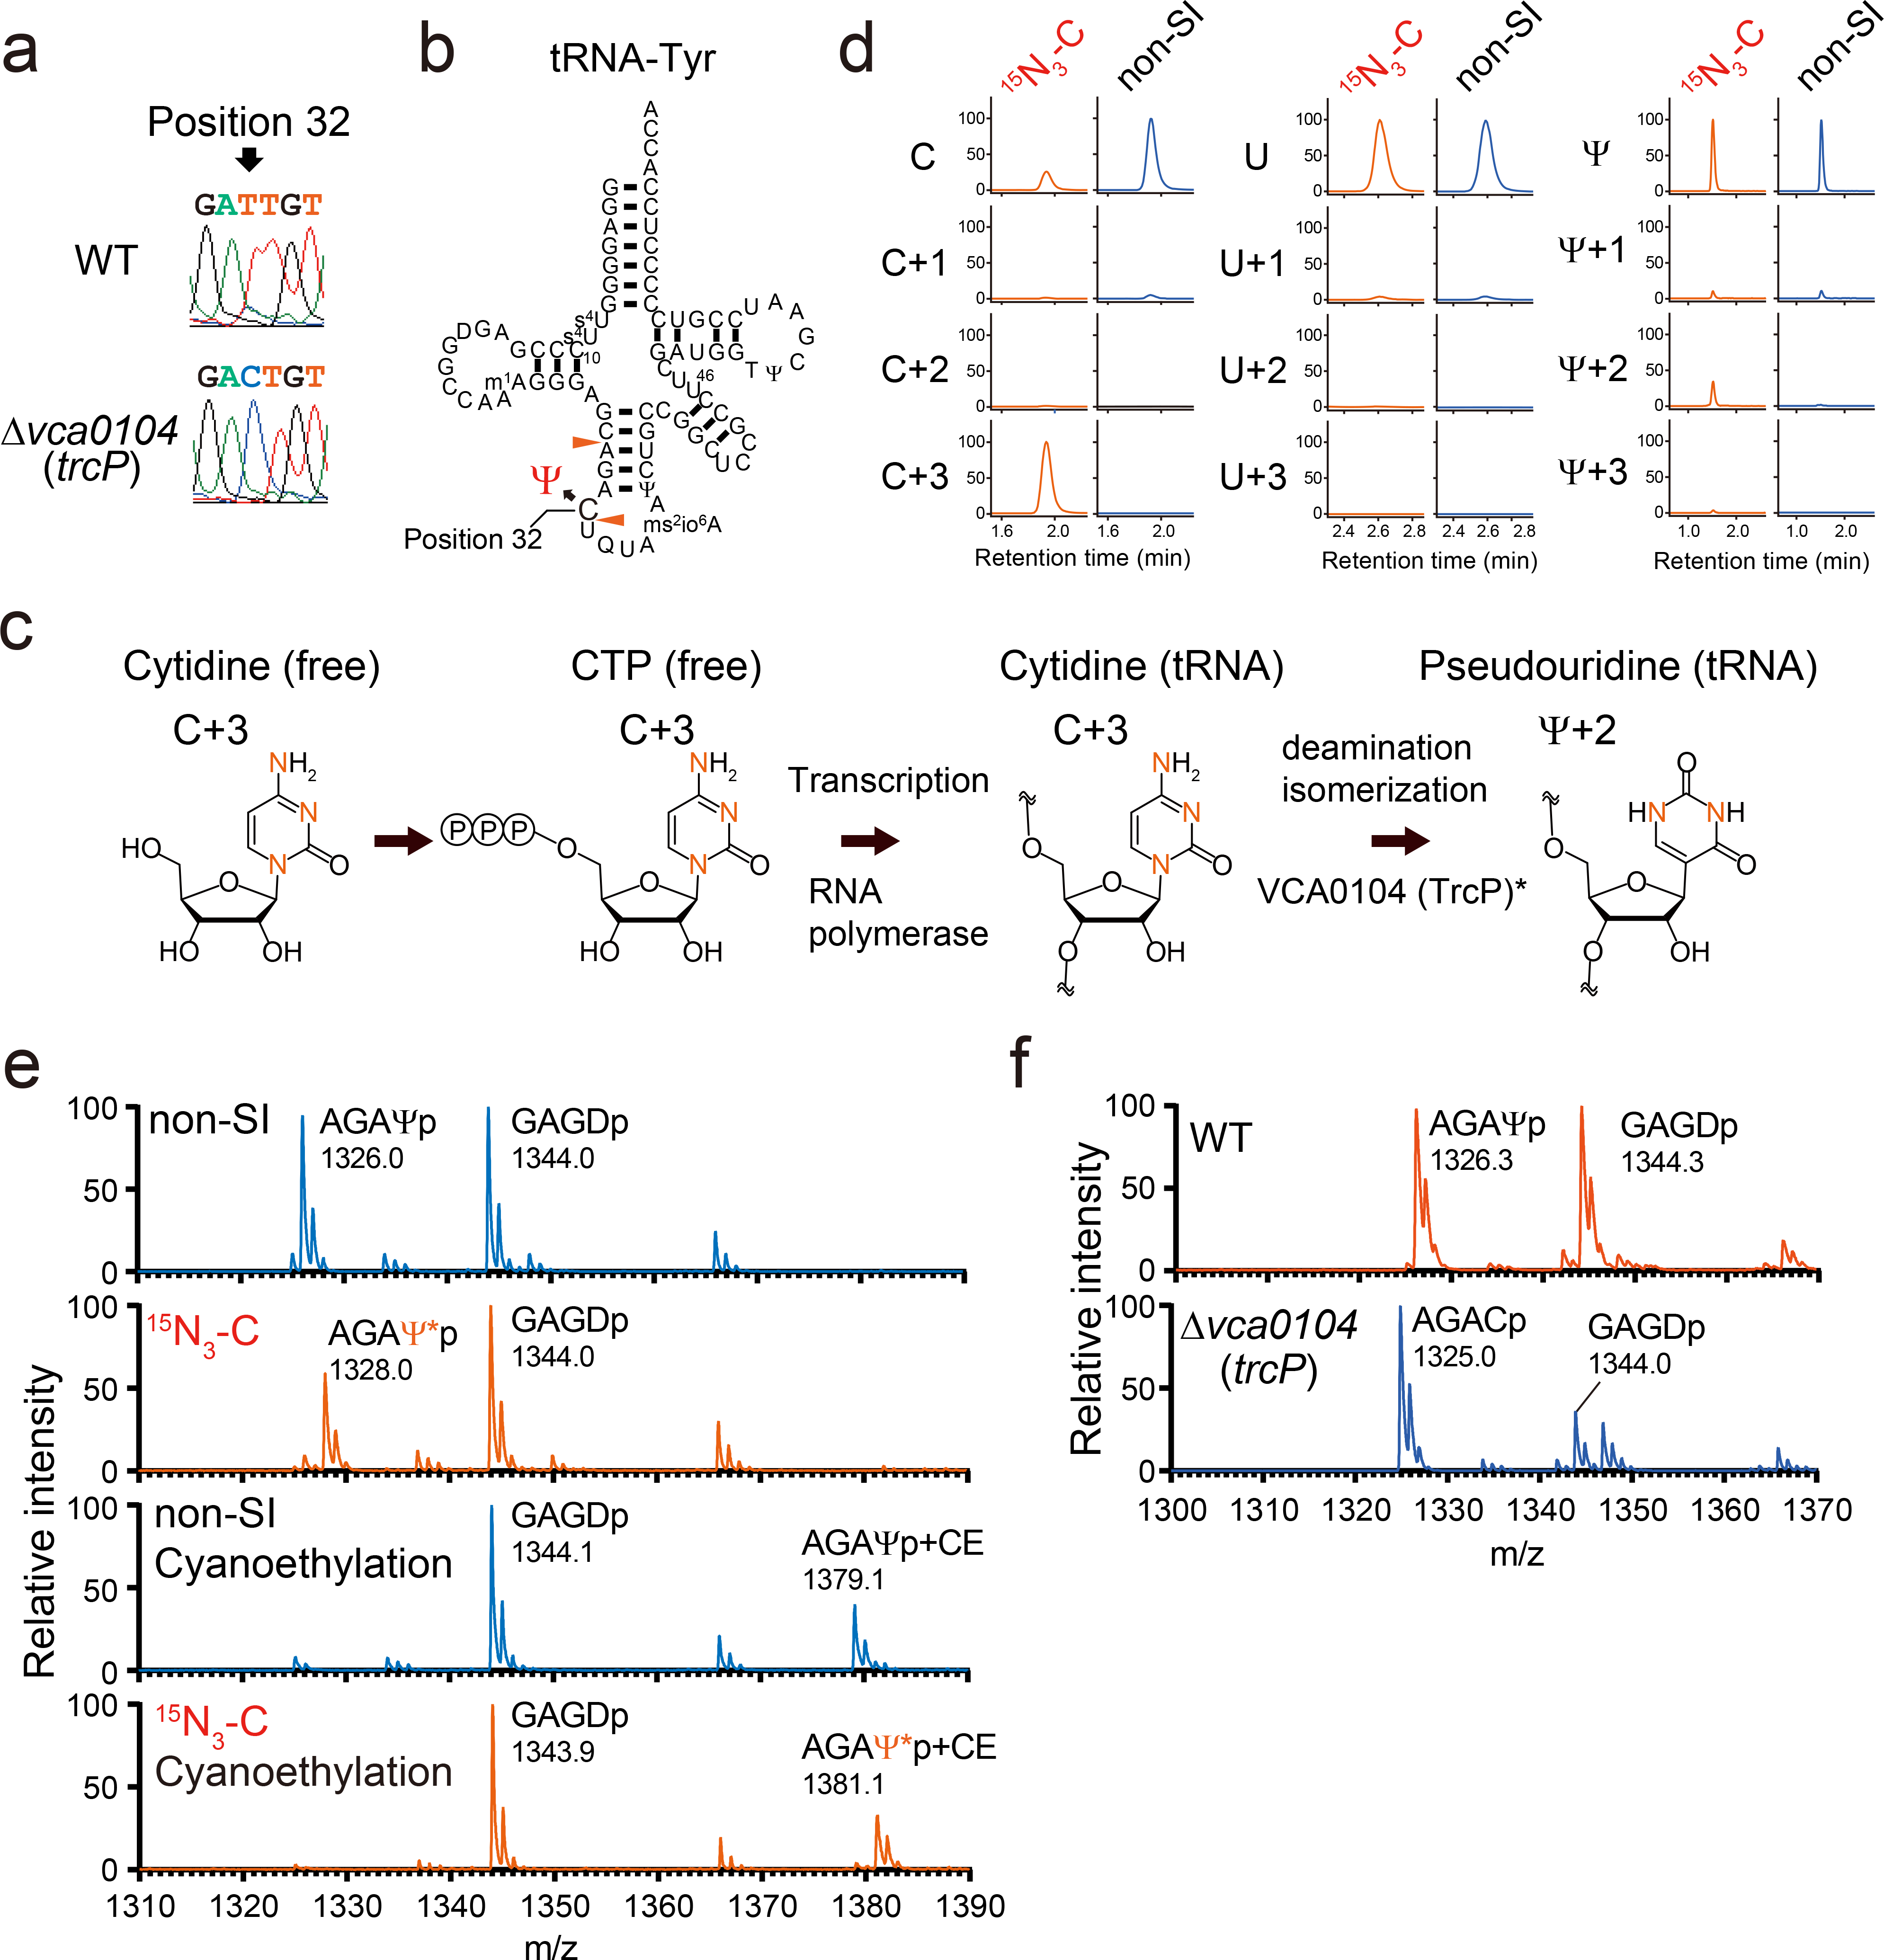
Chemical modifications of the nucleosides that comprise transfer RNAs are diverse. However, the structure, location and extent of modifications have been systematically charted in very few organisms. Here, we describe an approach in which rapid prediction of modified sites through reverse transcription-derived signatures in high-throughput transfer RNA-sequencing (tRNA-seq) data is coupled with identification of tRNA modifications through RNA mass spectrometry. Comparative tRNA-seq enabled prediction of several Vibrio cholerae modifications that are absent from Escherichia coli and also revealed the effects of various environmental conditions on V. cholerae tRNA modification. Through RNA mass spectrometric analyses, we showed that two of the V. cholerae-specific reverse transcription signatures reflected the presence of a new modification (acetylated acp3U (acacp3U)), while the other results from C-to-Ψ RNA editing, a process not described before. These findings demonstrate the utility of this approach for rapid surveillance of tRNA modification profiles and environmental control of tRNA modification.


Conflict of interest statement

Competing Financial Interests Statement

The authors declare no competing interests.

Figures

Extended Data Fig. 1
Extended Data Fig. 1. tRNA-seq profiling of tRNA modifications in E. coli.
a, Example of the analysis of reverse transcription derived signatures in tRNA-seq data. The bars in the left panel represent mapped read depth with the left side and right side corresponding to the 5’ and 3’ end of tRNAs, respectively. Bars in which the misincorporation frequency is less than 1% are colored in grey; additional colors are shown at sites where there are higher levels of misincorporation (red corresponds to U, blue, C, orange, G and yellow, A). The significance of the misincorporation signal at position 10 is not known. Several drops in depth around sites of known modifications are also apparent (e.g. DD at positions 16, 17); however, the correspondence between the decrease in read depth and sites of modification is less precise than with nucleotide misincorporation. The right panel shows the secondary structure of tRNA-Lys. The structures of some of the modifications that lead to reverse transcription derived signatures are shown in lower panels. b, Heatmaps of the frequency of misincorporation (left) and stop (termination) of reverse transcription (right) signals in tRNA from stationary phase E. coli. Each row represents an individual tRNA and each column represents a position within tRNAs. The modifications are assigned based on the reference tRNA sequences (Supplementary Data 1 and Supplementary Table 1). The color keys are indicated upper right of the heatmaps. Representative data from one replicate is shown.
Extended Data Fig. 2
Extended Data Fig. 2. Validation of modifications inferred from RT-derived signals by nucleoside analysis.
Nucleosides from purified tRNAs were analyzed by mass spectrometry. The area values of a nucleoside was normalized using the signal of T, which is present in all tRNA species as an internal control. The values relative to the maximum number across the nine tRNA species are shown in the heatmap. Glu-Q was not observed in any tRNAs. The presence of most of the modifications were also confirmed in the fragment analyses except for Q in tRNA-Tyr, s2C and I in tRNA-Arg2A, and Ψ. This experiment was performed once.
Extended Data Fig. 3
Extended Data Fig. 3. Validation of modifications inferred from RT-derived signals using mutant V. cholerae strains.
a, Heatmap of misincorporation frequency at position 8 in V. cholerae tRNAs. Most of the misincorporation signals, except for tRNA-Ser1 and tRNA-Gln1A, are eliminated in the ΔthiI strain, consistent with the idea that misincorporation results from the associated modification, s4U. The data for tRNA-Ile2 is not shown (black) because of insufficient read depth (<100 reads). b, Heatmap of misincorporation frequency at position 32 in V. cholerae tRNAs. The signals in tRNAs that are expected to have s2C (tRNA-Arg2A, tRNA-Arg2C, tRNA-Arg3, tRNA-Ser3A, tRNA-Ser3B, and tRNA-Arg4) are eliminated in the ΔttcA strain, whereas the signal in tRNA-Tyr remains due to C to Ψ RNA editing (see Fig 5). The data for tRNA-Ile2 is not shown (black) because of insufficient read depth. c, Heatmap of misincorporation frequency at position 37 in V. cholerae tRNAs. The signals in tRNAs that are expected to have ms2io6A (tRNA-Leu5, tRNA-Phe1, tRNA-Phe2, tRNA-Leu4, tRNA-Trp, tRNA-Cys1, tRNA-Cys2, tRNA-Ser1, and tRNA-Tyr) are eliminated in the ΔmiaA strain, whereas the signals in tRNA species that are predicted to have m1G at position 37 remain. d, Heatmap of misincorporation frequency at position 22 in V. cholerae tRNAs. The signal in tRNA-Tyr was absent in the ΔtrmK strain, suggesting that this signal is derived from m1A. The data for tRNA-Ile2 is not shown (black) because of insufficient read depth. In all panels, representative data from three replicates with similar results for WT and one replicate for knockout strains is shown.
Extended Data Fig. 4
Extended Data Fig. 4. tRNA-seq profiles of log phase (a) and cecal fluid-derived (b) V. cholerae.
Heatmaps of frequency of misincorporation (left) and termination of reverse transcription (right) signals in indicated samples. Types and positions of modifications that are presumed shared with E. coli are shown in black. Positions of V. cholerae-specific signals are indicated in white letters. Representative data from three replicates with similar results is shown.
Extended Data Fig. 5
Extended Data Fig. 5. VC0317 is a candidate acetyltransferase required for acacp3U synthesis
Nucleoside analysis of total tRNAs derived from strains containing transposon insertions in putative acetyltransferases. Relative abundances of acacp3U (A) and acp3U (B), normalized to that of T, are shown. This experiment was performed once.
Extended Data Fig. 6
Extended Data Fig. 6. Nucleoside analysis of tRNA-Tyr from the Δvc1231 strain RNA cultured with stable isotope labeled cytidine (15N3-C) or unlabeled cytidine (non-SI)
The detecting bases are shown on the left of panels. Representative data from two independent experiments with similar results for G, A, and T is shown. Experiments for other nucleosides were performed once.
Extended Data Fig. 7
Extended Data Fig. 7. RNA mass spectrometric analyses of tRNA-Tyr
a, Nucleoside analysis detecting D, Ψ, m1A, T, oQ, Q, s4U, ms2io6A. The peak heights between different nucleosides are not comparable. Representative data from two independent experiments with similar results is shown. b, Fragment analyses of RNase T1 (left) and RNase A (right) digests. The fragments with or without modifications are shown in red and black, respectively. Measurement was conducted in positive polarity mode. Representative data from two independent experiments with similar results is shown.
Fig. 1
Fig. 1. Profiling tRNA modifications in V. cholerae through tRNA-seq
a, Heatmaps of frequency of misincorporation (Left) and termination of reverse transcription (Right) in a representative tRNA sample isolated from stationary phase V. cholerae (total of three independent samples). Positions of modifications bearing greater than 5 % of misincorporation or termination frequency are shown; the identity of presumably shared modifications with E. coli are indicated in black and the V. cholerae-specific signals are in white. Single nucleotide polymorphisms (SNPs) shown are based on whole genome sequence of C6706 (Supplementary Figure 6) are also indicated in black. The color keys are shown above the upper right corners of the heatmaps. b, Schematic secondary structure of V. cholerae tRNAs showing sites of predicted tRNA modifications deciphered from tRNA-seq data in (a). The positions and tRNA species in which the RT-derived signatures are commonly observed in E. coli are shown in yellow. The positions and tRNA species that have V. cholerae specific signals are colored coded as green (found in other organisms but not E. coli), light blue (novel modifications/or editing) or pink (unknown).
Fig. 2
Fig. 2. Frequency of acp3U is dependent upon growth phase.
a, Heatmap of misincorporation frequency at position 47 in V. cholerae tRNAs isolated from indicated growth condition. Signal intensities in each condition are the average values of three independent tRNA-seq datasets. tRNA species that showed significant differences between signals from log and stationary phase cells are colored in red (multiple two-sided t-test, FDR < 10 %). b, Secondary structure of tRNA-Met1 with modifications. RNase T1 cleavage sites that form the fragment containing position 47 are indicated by red arrowheads. c, MALDI analysis (positive polarity mode measurements) of RNase A digests of tRNA-Met1 isolated from log and stationary phase samples. Nucleosides at position 47 are colored in red. Representative data from two independent experiments with similar results is shown. d, Heatmap of misincorporation frequency at position 47 in E. coli tRNAs isolated from indicated. growth condition. Signal intensities in each condition represent the values of one tRNA-seq dataset.
Fig. 3
Fig. 3. Structure of acacp3U.
a, b, RNA mass spectrometric analyses of V. cholerae tRNA-Glu (Upper) and tRNA-Gln1B (Lower). Representative data from two independent experiments with similar results is shown. a, nucleoside analyses by multiple reaction monitoring (MRM), showing the presence of a nucleoside whose mass is 387 (N387), found in neutral loss scans, along with known modifications (denoted in black). The peak heights between different nucleosides are not comparable. b, Fragment analyses of RNase A digests. The fragments containing N387 are colored in red. c, The secondary structures of tRNA-Glu (Top) and tRNA-Gln1B (Bottom) containing modifications based on nucleoside and fragment analyses. d, Schematic of potential derivation of acacp3U (N387) from acp3U. e, MS/MS analyses of acp3U (upper panels) and N387 (lower panels). Left panels show the structures and fragmentation patterns of the acp3U and acacp3U base components. Right panels show the product ion spectra of acp3U in tRNA-Met1 (precursor ion; m/z 346) and N387 in tRNA-Glu (precursor ion; m/z 388). Fragment ions observed in acp3U are colored in blue and N387 specific fragment ions are colored in red. Representative spectra from at least two independent MS/MS scans with similar results are shown. f, LC/MS analysis of nucleosides of tRNA-Gln1B and chemically synthesized acacp3U. The panels show N387 derived from 20 ng tRNA-Gln1B (Top), 1.2 pmol chemical synthesized acacp3U (Middle), and a co-injected sample (Bottom). Representative data of two independent experiments with similar results in tRNA-Gln1B and acacp3U and one experiment in co-injection is shown. g, MS/MS analysis of chemically synthesized acacp3U (precursor ion; m/z 388). Fragment ions observed in acp3U are colored in blue and acacp3U specific fragment ions are colored in red. Representative data from at least three independent MS/MS scans with similar results are shown.
Fig. 4
Fig. 4. Biogenesis and function of acacp3U
a, vc0317 is required for the acetylation of acacp3U. Nucleoside analyses detecting acacp3U (left) and acp3U (right) in WT (upper) and Δvc0317 (lower) strains. Representative data from two independent experiments with similar results is shown. b, In vitro acetylation of acp3U modified tRNAs to acacp3U. The indicated tRNAs were isolated from Δvc0317 and incubated with the AcpA protein and/or acetyl-CoA and then nucleoside analysis was carried out. The left panels show the detected acp3U and the right panels show the detected acacp3U in the indicated tRNA species. Representative data from two independent experiments with similar results for tRNA-Gln1B and tRNA-Glu and one experiment for tRNA-Met1 is shown. c, Abundance of tRNA-Gln1A in WT and Δvc0317 strains. tRNAs were quantified through northern blotting and normalized with the abundance of 5S rRNA; and average values, SD, and individual biological replicates (WT; n = 5 and Δvc0317; n = 6) are shown as bars, error bars and circles, respectively (*p = 0.01, two-sided t-test).
Fig. 5
Fig. 5. Cytidine at position 32 in tRNA-Tyr undergoes C-to-Ψ RNA editing.
a, Sanger sequencing of cDNA of tRNA-Tyr from WT (top) and Δvca0104 (bottom) strains. Position 32 is indicated by the arrow. b, Secondary structure of tRNA-Tyr with modifications based on fragment analyses (Extended Data Fig. 2 and Extended Data Fig. 7 and Supplementary Data 3). RNase A cleavage sites that form the fragment containing position 32 are indicated by red arrowheads. c, Proposed scheme for the conversion of the isotope labeled cytidine to pseudouridine. Red letters represent 15N. *VCA0104 (TrcP) is required for the C-to-Ψ conversion, but its sufficiency for the process has not been established. d, Nucleoside analysis of purified tRNA-Tyr isolated from Δvc1231, a strain deficient in the conversion of cytidine to uridine and cultured with 15N3-cytidine (15N3-C) or cytidine (non-SI). The detected nucleosides are indicated on the left. Representative data from two independent experiments with similar results is shown. e, Fragment analyses of an oligo protected portion (position 10 to 46) of tRNA-Tyr isolated from the Δvc1231 strain grown with either cytidine (non-SI) or stable isotope labeled cytidine (15N3-C). In the lower two panels, oligo protected portions were incubated with acrylonitrile, which specifically cyanoethylates (CE) pseudouridine, increasing its mass by 53 Da. m/z values of detected peaks with assigned fragment sequences are shown. Ψ* indicates stable isotope labeled Ψ, which is 2Da heavier. The MALDI analyses were conducted in negative polarity mode. Representative data from two independent experiments with similar results is shown. f, Fragment analysis of an oligo protected portion (position 10 to 46) of tRNA-Tyr from WT and Δvca0104 (trcP) strains. m/z values of detected peaks with assigned fragment sequences are shown. The MALDI analyses were conducted in negative polarity mode. Representative data from two independent experiments with similar results is shown.

References

    1. Gingold H et al. A dual program for translation regulation in cellular proliferation and differentiation. Cell 158, 1281–1292, doi:10.1016/j.cell.2014.08.011 (2014). - DOI - PubMed
    1. Goodarzi H et al. Modulated Expression of Specific tRNAs Drives Gene Expression and Cancer Progression. Cell 165, 1416–1427, doi:10.1016/j.cell.2016.05.046 (2016). - DOI - PMC - PubMed
    1. Hanada T et al. CLP1 links tRNA metabolism to progressive motor-neuron loss. Nature 495, 474–480, doi:10.1038/nature11923 (2013). - DOI - PMC - PubMed
    1. Machnicka MA et al. MODOMICS: a database of RNA modification pathways--2013 update. Nucleic Acids Res 41, D262–267, doi:10.1093/nar/gks1007 (2013). - DOI - PMC - PubMed
    1. Ontiveros RJ, Stoute J & Liu KF The chemical diversity of RNA modifications. Biochem J 476, 1227–1245, doi:10.1042/BCJ20180445 (2019). - DOI - PMC - PubMed

Methods-only references

    1. Millet YA et al. Insights into Vibrio cholerae intestinal colonization from monitoring fluorescently labeled bacteria. PLoS Pathog 10, e1004405, doi:10.1371/journal.ppat.1004405 (2014). - DOI - PMC - PubMed
    1. Donnenberg MS & Kaper JB Construction of an eae deletion mutant of enteropathogenic Escherichia coli by using a positive-selection suicide vector. Infect Immun 59, 4310–4317 (1991). - PMC - PubMed
    1. Langmead B, Trapnell C, Pop M & Salzberg SL Ultrafast and memory-efficient alignment of short DNA sequences to the human genome. Genome Biol 10, R25, doi:10.1186/gb-2009-10-3-r25 (2009). - DOI - PMC - PubMed
    1. Griffey RH et al. 15N-labeled tRNA. Identification of 4-thiouridine in Escherichia coli tRNASer1 and tRNATyr2 by 1H-15N two-dimensional NMR spectroscopy. J Biol Chem 261, 12074–12078 (1986). - PubMed
    1. Horie N et al. Modified nucleosides in the first positions of the anticodons of tRNA(Leu)4 and tRNA(Leu)5 from Escherichia coli. Biochemistry 38, 207–217, doi:10.1021/bi981865g (1999). - DOI - PubMed

Publication types