

The myocardial phenotype of Fabry disease pre-hypertrophy and pre-detectable storage
- PMID: 32514567
- PMCID: PMC8219366
- DOI: 10.1093/ehjci/jeaa101
The myocardial phenotype of Fabry disease pre-hypertrophy and pre-detectable storage
Abstract
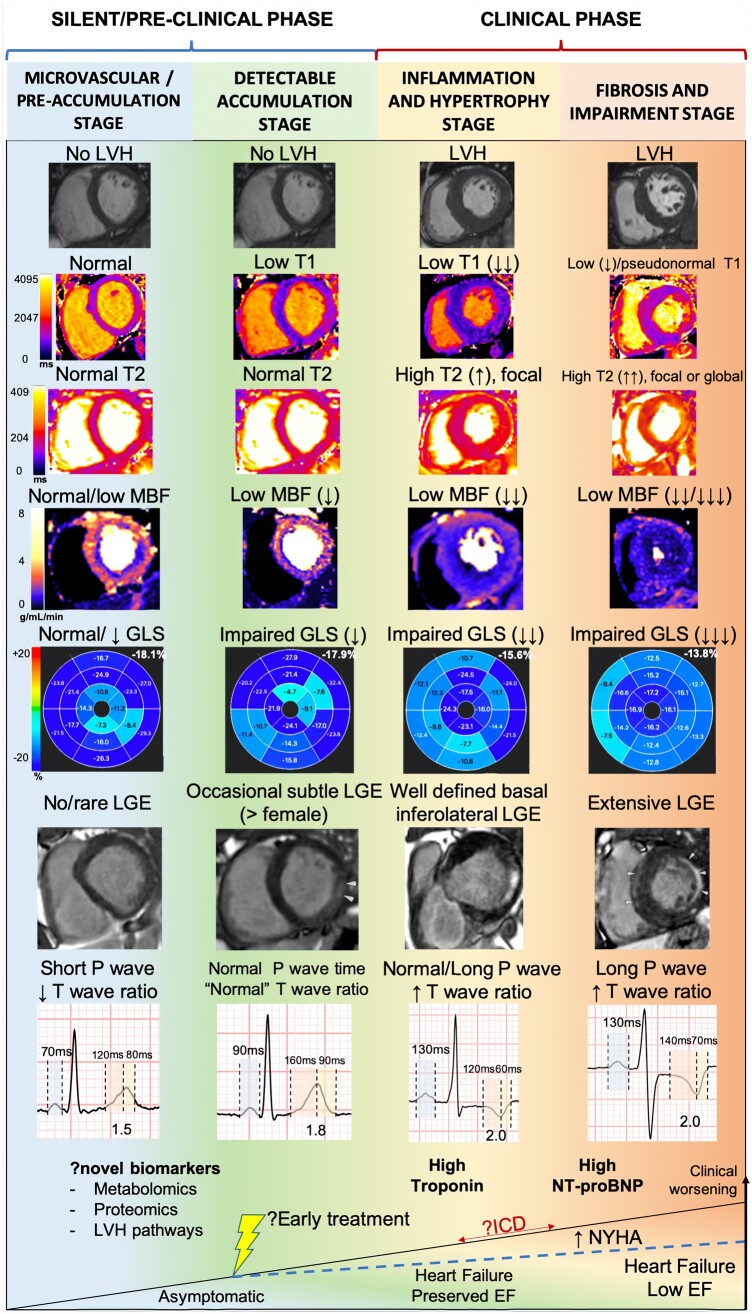
Aims: Cardiac involvement in Fabry disease (FD) occurs prior to left ventricular hypertrophy (LVH) and is characterized by low myocardial native T1 with sphingolipid storage reflected by cardiovascular magnetic resonance (CMR) and electrocardiogram (ECG) changes. We hypothesize that a pre-storage myocardial phenotype might occur even earlier, prior to T1 lowering.
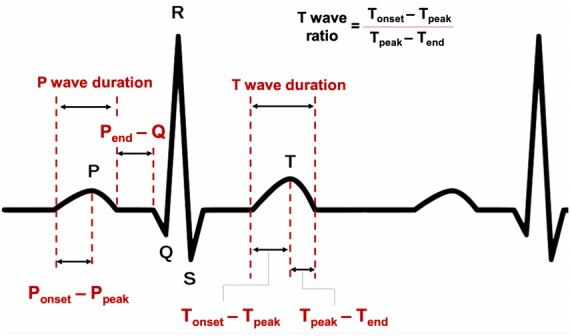
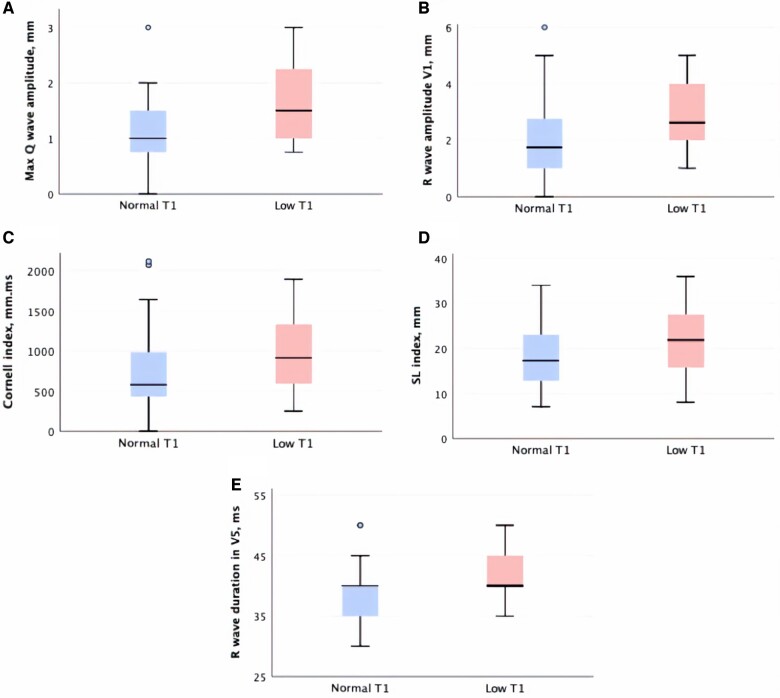
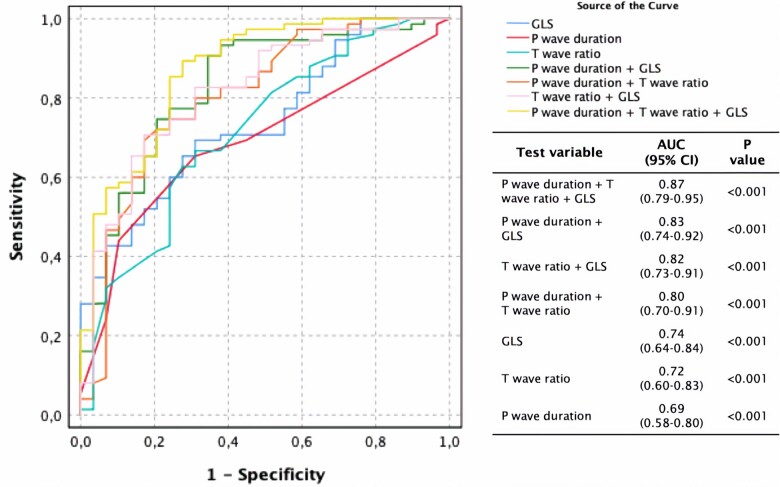
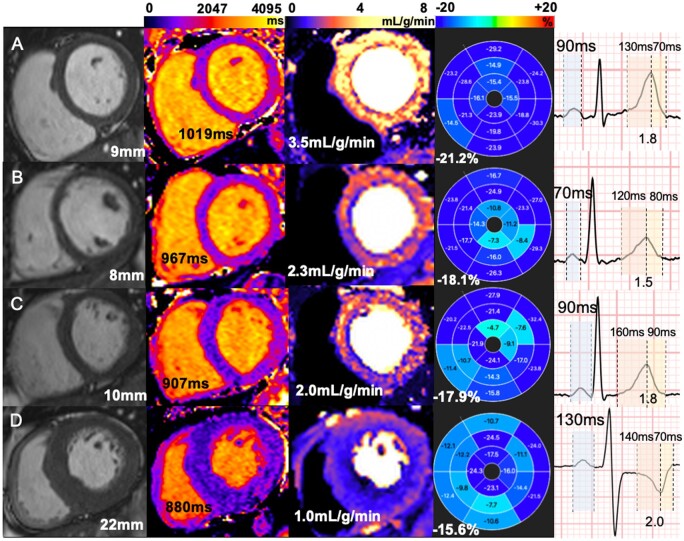
Methods and results: FD patients and age-, sex-, and heart rate-matched healthy controls underwent same-day ECG with advanced analysis and multiparametric CMR [cines, global longitudinal strain (GLS), T1 and T2 mapping, stress perfusion (myocardial blood flow, MBF), and late gadolinium enhancement (LGE)]. One hundred and fourteen Fabry patients (46 ± 13 years, 61% female) and 76 controls (49 ± 15 years, 50% female) were included. In pre-LVH FD (n = 72, 63%), a low T1 (n = 32/72, 44%) was associated with a constellation of ECG and functional abnormalities compared to normal T1 FD patients and controls. However, pre-LVH FD with normal T1 (n = 40/72, 56%) also had abnormalities compared to controls: reduced GLS (-18 ± 2 vs. -20 ± 2%, P < 0.001), microvascular changes (lower MBF 2.5 ± 0.7 vs. 3.0 ± 0.8 mL/g/min, P = 0.028), subtle T2 elevation (50 ± 4 vs. 48 ± 2 ms, P = 0.027), and limited LGE (%LGE 0.3 ± 1.1 vs. 0%, P = 0.004). ECG abnormalities included shorter P-wave duration (88 ± 12 vs. 94 ± 15 ms, P = 0.010) and T-wave peak time (Tonset - Tpeak; 104 ± 28 vs. 115 ± 20 ms, P = 0.015), resulting in a more symmetric T wave with lower T-wave time ratio (Tonset - Tpeak)/(Tpeak - Tend) (1.5 ± 0.4 vs. 1.8 ± 0.4, P < 0.001) compared to controls.
Conclusion: FD has a measurable myocardial phenotype pre-LVH and pre-detectable myocyte storage with microvascular dysfunction, subtly impaired GLS and altered atrial depolarization and ventricular repolarization intervals.
Keywords: Fabry disease; cardiovascular magnetic resonance; electrocardiogram; global longitudinal strain; microvascular dysfunction.
© The Author(s) 2020. Published by Oxford University Press on behalf of the European Society of Cardiology.
Figures
References
-
- Mehta A, Hughes DA.. Fabry disease. In Adam MP, Ardinger HH, Pagon RA, Wallace SE, Bean LJ, Stephens K. et al.. (eds). GeneReviews® [Internet]. Seattle, WA: University of Washington, Seattle; 1993. http://www.ncbi.nlm.nih.gov/books/NBK1292/ (10 July 2019, date last accessed).
-
- Baig S, Edward NC, Kotecha D, Liu B, Nordin S, Kozor R. et al.. Ventricular arrhythmia and sudden cardiac death in Fabry disease: a systematic review of risk factors in clinical practice. Europace 2017;20:f153–61. - PubMed
-
- Nordin S, Kozor R, Medina-Menacho K, Abdel-Gadir A, Baig S, Sado DM. et al.. Proposed stages of myocardial phenotype development in Fabry disease. JACC Cardiovasc Imaging 2018;12:1673–83. - PubMed
-
- Weidemann F, Niemann M, Breunig F, Herrmann S, Beer M, StöRk S. et al.. Long-term effects of enzyme replacement therapy on Fabry cardiomyopathy: evidence for a better outcome with early treatment. Circulation 2009;119:524–9. - PubMed
-
- Eng CM, Guffon N, Wilcox WR, Germain DP, Lee P, Waldek S. et al.. Safety and efficacy of recombinant human alpha-galactosidase A replacement therapy in Fabry’s disease. N Engl J Med 2001;345:9–16. - PubMed
MeSH terms
Substances
Grants and funding
LinkOut - more resources
Full Text Sources
Medical
Miscellaneous
