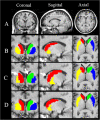
Regional SUV quantification in hybrid PET/MR, a comparison of two atlas-based automatic brain segmentation methods
- PMID: 32514906
- PMCID: PMC7280441
- DOI: 10.1186/s13550-020-00648-8
Regional SUV quantification in hybrid PET/MR, a comparison of two atlas-based automatic brain segmentation methods
Abstract
Background: Quantitative analysis of brain positron-emission tomography (PET) depends on structural segmentation, which can be time-consuming and operator-dependent when performed manually. Previous automatic segmentation usually registered subjects' images onto an atlas template (defined as RSIAT here) for group analysis, which changed the individuals' images and probably affected regional PET segmentation. In contrast, we could register atlas template to subjects' images (RATSI), which created an individual atlas template and may be more accurate for PET segmentation. We segmented two representative brain areas in twenty Parkinson disease (PD) and eight multiple system atrophy (MSA) patients performed in hybrid positron-emission tomography/magnetic resonance imaging (PET/MR). The segmentation accuracy was evaluated using the Dice coefficient (DC) and Hausdorff distance (HD), and the standardized uptake value (SUV) measurements of these two automatic segmentation methods were compared, using manual segmentation as a reference.
Results: The DC of RATSI increased, and the HD decreased significantly (P < 0.05) compared with the RSIAT in PD, while the results of one-way analysis of variance (ANOVA) found no significant differences in the SUVmean and SUVmax among the two automatic and the manual segmentation methods. Further, RATSI was used to compare regional differences in cerebral metabolism pattern between PD and MSA patients. The SUVmean in the segmented cerebellar gray matter for the MSA group was significantly lower compared with the PD group (P < 0.05), which is consistent with previous reports.
Conclusion: The RATSI was more accurate for the caudate nucleus and putamen automatic segmentation and can be used for regional PET analysis in hybrid PET/MR.
Keywords: Atlas-based; Multiple system atrophy; PET/MR; Parkinson disease; Segmentation.
Conflict of interest statement
The authors declare that they have no conflict of interest. All procedures performed in studies were approved by the Ethics Committee of Tongji Medical College, Huazhong University of Science and Technology. Informed consent was obtained from all individual participants included in the study.
The authors declare that they have no competing interests.
Figures


Similar articles
-
A multi-atlas based method for automated anatomical Macaca fascicularis brain MRI segmentation and PET kinetic extraction.Neuroimage. 2013 Aug 15;77:26-43. doi: 10.1016/j.neuroimage.2013.03.029. Epub 2013 Mar 26. Neuroimage. 2013. PMID: 23537938
-
A multi-atlas based method for automated anatomical rat brain MRI segmentation and extraction of PET activity.PLoS One. 2014 Oct 17;9(10):e109113. doi: 10.1371/journal.pone.0109113. eCollection 2014. PLoS One. 2014. PMID: 25330005 Free PMC article.
-
Automated segmentation of the sacro-iliac joints, posterior spinal joints and discovertebral units on low-dose computed tomography for Na[18F]F PET lesion detection in spondyloarthritis patients.EJNMMI Phys. 2025 Mar 10;12(1):20. doi: 10.1186/s40658-025-00734-7. EJNMMI Phys. 2025. PMID: 40059265 Free PMC article.
-
Quantitative analysis of MRI-guided attenuation correction techniques in time-of-flight brain PET/MRI.Neuroimage. 2016 Apr 15;130:123-133. doi: 10.1016/j.neuroimage.2016.01.060. Epub 2016 Feb 4. Neuroimage. 2016. PMID: 26853602
-
Semi-automated segmentation methods of SSTR PET for dosimetry prediction in refractory meningioma patients treated by SSTR-targeted peptide receptor radionuclide therapy.Eur Radiol. 2023 Oct;33(10):7089-7098. doi: 10.1007/s00330-023-09697-8. Epub 2023 May 6. Eur Radiol. 2023. PMID: 37148355 Review.
Cited by
-
Individualized diagnosis of Parkinson's disease based on multivariate magnetic resonance imaging radiomics and clinical indexes.Front Aging Neurosci. 2025 Jan 31;17:1504733. doi: 10.3389/fnagi.2025.1504733. eCollection 2025. Front Aging Neurosci. 2025. PMID: 39957801 Free PMC article.
-
18F-APN-1607 Tau Positron Emission Tomography Imaging for Evaluating Disease Progression in Alzheimer's Disease.Front Aging Neurosci. 2022 Feb 10;13:789054. doi: 10.3389/fnagi.2021.789054. eCollection 2021. Front Aging Neurosci. 2022. PMID: 35221982 Free PMC article.
-
Identification of Parkinson's disease and multiple system atrophy using multimodal PET/MRI radiomics.Eur Radiol. 2024 Jan;34(1):662-672. doi: 10.1007/s00330-023-10003-9. Epub 2023 Aug 3. Eur Radiol. 2024. PMID: 37535155
-
A Baboon Brain Atlas for Magnetic Resonance Imaging and Positron Emission Tomography Image Analysis.Front Neuroanat. 2022 Jan 14;15:778769. doi: 10.3389/fnana.2021.778769. eCollection 2021. Front Neuroanat. 2022. PMID: 35095430 Free PMC article.
-
Deep learning segmentation results in precise delineation of the putamen in multiple system atrophy.Eur Radiol. 2023 Oct;33(10):7160-7167. doi: 10.1007/s00330-023-09665-2. Epub 2023 May 1. Eur Radiol. 2023. PMID: 37121929 Free PMC article.
References
-
- Besson FL, Lebon V, Durand E. What are we expecting from PET/MRI? Med Médecine Nucléaire. 2016;40(1):31–40. doi: 10.1016/j.mednuc.2016.01.002. - DOI
Grants and funding
LinkOut - more resources
Full Text Sources
Other Literature Sources

