. 2020 Aug;33(8):e4343.
doi: 10.1002/nbm.4343. Epub 2020 Jun 8.

Metabolite cycled liver 1 H MRS on a 7 T parallel transmit system

Affiliations

Metabolite cycled liver 1 H MRS on a 7 T parallel transmit system

Aline Xavier et al. NMR Biomed. 2020 Aug.

Abstract

Introduction: Single-voxel 1 H MRS in body applications often suffers from respiratory and other motion induced phase and frequency shifts, which lead to incoherent averaging and hence to suboptimal results.

Methods: Here we show the application of metabolite cycling (MC) for liver STEAM-localized 1 H MRS on a 7 T parallel transmit system, using eight transmit-receive fractionated dipole antennas with 16 additional, integrated receive loops. MC-STEAM measurements were made in six healthy, lean subjects and compared with STEAM measurements using VAPOR water suppression. Measurements were performed during free breathing and during synchronized breathing, for which the subjects did breathe in between the MRS acquisitions. Both intra-session repeatability and inter-session reproducibility of liver lipid quantification with MC-STEAM and VAPOR-STEAM were determined.

Results: The preserved water signal in MC-STEAM allowed for robust phase and frequency correction of individual acquisitions before averaging, which resulted in in vivo liver spectra that were of equal quality when measurements were made with free breathing or synchronized breathing. Intra-session repeatability and inter-session reproducibility of liver lipid quantification were better for MC-STEAM than for VAPOR-STEAM. This may also be explained by the more robust phase and frequency correction of the individual MC-STEAM acquisitions as compared with the VAPOR-STEAM acquisitions, for which the low-signal-to-noise ratio lipid signals had to be used for the corrections.

Conclusion: Non-water-suppressed MC-STEAM on a 7 T system with parallel transmit is a promising approach for 1 H MRS applications in the body that are affected by motion, such as in the liver, and yields better repeatability and reproducibility compared with water-suppressed measurements.

Keywords: 7 T; MRS; lipid composition; lipids; liver; metabolite cycling; parallel transmit; ultra-high field.


Figures

FIGURE 1
FIGURE 1
A‐C, Spectra acquired in a phantom containing a lipid emulsion using a conventional STEAM sequence and VAPOR water suppression (A), and MC‐STEAM without water suppression (B, C). In B the offsets for the MC pulses were +175 Hz and −175 Hz from the water frequency for odd and even scans, respectively (in vivo settings), while in C the offsets for the MC pulses were +50 Hz and −50 Hz from the water frequency. All major lipid peaks in the upfield spectrum can be clearly identified within all spectra and are indicated in A. The olefinic lipid signal at 5.3 ppm, however, can only be distinguished clearly in the VAPOR‐STEAM spectrum (A) and in the MC‐STEAM spectrum with the smaller offsets (C; olefinic lipid signal has a 180° phase difference with the upfield signals). D, Lipid methylene signal amplitude (expressed as a percentage of the water signal) as a function of the B 1 + used for the MC pulses. A B 1 + above 15 μT in the ROI is required for complete inversion of the methylene signal and thus to obtain the full signal amplitude in the difference spectra
FIGURE 2
FIGURE 2
A, Example of voxel (15 × 15 × 20 mm3) positioning in the liver depicted on a transversal Dixon scan. The red voxel indicates the voxel positioning for the water frequency, while the white voxel indicates the shifted voxel for the lipid methylene frequency. B‐D, in vivo liver spectra from the voxel indicated in A using MC‐STEAM: B, the downfield (blue) and upfield (red) inverted spectra (after individual phase correction, coil combination, frequency alignment and averaging); C, the sum of the downfield and upfield inverted spectra (water spectrum); D, the difference (metabolite) spectrum
FIGURE 3
FIGURE 3
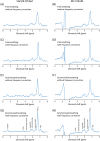
Comparison of in vivo liver spectra from the voxel indicated in Figure 2A (all in the same subject) recorded using VAPOR‐STEAM (left column) and MC‐STEAM (right column) with free breathing reconstructed without frequency correction (A, B) and with frequency correction (C, D), and with synchronized breathing reconstructed without frequency correction (E, F) and with frequency correction (G, H). Peak assignments are indicated in G and H. The peak at 3.22 ppm (not present in the phantom spectra) originates from tCho. Liver lipid content for this subject averaged over the different spectra was 2.3%
FIGURE 4
FIGURE 4
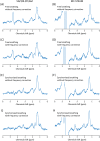
Comparison of in vivo liver spectra from another subject, with a lower liver lipid content as compared with the subject in Figure 3, recorded using VAPOR‐STEAM (left column) and MC‐STEAM (right column) with free breathing reconstructed without frequency correction (A, B) and with frequency correction (C, D), and with synchronized breathing reconstructed without frequency correction (E, F) and with frequency correction (G, H). Liver lipid content for this subject averaged over the different spectra was 1.0%
FIGURE 5
FIGURE 5
Average SNR for the lipid methylene peak (1.30 ppm) (A) and linewidth (LW) of the fitted lipid peaks (B) for the six subjects for both scan sessions from acquisitions with VAPOR‐STEAM with free breathing (light blue) and synchronized breathing (dark blue), and MC‐STEAM with free breathing (light green) and synchronized breathing (dark green). Results are shown for data reconstructed without (uniform colored bars) and with (colored bars with black hatches) frequency correction. For both SNR and LW, there was no significant difference between VAPOR and MC, but there was a significant interaction between the effects of reconstruction without and with frequency correction and measurements with free and synchronized breathing (p = 0.04 and p = 0.03 for SNR and LW, respectively). The significance signs in the figure represent the results of the Bonferroni corrected post‐hoc tests for VAPOR and MC data taken together. *p < 0.05, **p < 0.01, both independent of measurement method (VAPOR or MC)
FIGURE 6
FIGURE 6
Bland‐Altman plots for comparisons of liver lipid content between scans with free breathing and synchronized breathing acquired with VAPOR‐STEAM (A) and MC‐STEAM (B) and for comparisons between scans with VAPOR‐STEAM and MC‐STEAM obtained with free breathing (C) and synchronized breathing (D). Spectra were reconstructed with frequency correction. The solid black line shows the bias from zero (thin black line) and the dashed black lines mark ±1.96 SD. A, Absolute bias = 0.04%, CR = 0.42%, CV = 14.1%; B, absolute bias = 0.05%, CR = 0.25%, CV = 8.3%; C, absolute bias = 0.02%, CR = 0.45%, CV = 14.4%; D, absolute bias = 0.06%, CR = 0.60%, CV = 20.0%
FIGURE 7
FIGURE 7
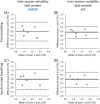
Bland‐Altman plots of intra‐session variability in liver lipid content measured with VAPOR‐STEAM (A) and MC‐STEAM (B) with synchronized breathing. Spectra were reconstructed with frequency correction. The solid black line shows the bias from zero (thin black line) and the dashed black lines mark ±1.96 SD. A, Absolute bias = 0.06%, CR = 0.36%, CV = 12.2%; B, absolute bias = 0.00%, CR = 0.29%, CV = 9.6%
FIGURE 8
FIGURE 8
Bland‐Altman plots of inter‐session variability in liver lipid content measured with VAPOR‐STEAM (A, C) and MC‐STEAM (B, D) with free breathing (A, B) and synchronized breathing (C, D). Spectra were reconstructed with frequency correction. The solid black line shows the bias from zero (thin black line) and the dashed black lines mark ±1.96 SD. A, Absolute bias = 0.01%, CR = 1.11%, CV = 37.1%; B, absolute bias = 0.12%, CR = 0.68%, CV = 23.2%; C, absolute bias = 0.06%, CR = 1.15%, CV = 39.5%; D, absolute bias = 0.09%, CR = 0.90%, CV = 29.4%
FIGURE 9
FIGURE 9
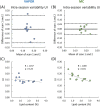
A, B, Bland‐Altman plots of intra‐session variability in UI of hepatic lipids measured with VAPOR‐STEAM (A) and MC‐STEAM (B) with synchronized breathing. Spectra were reconstructed with frequency correction. The solid black line shows the bias from zero (thin black line) and the dashed black lines mark ±1.96 SD. A, Absolute bias = 0.00, CR = 0.15, CV = 51.7%; B, absolute bias = 0.00, CR = 0.06, CV = 17.2%. C, D, UI versus liver lipid content for the six subjects for both scan sessions. Data were measured with VAPOR‐STEAM (C) and MC‐STEAM (D) with synchronized breathing, and results of the two measurements acquired during one session were averaged. With MC‐STEAM a significant negative correlation was observed, while the data acquired with VAPOR‐STEAM did not indicate a clear relationship

References

    1. Angulo P. Nonalcoholic fatty liver disease. N Engl J Med. 2002;346(16):1221‐1231. - PubMed
    1. Cohen JC, Horton JD, Hobbs HH. Human fatty liver disease: old questions and new insights. Science. 2011;332(6037):1519‐1523. - PMC - PubMed
    1. Araya J, Rodrigo R, Videla LA, et al. Increase in long‐chain polyunsaturated fatty acid n − 6/n − 3 ratio in relation to hepatic steatosis in patients with non‐alcoholic fatty liver disease. Clin Sci. 2004;106(6):635‐643. - PubMed
    1. Elizondo A, Araya J, Rodrigo R, et al. Polyunsaturated fatty acid pattern in liver and erythrocyte phospholipids from obese patients. Obesity. 2007;15(1):24‐31. - PubMed
    1. Puri P, Baillie RA, Wiest MM, et al. A lipidomic analysis of nonalcoholic fatty liver disease. Hepatology. 2007;46(4):1081‐1090. - PubMed

Publication types

LinkOut - more resources