. 2020 Jun 9:9:e55526.
doi: 10.7554/eLife.55526.

Delineating the early transcriptional specification of the mammalian trachea and esophagus

Affiliations

Delineating the early transcriptional specification of the mammalian trachea and esophagus

Akela Kuwahara et al. Elife. .

Abstract

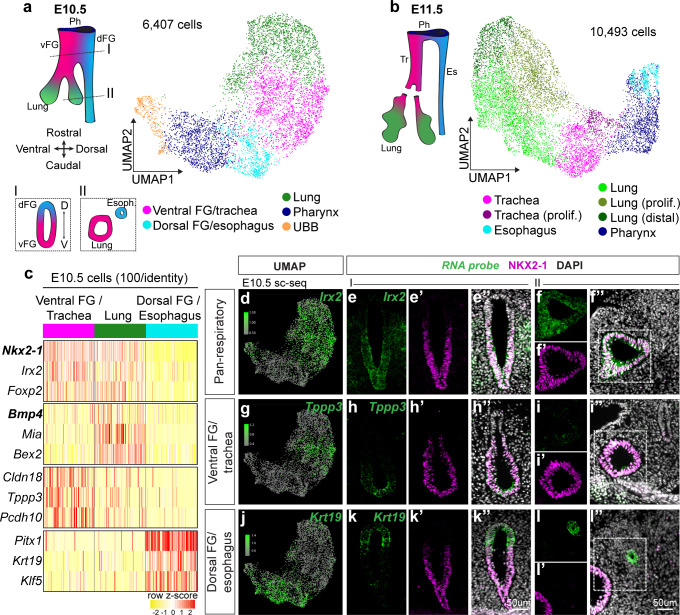
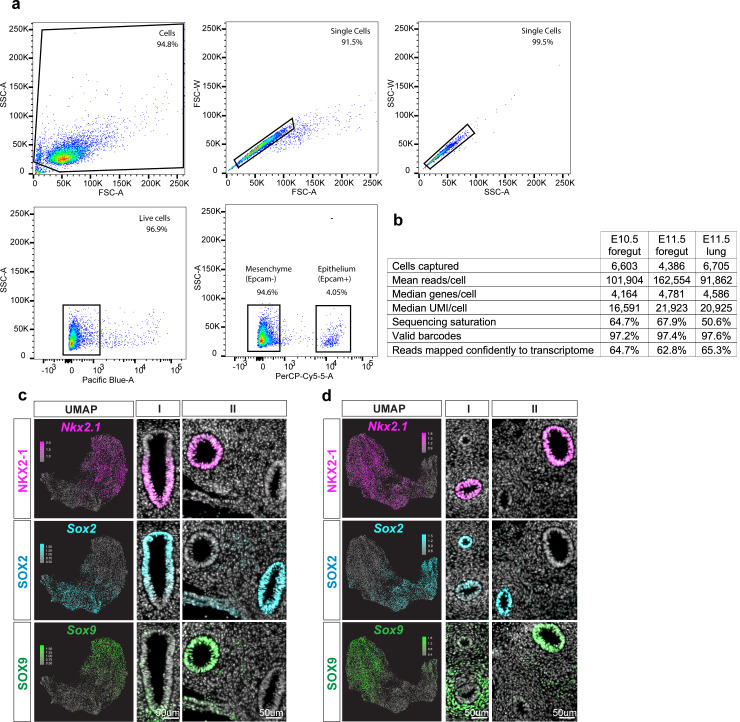
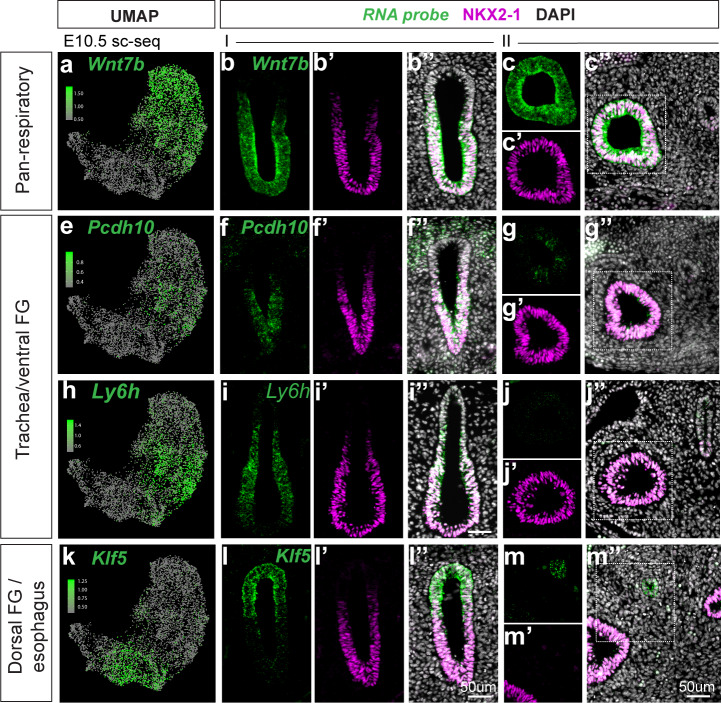
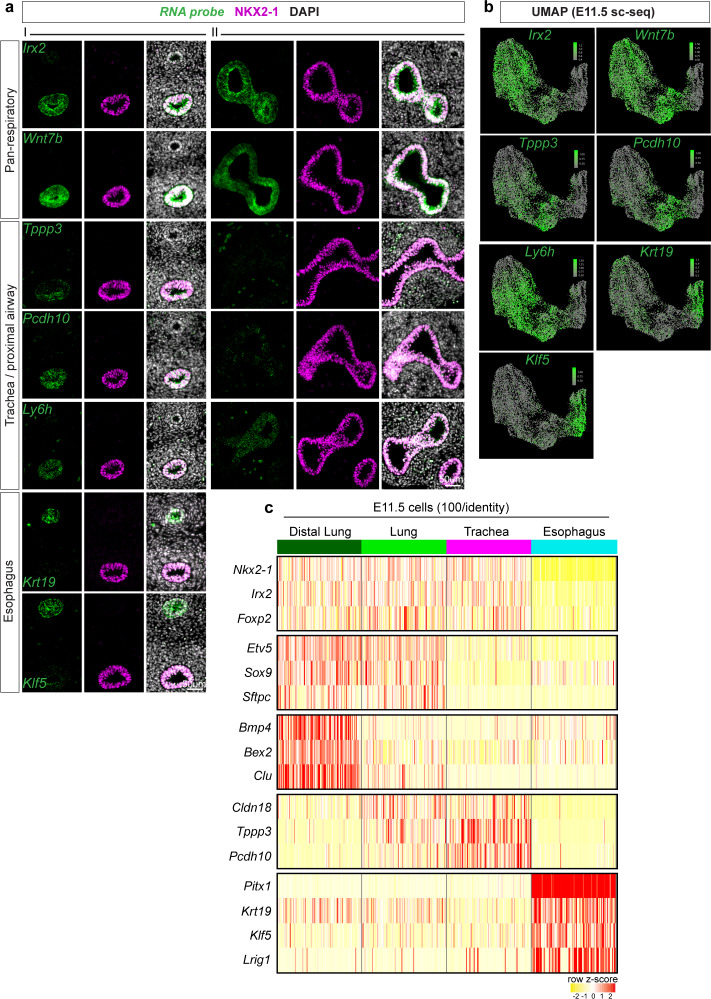
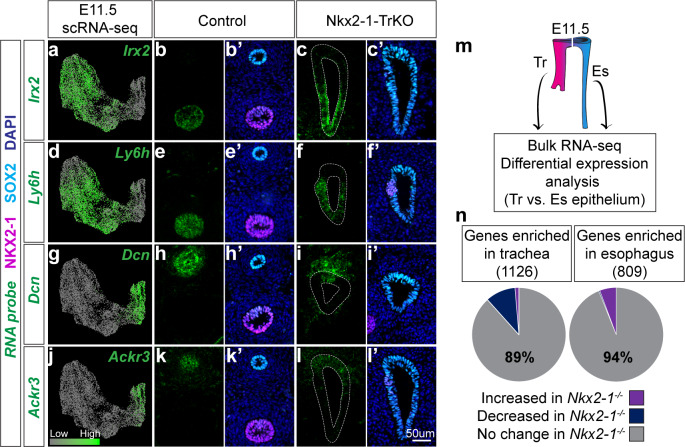
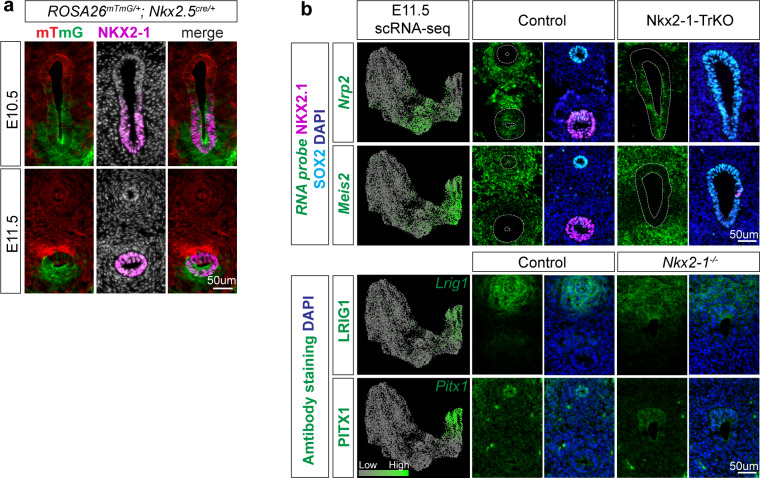
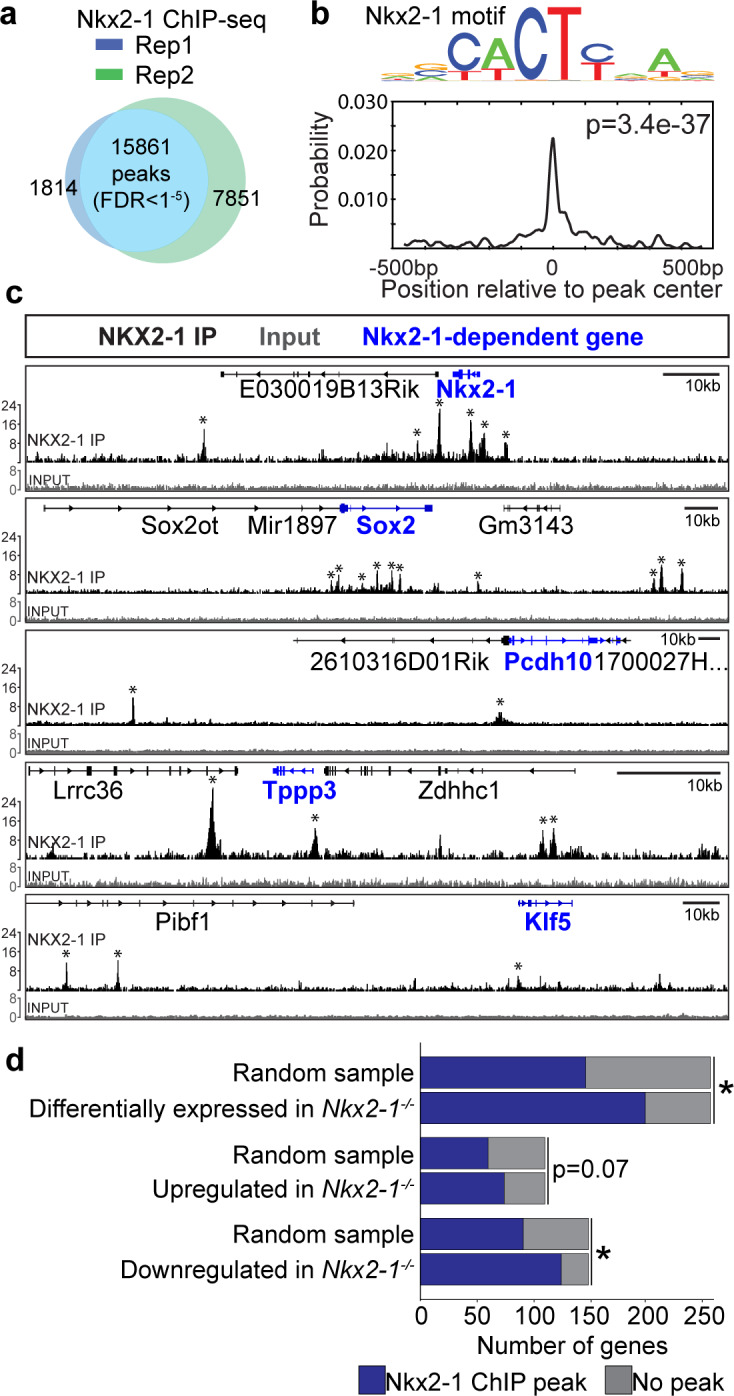
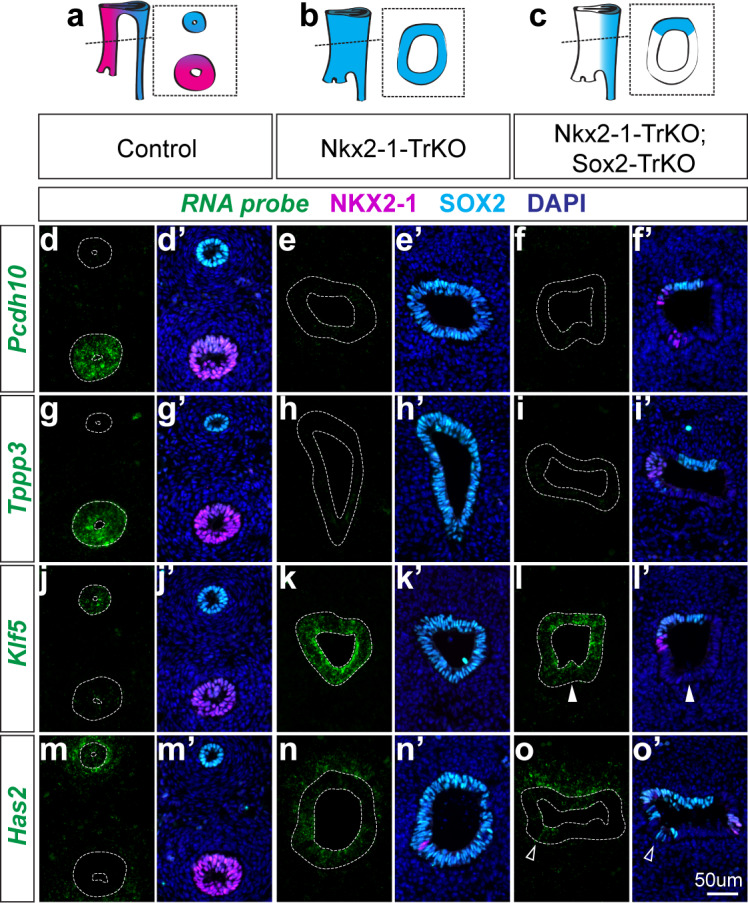
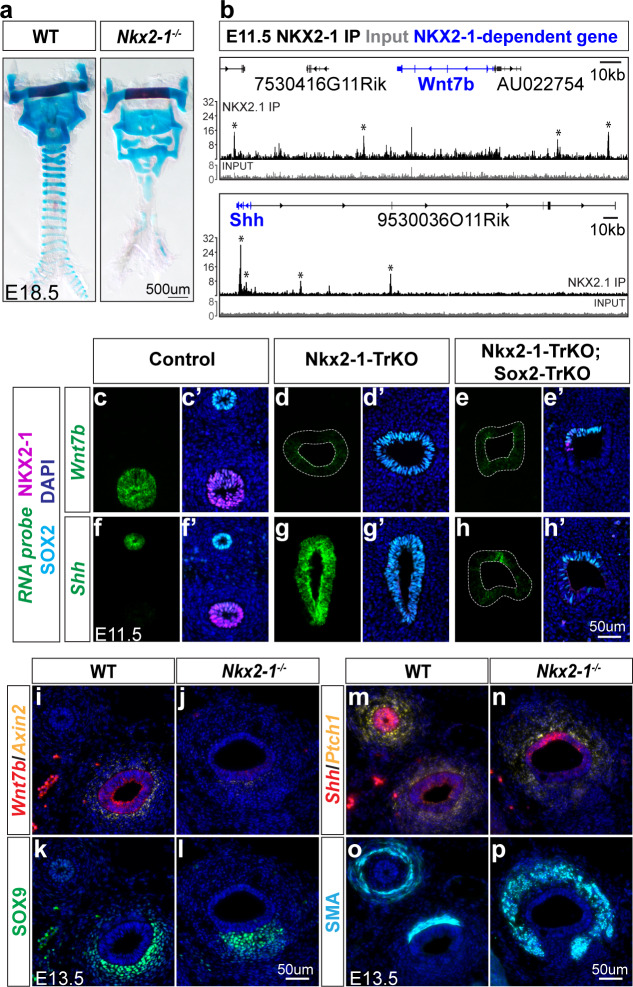
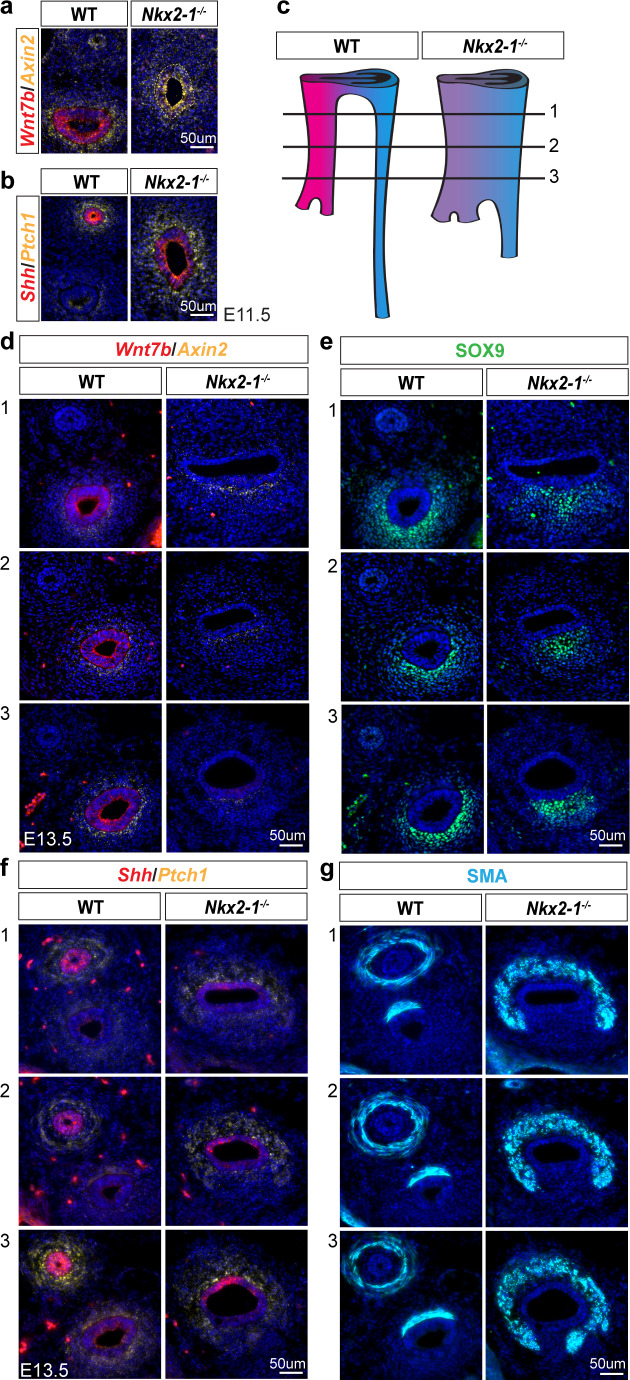
The genome-scale transcriptional programs that specify the mammalian trachea and esophagus are unknown. Though NKX2-1 and SOX2 are hypothesized to be co-repressive master regulators of tracheoesophageal fates, this is untested at a whole transcriptomic scale and their downstream networks remain unidentified. By combining single-cell RNA-sequencing with bulk RNA-sequencing of Nkx2-1 mutants and NKX2-1 ChIP-sequencing in mouse embryos, we delineate the NKX2-1 transcriptional program in tracheoesophageal specification, and discover that the majority of the tracheal and esophageal transcriptome is NKX2-1 independent. To decouple the NKX2-1 transcriptional program from regulation by SOX2, we interrogate the expression of newly-identified tracheal and esophageal markers in Sox2/Nkx2-1 compound mutants. Finally, we discover that NKX2-1 binds directly to Shh and Wnt7b and regulates their expression to control mesenchymal specification to cartilage and smooth muscle, coupling epithelial identity with mesenchymal specification. These findings create a new framework for understanding early tracheoesophageal fate specification at the genome-wide level.

Keywords: Nkx2-1; Sox2; developmental biology; esophagus; genetics; genomics; lung; mouse; trachea; tracheoesophageal fistula.

Plain language summary

The trachea or windpipe is a tube that connects the throat to the lungs, while the esophagus connects the throat to the stomach. The trachea has cartilage rings that help to ensure clear airflow to the lungs, while the esophagus walls are lined with muscles that help to move food to the stomach. Although there are many differences between them, both the trachea and esophagus form from the same group of cells during development. Proteins called transcription factors help to control the formation of different body parts by switching different groups of genes on and off in different subsets of cells. Existing research has suggested that a transcription factor called NKX2.1 drives trachea formation, while another, called SOX2, is important in esophagus formation. An absence of either of these two proteins is thought to be associated with serious birth defects including loss of the trachea or esophagus, or failure of the two to separate fully. How these two transcription factors interact and drive the development of the trachea and esophagus, however, is currently unclear. Kuwahara et al. used mice to study the role of NKX2.1 and SOX2 in the formation of the trachea and esophagus. The findings identify many new genes that are active in the trachea and esophagus and reveal that NKX2.1 is not a master regulator that controls all of the genes involved in trachea formation. However, NKX2.1 does control several key genes, particularly those involved in forming cartilage in the trachea instead of muscle in the esophagus. The investigation also revealed many genes that are not controlled by NKX2.1 suggesting that other, currently unknown, systems play a major role in trachea formation. More work is required to understand the wider genetic regulators involved in differentiating the trachea from the esophagus. The findings in this study will help researchers to understand birth defects in the trachea and esophagus that result from genetic errors. They also reveal information about gene regulation processes that are relevant to the formation of other body parts and in the context of other diseases. In the long term, they could support regenerative medicine to regrow or replace lost or damaged body parts using lab-grown stem cells.


Conflict of interest statement

AK, AL, CC, FL, MP, JB No competing interests declared

Figures

Figure 1.
Figure 1.. Single-cell transcriptomics of the developing foregut epithelium identifies distinct dorsoventral populations.
Dissected, FACS-purified foregut epithelial cells were subjected to droplet-based single-cell RNA sequencing at E10.5 and E11.5. (a) UMAP representation of 6,407 cells identified at E10.5 and (b) 10,493 cells identified at E11.5. Colors represent cell populations identified using shared nearest neighbor clustering. vFG: ventral foregut, dFG: dorsal foregut, Ph: pharynx, UBB: ultimobranchial body, Tr: trachea, Es: esophagus. (c) Heatmap of selected marker gene expression across 100 E10.5 cells each of ventral foregut/trachea, lung, and esophagus/dorsal foregut as identified by scRNA-seq. Selected genes are markers of respiratory, lung, ventral FG/trachea, and dorsal FG/esophagus cells (top to bottom). n = 1 biological replicate/timepoint with 20 pooled embryos at E10.5 and 28 pooled embryos at E11.5. See also: Figure 1—source data 1. (d-l) RNA localization of pan-respiratory marker gene Irx2, ventral FG/trachea marker gene Tppp3, and dorsal FG/esophagus marker gene Krt19 identified from differential expression analysis of cell populations in scRNA-seq data at E10.5. First column shows projection of RNA expression level as determined by scRNA-seq on UMAP. Second-fourth columns show RNA expression of marker gene (green) and NKX2-1 expression (magenta) in the undivided region of E10.5 embryonic foreguts (I) as indicated by the positions of the schematic in a). Last two columns show staining in the lung and distal esophagus (II) as indicated by the positions of the schematic in a). All images were captured at 20X magnification and displayed at the same scale. Scale bar = 50 um.
Figure 1—figure supplement 1.
Figure 1—figure supplement 1.. Quality control metrics and characterization of single-cell RNA sequencing experiments.
(a) Representative gating strategy for FACS of mouse embryonic foreguts. Top row shows gating for single cells, and bottom row shows gating for sytox-negative live cells (left) and epCAM-positive epithelial cells (right). (b) Quality control metrics of scRNA-seq experiments identified with CellRanger. (c–d) Immunofluorescent staining of NKX2-1 (magenta), SOX2 (cyan), and SOX9 (green) in c) E10.5 and d) E11.5 foregut and lung. First column shows UMAP of gene expression level of Nkx2-1, Sox2, and Sox9 as detected by scRNA-seq. Second and third columns represent regions of the foregut along the rostral-caudal axis as depicted in the schematic of Figure 1a and b). Scale bar = 50 um.
Figure 1—figure supplement 2.
Figure 1—figure supplement 2.. Additional cell type-specific markers of dorsoventral populations identified by scRNA-seq at E10.5.
(a-m) RNA localization of additional marker genes Wnt7b, Pcdh10, Ly6h, and Klf5 identified from differential expression analysis of cell populations in scRNA-seq data at E10.5. First column shows projection of RNA expression level as determined by E10.5 scRNA-seq on UMAP. Second-fourth show staining of marker gene RNA expression (green) and NKX2-1 immunofluorescence (magenta) in the unseparated foregut at E10.5 (position I as indicated in schematic of Figure 1a). Last two columns show staining in the lung and distal esophagus (position II as indicated in schematic of Figure 1a). Scale bar = 50um.
Figure 1—figure supplement 3.
Figure 1—figure supplement 3.. Cell type-specific markers of trachea, esophagus, and lung populations identified by scRNA-seq at E11.5.
(a) RNA localization of marker genes identified from differential expression analysis of cell populations in scRNA-seq data at E11.5 with immunofluorescent staining of NKX2-1. First three columns (I) show staining in the trachea and esophagus of an E11.5 embryonic foregut, and last three columns (II) show staining in the lung and distal esophagus. Scale bar = 50um. (b) Projection of RNA expression level as determined by E11.5 scRNA-seq on UMAP. c. Heatmap of selected marker gene expression across 100 E11.5 cells each of distal lung, lung, trachea, and esophagus as identified by scRNA-seq. Selected genes are markers of respiratory, lung, distal lung, trachea, and esophagus cells (top to bottom).
Figure 1—figure supplement 4.
Figure 1—figure supplement 4.. Newly identified esophageal marker genes are more dorsally restricted than SOX2.
RNA localization of esophageal markers genes Klf5, Krt19, and Dcn and protein localization of LRIG1 (green) with immunofluorescent staining of NKX2-1 (magenta) and SOX2 (cyan) in the unseparated foregut of E10.5 embryos. Arrowheads demarcate NKX2-1 expression boundary. Scale=50um.
Figure 1—figure supplement 5.
Figure 1—figure supplement 5.. Validation of pharynx and UBB cluster identities.
(a) RNA localization of pharynx marker gene Foxe1 identified from differential expression analysis of cell populations in scRNA-seq data at E10.5 and E11.5. Top row: RNA-localization of Foxe1 (green) in E10.5 and E11.5 pharynx (Ph). Bottom row: Projection of Foxe1 RNA expression level as determined by E10.5 and E11.5 scRNA-seq on UMAP. (b) RNA localization of ultimobranchial body (UBB) marker gene Crabp1 identified from differential expression analysis of cell populations in scRNA-seq data at E10.5. Top row: RNA-localization of Crabp1 (green) in E10.5 UBB. Scale bar = 50um. Bottom row: Projection of Crabp1 RNA expression level as determined by E10.5 scRNA-seq on UMAP.
Figure 2.
Figure 2.. Transcriptomic analysis of Nkx2-1-/- foreguts reveals NKX2-1 regulated tracheal and esophageal transcriptional programs.
(a) Dissected, FACS-purified epithelium from E11.5 Nkx2-1-/- and WT foreguts was sequenced and analyzed for differential gene expression. 109 genes were increased and 148 genes were decreased in Nkx2-1-/- foreguts compared to WT (DESeq2, log2FC > 0.7, padj < 0.05). Labeled genes show examples of tracheal genes that decrease in Nkx2-1-/- mutants (Tppp3, Pcdh10, Wnt7b, Nkx2-1), and esophageal genes that increase in Nkx2-1-/- mutants (Klf5, Has2, Shh). n = 3 biological replicates with two pooled embryos/replicate. See also: Figure 2—source data 1. (b-c) Combined expression of all genes that increase (b) or decrease (c) in Nkx2-1-/- foreguts as a percentage of all reads in E11.5 scRNA-seq data. Cells are grouped by their assigned cluster and clusters were subsampled to 600 cells/cluster for visualization.
Figure 2—figure supplement 1.
Figure 2—figure supplement 1.. NKX2-1-dependent gene expression in E11.5 scRNA-seq.
(a-b) Combined expression of all genes that increase (a) or decrease (b) in Nkx2-1-/- foreguts as a percentage of all reads in E11.5 scRNA-seq data, projected onto the E11.5 UMAP.
Figure 3.
Figure 3.. Identification of an NKX2-1-independent tracheal and esophageal program.
(a-l) RNA localization of NKX2-1-independent tracheal (Irx2, Ly6h) and esophageal (Dcn, Ackr3) makers identified by scRNA-seq and Nkx2-1-/- mutant RNA-seq data at E11.5. First column shows projection of RNA expression level as determined by scRNA-seq on UMAP. Second-fifth columns show RNA localization (green) in E11.5 control and Nkx2-1-TrKO embryos with immunofluorescent staining of NKX2-1 (magenta) and SOX2 (cyan). 8/8 Nkx2-1-TrKO embryos had TEF phenotype, n = 3 embryos/staining combination. All images were captured at 20X magnification and displayed at the same scale. Scale bar = 50 um. (m) Schematic of experimental procedures for RNA-seq and differential expression analysis of WT trachea and esophagus for comparison with Nkx2-1-/- mutant RNA-seq data. n = 3 biological replicates with four pooled embryos/replicate. See also: Figure 3—source data 1. (n). NKX2-1-dependent genes as a portion of genes enriched in WT trachea (left) and esophagus (right). NKX2-1-independent genes make up 89% of tracheal-enriched genes and 94% of esophageal enriched genes.
Figure 3—figure supplement 1.
Figure 3—figure supplement 1.. Nkx2.5-cre recombination, additional validation of NKX2-1-independent genes.
(a) Lineage trace of Nkx2.5-cre recombination pattern in E10.5 (top) and E11.5 (bottom) foreguts using the ROSA26mTmG reporter (red/green) and NKX2-1 immunofluorescent staining (magenta). (b) RNA localization (green) of additional NKX2-1-independent genes Nrp2 in the trachea (row 1) and Meis2 in the esophagus (row 2) of E11.5 scRNA-seq data (left), E11.5 control embryos (middle) and Nkx2-1-TrKO; Sox2-TrKO embryos (right) with immunofluorescent staining of NKX2-1 (magenta) and SOX2 (cyan). Bottom panel: Protein expression of NKX2-1-independent genes LRIG1 and PITX1 in E11.5 control and Nkx2-1-/- embryos. Scale bar = 50 um.
Figure 4.
Figure 4.. NKX2-1 binds directly to tracheoesophageal genes in the developing foregut.
(a) ChIP-seq for NKX2-1 in E11.5 foreguts identified 15,861 NKX2-1-bound genomic regions (peaks) shared between replicates (FDR < 0.00001). n = 2 biological replicates with 175 pooled embryos/replicate. (b) Motif analysis of NKX2-1 ChIP-seq data shows peaks are enriched for the NKX2-1 motif (p=3.4e-37). (c) NKX2-1 ChIP-seq (black) and input (grey) tracks near loci of select NKX2-1-dependent genes (blue) Nkx2-1, Sox2, Pcdh10, Tppp3, and Klf5 visualized in IGV. Input and NKX2-1 IP tracks are displayed at the same linear scale, as indicated by IGV Data Range on the y-axis. Horizontal scale bar = 10 kb. (d) Genome-wide comparison of NKX2-1 ChIP-seq with Nkx2-1-/- mutant RNA-seq. Overlap of NKX2-1 ChIP-seq associated genes with NKX2-1-dependent genes (top), genes increased in Nkx2-1-/- mutants (middle) and genes decreased in Nkx2-1-/- mutants (lower). *asterisk = p < 0.0001, Fisher’s exact test.
Figure 5.
Figure 5.. NKX2-1 regulates target genes in a SOX2-dependent and independent manner.
(a-c) Schematic of Nkx2-1; Sox2 compound mutant analysis phenotypes and resulting NKX2-1 and SOX2 expression patterns in E11.5 control embryos (a), Nkx2-1-TrKO mutants (b), Nkx2-1-TrKO; Sox2-TrKO mutants (c). 8/8 Nkx2-1-TrKO embryos and 6/6 Nkx2-1-TrKO; Sox2-TrKO embryos examined had TEF phenotype. (d-f) RNA localization of NKX2-1-dependent, SOX2-independent gene Pcdh10 in control (d), Nkx2-1-TrKO (e), and Nkx2-1-TrKO; Sox2-TrKO (f) embryos with immunofluorescent staining of NKX2-1 (magenta) and SOX2 (cyan). (g–i) Tracheal, NKX2-1-dependent, SOX2-independent gene Tppp3. (j–l) Esophageal, NKX2-1-dependent, SOX2-independent gene Klf5. Solid arrowheads indicate SOX2-negative, Klf5-positive ventral cell. (m–o) Esophageal, NKX2-1-dependent, SOX2-dependent gene Has2. Arrowheads indicate ventral SOX2-positive, Has2-positive cells. n = 3 embryos/staining combination. All images were captured at 20X magnification and displayed at the same scale. Scale = 50 um.
Figure 6.
Figure 6.. NKX2-1 regulates mesenchymal specification via Wnt7b and Shh-mediated epithelial-mesenchymal crosstalk.
(a) Alcian blue staining of tracheal cartilage in E18.5 control and Nkx2-1-/- embryos. 3/3 embryos examined exhibited similar cartilage phenotype. (b) ChIP-seq of direct NKX2-1 binding near Wnt7b and Shh loci. Input and NKX2-1 IP tracks are displayed at the same linear scale, as indicated by IGV Data Range on the y-axis. Horizontal scale bar = 10 kb. (c–h) RNA localization (green) of Wnt7b (c–e) and Shh (f–h) in control (left), Nkx2-1-TrKO (middle), and Nkx2-1-TrKO; Sox2-TrKO (right) E11.5 embryos with immunofluorescent staining of NKX2-1 (magenta) and SOX2 (cyan). (i–j) RNA localization of Wnt7b (red) and Axin2 (yellow) in WT and Nkx2-1-/- E13.5 foreguts. 3/3 embryos display phenotype. (k–l) SOX9 staining (green) of cartilage progenitors in WT and Nkx2-1-/- E13.5 foreguts. 3/3 embryos display phenotype. (m–n) RNA localization of Shh (red) and Ptch1 (yellow) in WT and Nkx2-1-/- E13.5 foreguts. 2/2 embryos display phenotype. (o–p) Smooth muscle actin (SMA) staining (cyan) of smooth muscle in WT and Nkx2-1-/- E13.5 foreguts. 3/3 embryos display phenotype. All images were captured at 20X magnification and images within each staining panel are at the same scale. Scale = 50 um.
Figure 6—figure supplement 1.
Figure 6—figure supplement 1.. NKX2-1 regulation of epithelial-mesenchymal signaling.
(a) RNA localization of Wnt7b (red) and Axin2 (yellow), and (b) Shh (red) and Ptch1 (yellow) in WT and Nkx2-1-/- E11.5 foreguts. (c) Schematic of rostral-caudal position of images in (d-g). (d-g) RNA localization of Wnt7b and Axin2 (d), Shh and Ptch1 (f), and protein localization of SOX9 (e), and smooth muscle actin (SMA) (g) along the rostral-caudal axis of E13.5 WT and Nkx2-1-/- foreguts.
Figure 7.
Figure 7.. Proposed model of NKX2-1-dependent and -independent tracheoesophageal specification.
(a) Schematic of NKX2-1 and SOX2 regulation of gene expression in WT trachea and esophagus, and epithelial-mesenchymal signaling downstream of NKX2-1. NKX2-1 negatively regulates esophageal genes Shh, Klf5 and Has2, and positively regulates tracheal genes Wnt7b, Tppp3, and Pcdh10. SOX2 is required for expression of Shh and Has2. NKX2-1 regulation of Shh and Wnt7b influences mesenchymal SHH and WNT response required for smooth muscle and tracheal cartilage development. (b) Schematic of Nkx2-1-/- mutant phenotype. Maintenance of the NKX2-1-independent transcriptional program includes dorsal expression of Dcn, Ackr3, Meis2, Pitx1, and Lrig1 and ventral expression of Irx2, Ly6h, and Nrp2. NKX2-1-dependent transcriptional changes include increased expression of esophageal genes and decreased expression of tracheal genes in the ventral foregut, accompanied by changes in epithelial-mesenchymal signaling and mesenchymal differentiation.

References

    1. Becht E, McInnes L, Healy J, Dutertre C-A, Kwok IWH, Ng LG, Ginhoux F, Newell EW. Dimensionality reduction for visualizing single-cell data using UMAP. Nature Biotechnology. 2019;37:38–44. doi: 10.1038/nbt.4314. - DOI - PubMed
    1. Billmyre KK, Hutson M, Klingensmith J. One shall become two: separation of the esophagus and Trachea from the common foregut tube. Developmental Dynamics. 2015;244:277–288. doi: 10.1002/dvdy.24219. - DOI - PMC - PubMed
    1. Cardoso WV, Lü J. Regulation of early lung morphogenesis: questions, facts and controversies. Development. 2006;133:1611–1624. doi: 10.1242/dev.02310. - DOI - PubMed
    1. Domyan ET, Ferretti E, Throckmorton K, Mishina Y, Nicolis SK, Sun X. Signaling through BMP receptors promotes respiratory identity in the foregut via repression of Sox2. Development. 2011;138:971–981. doi: 10.1242/dev.053694. - DOI - PMC - PubMed
    1. Dye BR, Hill DR, Ferguson MAH, Tsai Y-H, Nagy MS, Dyal R, Wells JM, Mayhew CN, Nattiv R, Klein OD, White ES, Deutsch GH, Spence JR. In vitro generation of human pluripotent stem cell derived lung organoids. eLife. 2015;4:e05098. doi: 10.7554/eLife.05098. - DOI - PMC - PubMed

Publication types