. 2020 Oct 1;130(10):5197-5208.
doi: 10.1172/JCI138697.

Inactivation of paracellular cation-selective claudin-2 channels attenuates immune-mediated experimental colitis in mice

Affiliations

Inactivation of paracellular cation-selective claudin-2 channels attenuates immune-mediated experimental colitis in mice

Preeti Raju et al. J Clin Invest. .

Abstract

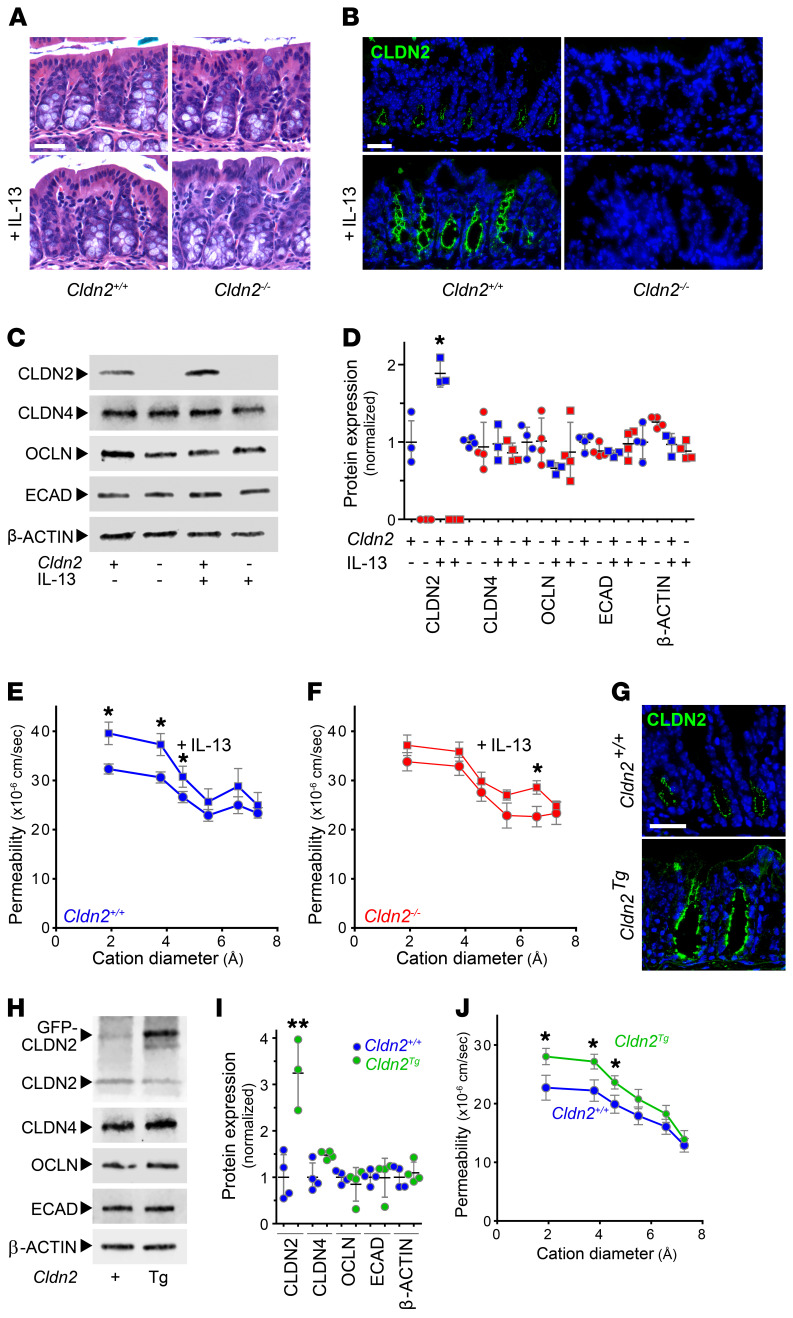
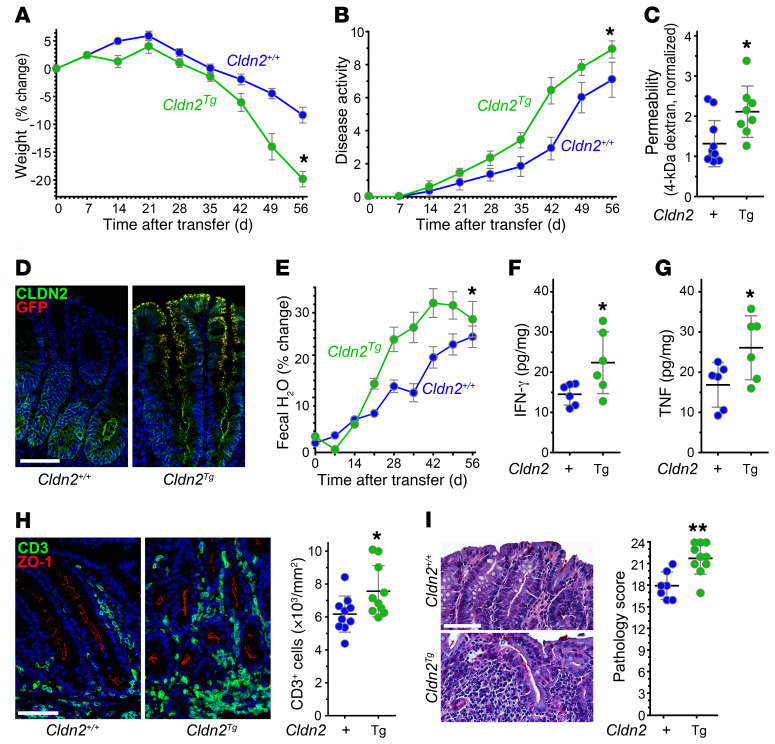
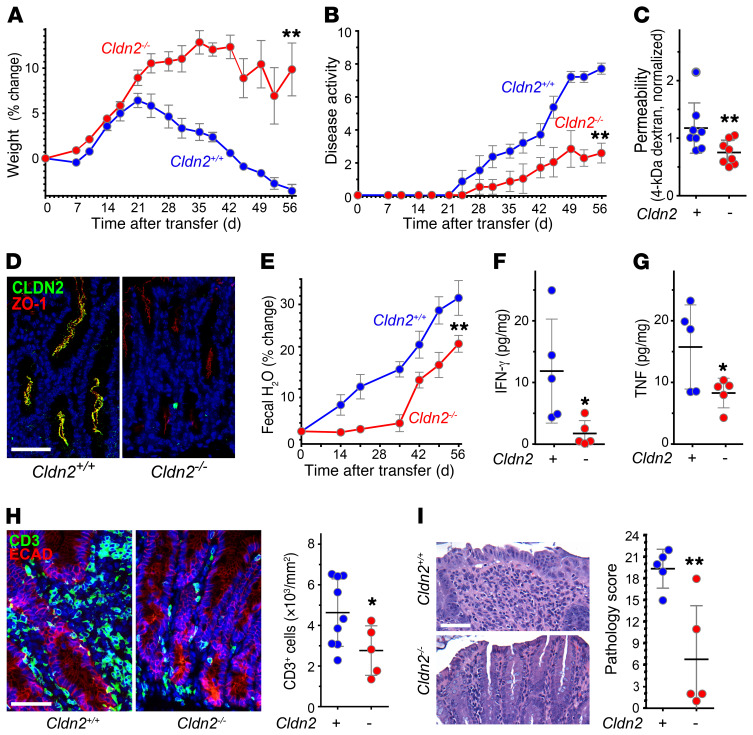
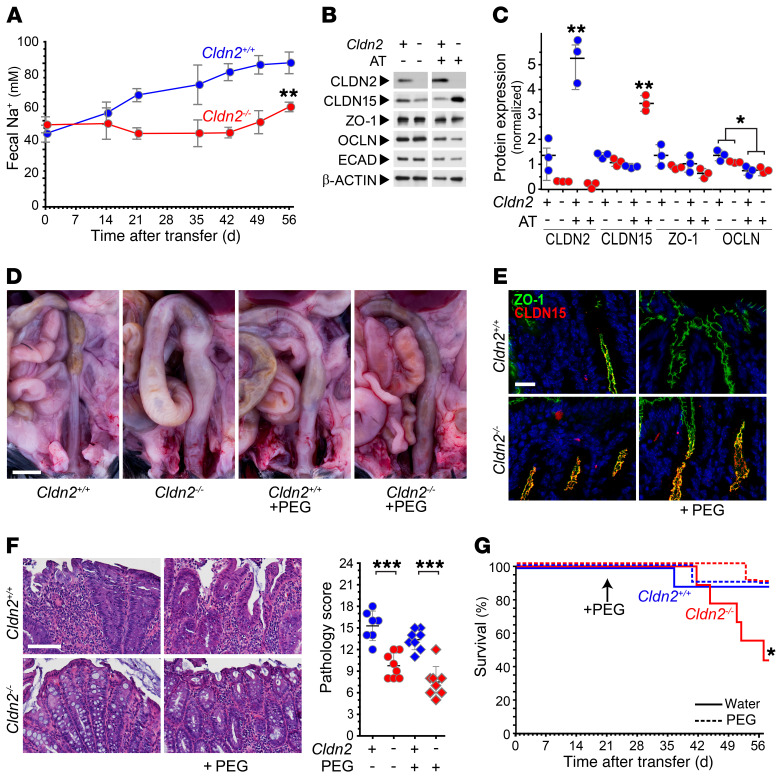
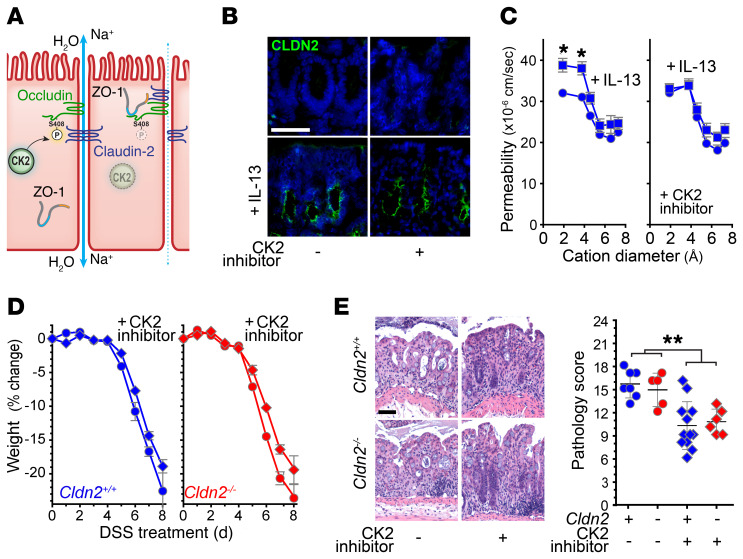
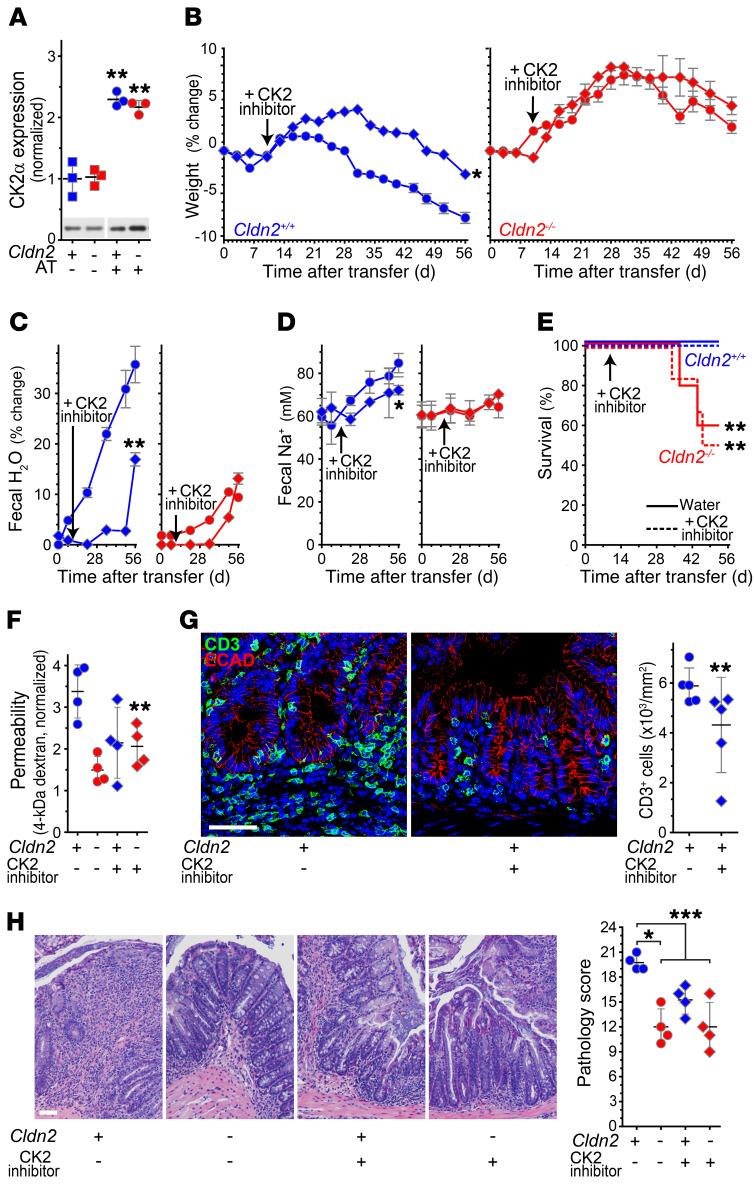
The tight junction protein claudin-2 is upregulated in disease. Although many studies have linked intestinal barrier loss to local and systemic disease, these have relied on macromolecular probes. In vitro analyses show, however, that these probes cannot be accommodated by size- and charge-selective claudin-2 channels. We sought to define the impact of claudin-2 channels on disease. Transgenic claudin-2 overexpression or IL-13-induced claudin-2 upregulation increased intestinal small cation permeability in vivo. IL-13 did not, however, affect permeability in claudin-2-knockout mice. Claudin-2 is therefore necessary and sufficient to effect size- and charge-selective permeability increases in vivo. In chronic disease, T cell transfer colitis severity was augmented or diminished in claudin-2-transgenic or -knockout mice, respectively. We translated the in vitro observation that casein kinase-2 (CK2) inhibition blocks claudin-2 channel function to prevent acute, IL-13-induced, claudin-2-mediated permeability increases in vivo. In chronic immune-mediated colitis, CK2 inhibition attenuated progression in claudin-2-sufficient, but not claudin-2-knockout, mice, i.e., the effect was claudin-2 dependent. Paracellular flux mediated by claudin-2 channels can therefore promote immune-mediated colitis progression. Although the mechanisms by which claudin-2 channels intensify disease remain to be defined, these data suggest that claudin-2 may be an accessible target in immune-mediated disorders, including inflammatory bowel disease.

Keywords: Cell Biology; Epithelial transport of ions and water; Gastroenterology; Inflammatory bowel disease; Tight junctions.


Conflict of interest statement

Conflict of interest: JRT is a cofounder of, and shareholder in, Thelium Therapeutics.

Figures

Figure 1
Figure 1. Claudin-2 is necessary and sufficient for IL-13–induced changes in pore pathway permeability.
(A) Colonic histopathology of Cldn2+/+ or Cldn2–/– mice was not affected by injection with vehicle or IL-13. (B) IL-13 increases claudin-2 (CLDN2, green) protein expression in proximal colonic epithelial cells of Cldn2+/+, but not Cldn2–/–, mice. Nuclei (blue) are shown for reference. (C) Immunoblots of isolated colonic epithelia from Cldn2+/+ and Cldn2–/– mice treated with vehicle or IL-13. Claudin-2, claudin-4 (CLDN4), occludin (OCLN), E-cadherin (ECAD), and β-actin are shown. (D) Densitometry of immunoblots, as in C. n = 3–4 per condition. ANOVA with Bonferroni’s correction. (E and F) Proximal colonic mucosae from Cldn2+/+ (E) and Cldn2–/– (F) mice treated with vehicle (circles) or IL-13 (squares) were mounted in Ussing chambers for analysis of paracellular permeability. Bi-ionic potential measurements were used to determine the permeabilities of Na+ and 5 larger cations (methylamine, ethylamine, tetramethylammonium, tetraethylammonium, and N-methyl-D-glucamine). IL-13 increased permeability of Na+, methylamine, and ethylamine, but not larger cations, in Cldn2+/+ mice. IL-13 did not affect Na+, methylamine, or ethylamine permeability in Cldn2–/– mice. n = 8 and 9 for Cldn2+/+ mice without or with IL-13 treatment, respectively, and n = 5 and 9 for Cldn2–/– mice without or with IL-13 treatment, respectively. Data compiled from 3 independent experiments. Two-tailed t test. (G) Claudin-2 (green) expression in Cldn2+/+ and Cldn2Tg mice. (H) Representative immunoblots of isolated colonic epithelia from Cldn2+/+ and Cldn2Tg mice. (I) Densitometry of immunoblots of isolated colonic epithelia from Cldn2+/+ and Cldn2Tg mice, as in H. n = 3–4 per condition. Two-tailed t test. (J) Ussing chamber analysis (as in E) of proximal colonic mucosae from Cldn2+/+ and Cldn2Tg mice. Claudin-2 overexpression selectively increased Na+, methylamine, and ethylamine permeability. n = 11 Cldn2+/+, 10 Cldn2Tg. Data compiled from 3 independent experiments. Two-tailed t test. *P < 0.05; **P < 0.01. Scale bars: 50 μm.
Figure 2
Figure 2. Intestinal epithelium–specific claudin-2 overexpression exacerbates immune-mediated colitis.
(A) Weight loss and (B) disease activity following T cell transfer were both greater in Cldn2Tg Rag1–/– mice (Cldn2Tg, green circles) relative to Cldn2+/+ Rag1–/– mice (Cldn2+/+, blue circles). n = 12 per genotype. Two-tailed t test on day 56. (C) Consistent with greater tissue injury, increases in 4-kDa dextran permeability were amplified in Cldn2Tg Rag1–/– mice relative to Cldn2+/+ Rag1–/– mice. n = 12 per genotype. Two-tailed t test. (D) Claudin-2 expression per cell as well as the number of claudin-2–expressing cells in each crypt increased markedly on day 56. Endogenous claudin-2 (CLDN2, green) was limited to the bottom half of the crypt in both Cldn2+/+ Rag1–/– and Cldn2Tg Rag1–/– mice. In contrast, GFP–claudin-2 (red) was detected from the mid crypt to the mucosal surface. (E) Fecal water of Cldn2+/+ Rag1–/– and Cldn2Tg Rag1–/– mice following T cell transfer. n = 12 per genotype. Two-tailed t test. (F) Mucosal IFN-γ and (G) TNF on day 56. n = 6 per genotype. Two-tailed t test. (H) Representative immunostain of proximal colon showing CD3 (green) and ZO-1 (red) and corresponding quantitative analysis. n = 10 per genotype. Two-tailed t test. (I) Representative pathology scores on day 56. n = 7 Cldn2+/+ Rag1–/–, 10 Cldn2Tg Rag1–/–. Two-tailed t test. Data presented in this figure are typical of 3 independent experiments. *P < 0.05; **P < 0.01. Scale bars: 50 μm.
Figure 3
Figure 3. Claudin-2 knockout limits immune-mediated colitis severity.
(A) Weight loss and (B) disease activity induced by T cell transfer are attenuated in Cldn2–/– Rag1–/– mice (Cldn2–/–, red circles), relative to that of Cldn2+/+ Rag1–/– mice (Cldn2+/+, blue circles). n = 9–10 per genotype. Two-tailed t test on day 56. (C) Consistent with reduced mucosal damage, barrier function was maintained in Cldn2–/– Rag1–/– mice relative to that of Cldn2+/+ Rag1–/– mice. Dextran (4 kDa) flux was normalized to mice without T cell transfer. n = 8 per genotype. Two-tailed t test. (D) Claudin-2 (CLDN2, green) expression is increased in proximal colon of Cldn2+/+ Rag1–/– mice on day 56. ZO-1 (red) expression is maintained in Cldn2+/+ Rag1–/– and Cldn2–/– Rag1–/– mice. (E) Following T cell transfer, fecal water content increased more rapidly in Cldn2+/+ Rag1–/– mice relative to Cldn2–/– Rag1–/– mice. n = 5 per genotype. Two-tailed t test on day 56. (F) Mucosal IFN-γ and (G) TNF on day 56 after T cell transfer. n = 5 per genotype. Two-tailed t test. (H) Representative immunostain of proximal colon showing CD3 (green) and E-cadherin (ECAD, red) and corresponding quantitative analysis. T cell recruitment is blunted in Cldn2–/– Rag1–/– mice. n = 5–9 per genotype. Two-tailed t test. (I) Representative pathology scores on day 56. n = 5 per genotype. Two-tailed t test. Data presented in this figure are typical of 5 independent experiments. *P < 0.05; **P < 0.01. Scale bars: 50 μm.
Figure 4
Figure 4. Despite reduced immune-mediated colitis severity, survival is compromised in claudin-2–knockout mice.
(A) Survival of Cldn2+/+ Rag1–/– (Cldn2+/+, blue line) and Cldn2–/– Rag1–/– (Cldn2–/–, red line) mice following T cell transfer. n = 14–17 per genotype. Kaplan-Meier log-rank test. Data are representative of 5 independent experiments (B) Representative gross images of nonobstructed colons (arrows) of Cldn2+/+ Rag1–/– and Cldn2–/– Rag1–/– mice, as well as obstructed (arrow) and ischemic (arrowhead) colon from a Cldn2–/– Rag1–/– mouse. Scale bar: 0.5 cm. (C) Representative histopathology of obstructed Cldn2–/– Rag1–/– mouse colon. Scale bar: 50 μm. (D) Picrosirius red stains of Cldn2+/+ Rag1–/– and Cldn2–/– Rag1–/– mouse colons on day 56. Scale bar: 50 μm. (E) Fibrosis scores of colons from Cldn2+/+ Rag1–/– (blue circles) and Cldn2–/– Rag1–/– (red circles) mice on day 56. n = 4 per genotype. Two-tailed t test. (F) Small intestine motility in Cldn2+/+, Cldn2Tg (green circles), and Cldn2+/+ mice assessed as dye content of each fraction and geometric mean of dye distribution. n = 6 per genotype. ANOVA with Bonferroni’s correction. (G) Colonic motility assessed as dye content of each fraction and geometric mean of dye distribution. n = 6 per genotype. ANOVA with Bonferroni’s correction. **P < 0.01.
Figure 5
Figure 5. Insufficient luminal hydration leads to increased mortality in claudin-2–knockout mice.
(A) Fecal Na+ of Cldn2+/+ Rag1–/– (Cldn2+/+, blue circles) and Cldn2–/– Rag1–/– (Cldn2–/–, red circles) mice following T cell transfer. Data are representative of 5 independent experiments. n = 6 per genotype. Two-tailed t test on day 56. (B) Immunoblots of isolated colonic epithelia from Cldn2+/+ Rag1–/– and Cldn2–/– Rag1–/– mice without (–) or with (+) T cell transfer (AT) on day 56. Claudin-2 (CLDN2), claudin-15 (CLDN15), ZO-1, occludin (OCLN), E-cadherin (ECAD), and β-actin are shown. Due to the number of antigens probed, samples are not all from the same membrane but are from blots that were performed in parallel using the same samples. The data were validated further by quantitative densitometry. (C) Densitometry of immunoblots, as in B. n = 3 per condition. ANOVA with Bonferroni’s correction. Data are representative of 3 independent experiments. (D) Gross images of Cldn2+/+ Rag1–/– and Cldn2–/– Rag1–/– mouse colons with polyethylene glycol (+PEG) or without PEG treatment on day 56. Scale bar: 0.5 cm. (E) ZO-1 (green) and claudin-15 (red) expression in proximal colon of vehicle- and PEG-treated mice 56 days after T cell transfer. Scale bar: 20 μm. (F) Representative colonic pathology scores in Cldn2+/+ Rag1–/– and Cldn2–/– Rag1–/– mice without PEG (circles) or with PEG (diamonds) treatment on day 56. Scale bar: 50 μm. n = 7–8 per genotype and condition. ANOVA with Bonferroni’s correction. (G) Survival of Cldn2+/+ Rag1–/– (blue lines) and Cldn2–/– Rag1–/– (red lines) mice following provision of normal drinking water (solid lines) or water with PEG (dashed lines) beginning on day 21. n = 9–10 per condition. Kaplan-Meier log-rank test. Data in DG are representative of 3 independent experiments. *P < 0.05; **P < 0.01; ***P < 0.001.
Figure 6
Figure 6. CK2 inhibition does not affect DSS colitis severity.
(A) In vitro studies have shown that casein kinase-2 (CK2) inhibition results in occludin S408 dephosphorylation. This increases occludin’s affinity for ZO-1 and leads to assembly of a trimolecular complex composed of occludin, ZO-1, and claudin-2 that inactivates claudin-2 channels (50). (B) Claudin-2 (CLDN2, green) expression in proximal colon of WT mice treated with vehicle or IL-13 without or with CK2 inhibition. Nuclei (blue) are shown for reference. Data are representative of 3 independent experiments. (C) Ussing chamber analysis of proximal colonic mucosal permeability to Na+ and 5 larger cations (methylamine, ethylamine, tetramethylammonium, tetraethylammonium, and N-methyl-D-glucamine), as in Figure 1. Both graphs show Cldn2+/+ mice treated with vehicle (circles) or IL-13 (squares). Mice that were treated with vehicle (left) or CK2 inhibitor (right) are shown in the 2 graphs. Data compiled from 3 independent experiments. ANOVA with Bonferroni’s correction. (D) Weight change of Cldn2+/+ and Cldn2–/– mice following DSS treatment without (circles) or with (diamonds) CK2 inhibitor. n = 5–7 per group. ANOVA with Bonferroni’s correction. (E) Representative pathology scores on day 8 after DSS treatment. n = 5–12 per group. ANOVA with Bonferroni’s correction. Data in D and E are representative of 4 independent experiments. *P < 0.05; **P < 0.01. Scale bars: 50 μm.
Figure 7
Figure 7. CK2 inhibition limits immune-mediated colitis severity via a claudin-2–dependent mechanism.
(A) Immunoblots of the catalytic α subunit of casein kinase-2 (CK2) in isolated colonic epithelia from Cldn2+/+ Rag1–/– (Cldn2+/+, blue symbols) and Cldn2–/– Rag1–/– (Cldn2–/–, red symbols) mice without adoptive T cell transfer (+AT) (squares) or on day 56 after transfer (circles). n = 3 per condition. Data are representative of 3 independent experiments. ANOVA with Bonferroni’s correction. (B) Weight loss following T cell transfer was attenuated by CK2 inhibition in Cldn2+/+ Rag1–/– mice (left graph) but not Cldn2–/– Rag1–/– mice (right graph). Mice were treated with vehicle (circles) or CK2 inhibitor (diamonds), beginning 10 days after T cell transfer. n = 5–6 per condition. ANOVA with Bonferroni’s correction on day 56. (C) Fecal water and (D) Na+ content following T cell transfer were reduced in CK2-inhibitor-treated Cldn2+/+ Rag1–/– mice (blue symbols, left graphs); there was no effect in Cldn2–/– Rag1–/– mice (red symbols, right graphs). n = 5–6 per condition. ANOVA with Bonferroni’s correction on day 56. (E) Survival of Cldn2+/+ Rag1–/– and Cldn2–/– Rag1–/– mice following T cell transfer without (solid lines) or with (dashed lines) CK2 inhibitor treatment. n = 5–6 per condition. Kaplan-Meier log-rank test. (F) Intestinal barrier function on day 56 after T cell transfer was preserved in CK2-inhibitor-treated Cldn2+/+ Rag1–/– mice. n = 4 per condition. ANOVA with Bonferroni’s correction. (G) Immunostain of CD3 (green) and E-cadherin (ECAD, red). CK2 inhibition reduced T cell recruitment into proximal colonic mucosae of Cldn2+/+ Rag1–/– mice. Scale bar: 50 μm. n = 5 per condition. ANOVA with Bonferroni’s correction. (H) Histopathology and scores on day 56 after T cell transfer without or with CK2 inhibitor treatment. Scale bar: 50 μm. n = 4 per genotype and condition. ANOVA with Bonferroni’s correction. Data presented in BH are typical of 3 independent experiments. *P < 0.05; **P < 0.01; ***P < 0.001.

Comment in

References

    1. Tisher CC, Yarger WE. Lanthanum permeability of the tight junction (zonula occludens) in the renal tubule of the rat. Kidney Int. 1973;3(4):238–250. doi: 10.1038/ki.1973.37. - DOI - PubMed
    1. Marcial MA, Carlson SL, Madara JL. Partitioning of paracellular conductance along the ileal crypt-villus axis: a hypothesis based on structural analysis with detailed consideration of tight junction structure-function relationships. J Membr Biol. 1984;80(1):59–70. doi: 10.1007/BF01868690. - DOI - PubMed
    1. Pei L, et al. Paracellular epithelial sodium transport maximizes energy efficiency in the kidney. J Clin Invest. 2016;126(7):2509–2518. doi: 10.1172/JCI83942. - DOI - PMC - PubMed
    1. Wada M, Tamura A, Takahashi N, Tsukita S. Loss of claudins 2 and 15 from mice causes defects in paracellular Na+ flow and nutrient transport in gut and leads to death from malnutrition. Gastroenterology. 2013;144(2):369–380. doi: 10.1053/j.gastro.2012.10.035. - DOI - PubMed
    1. Farquhar MG, Palade GE. Junctional complexes in various epithelia. J Cell Biol. 1963;17:375–412. doi: 10.1083/jcb.17.2.375. - DOI - PMC - PubMed

Publication types