. 2020 Sep 1;130(9):4985-4998.
doi: 10.1172/JCI130889.

Impaired hypocretin/orexin system alters responses to salient stimuli in obese male mice

Affiliations

Impaired hypocretin/orexin system alters responses to salient stimuli in obese male mice

Ying Tan et al. J Clin Invest. .

Abstract

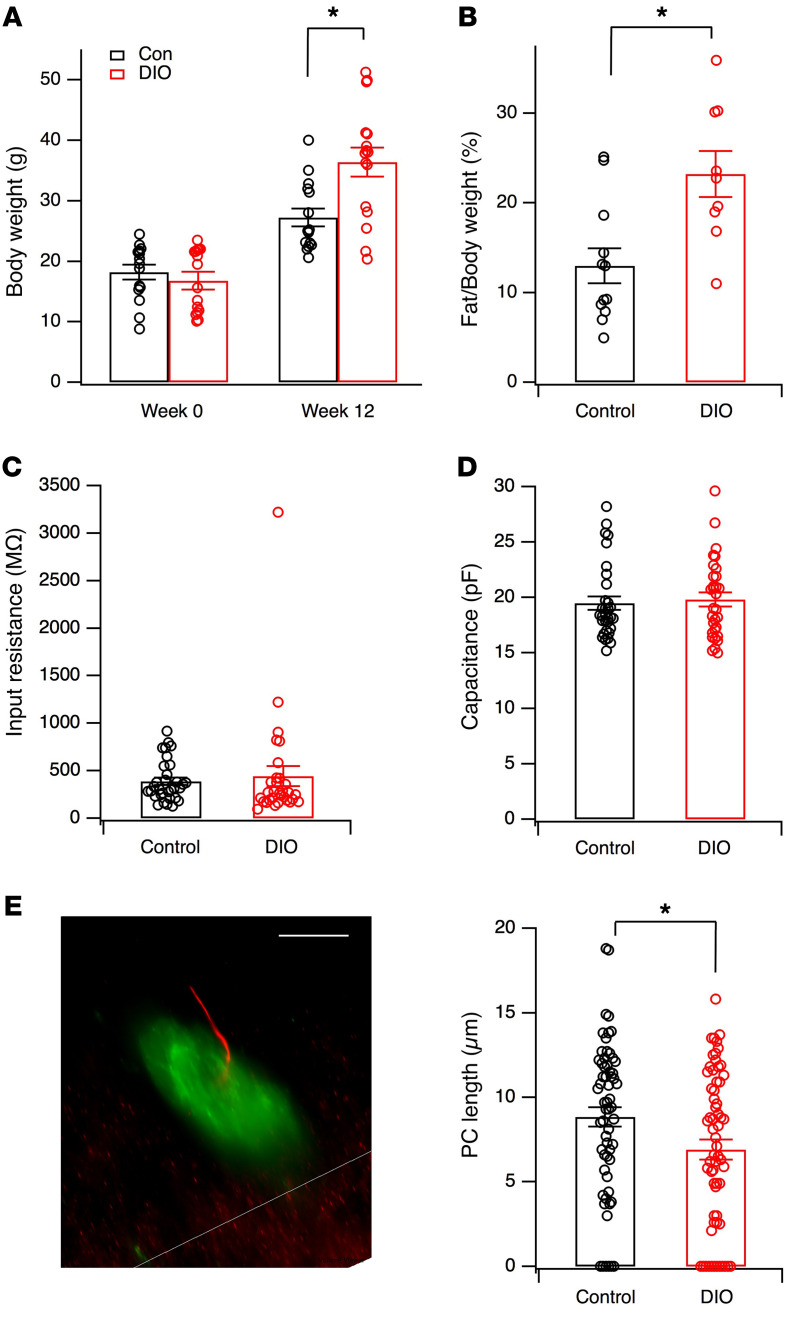
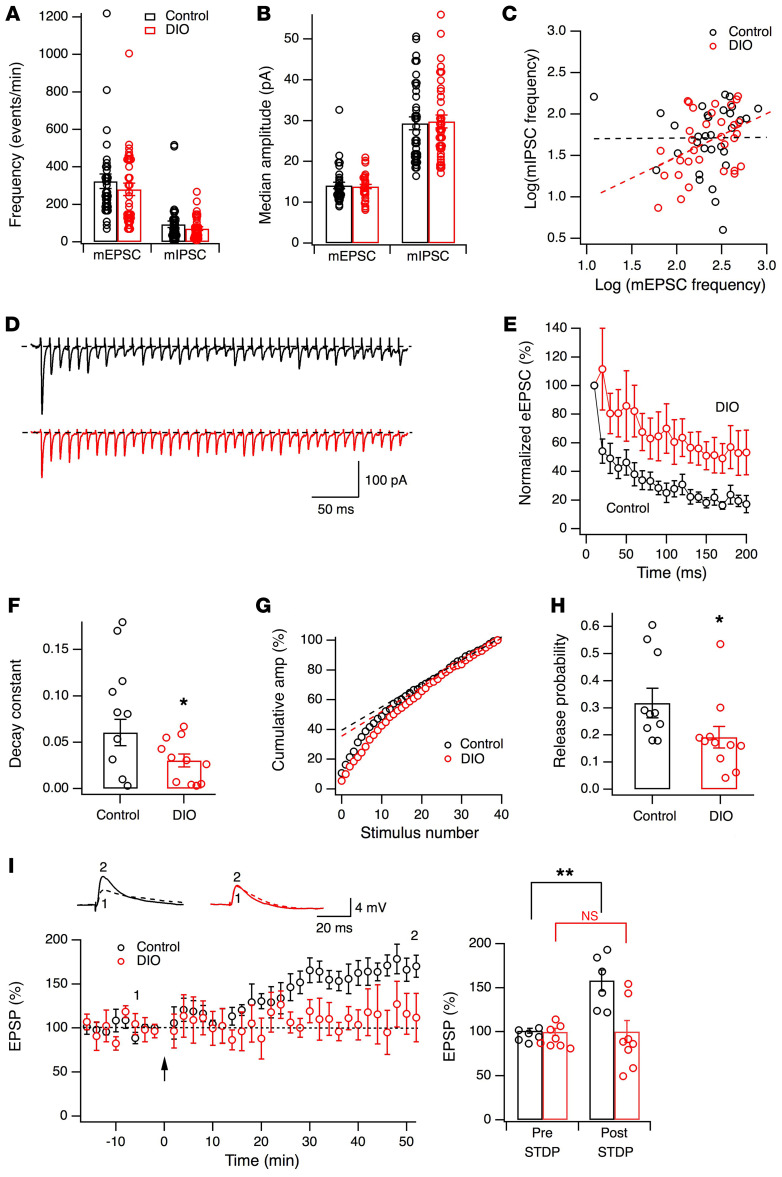
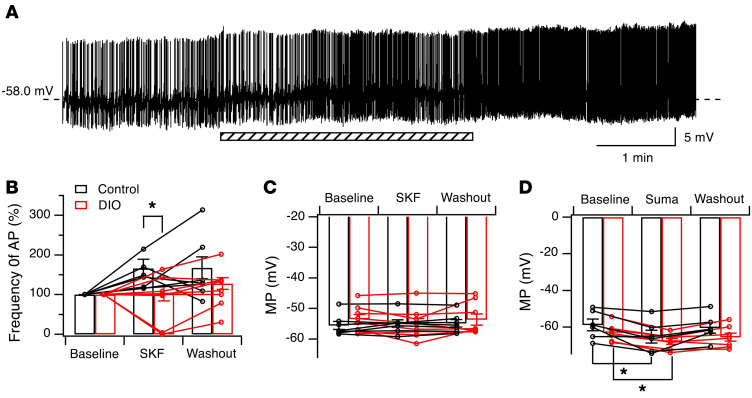
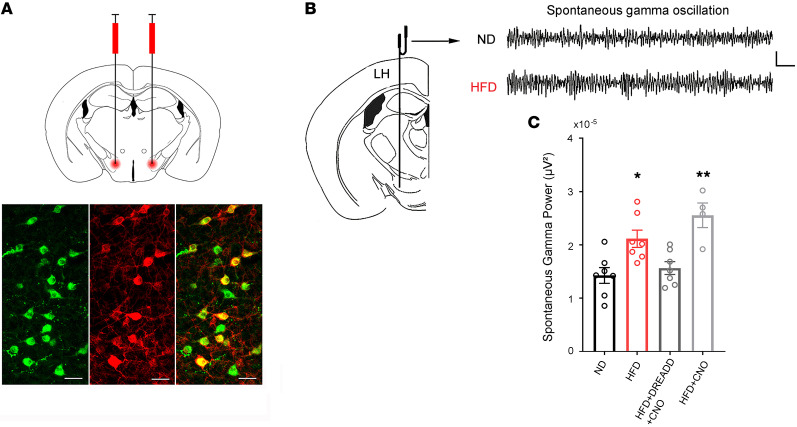
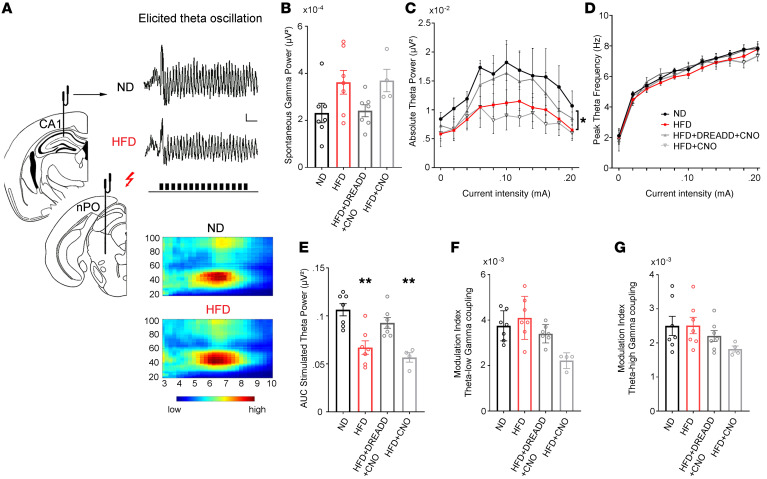
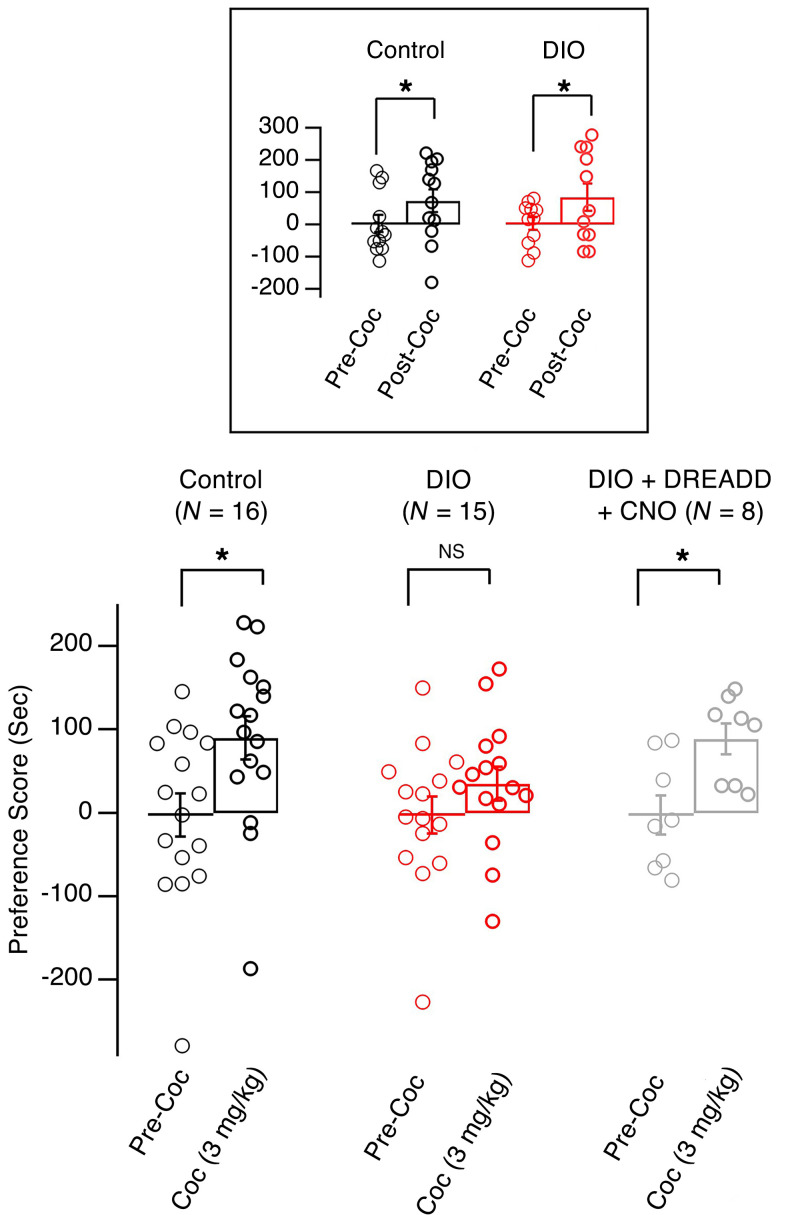
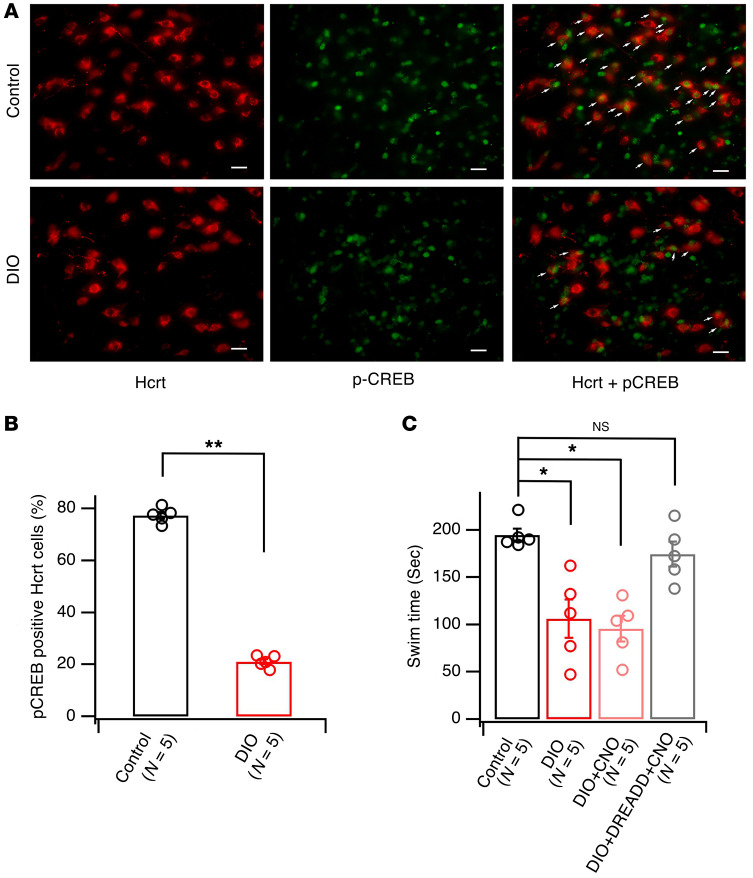
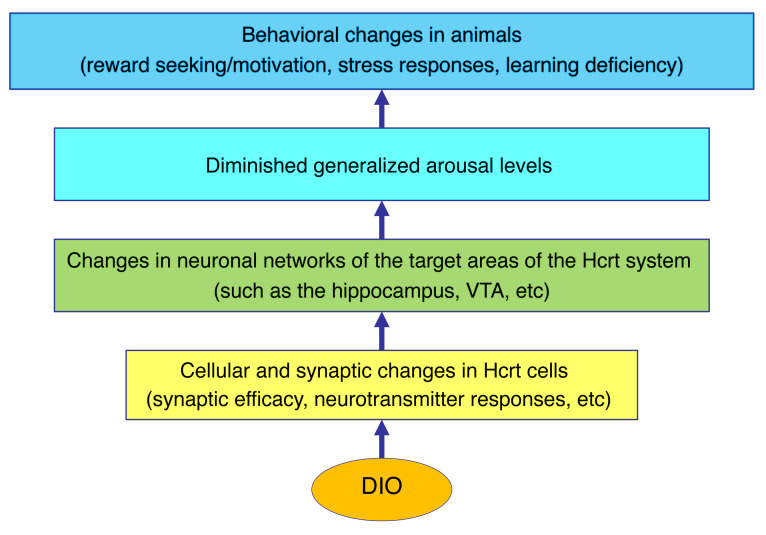
The brain has evolved in an environment where food sources are scarce, and foraging for food is one of the major challenges for survival of the individual and species. Basic and clinical studies show that obesity or overnutrition leads to overwhelming changes in the brain in animals and humans. However, the exact mechanisms underlying the consequences of excessive energy intake are not well understood. Neurons expressing the neuropeptide hypocretin/orexin (Hcrt) in the lateral/perifonical hypothalamus (LH) are critical for homeostatic regulation, reward seeking, stress response, and cognitive functions. In this study, we examined adaptations in Hcrt cells regulating behavioral responses to salient stimuli in diet-induced obese mice. Our results demonstrated changes in primary cilia, synaptic transmission and plasticity, cellular responses to neurotransmitters necessary for reward seeking, and stress responses in Hcrt neurons from obese mice. Activities of neuronal networks in the LH and hippocampus were impaired as a result of decreased hypocretinergic function. The weakened Hcrt system decreased reward seeking while altering responses to acute stress (stress-coping strategy), which were reversed by selectively activating Hcrt cells with chemogenetics. Taken together, our data suggest that a deficiency in Hcrt signaling may be a common cause of behavioral changes (such as lowered arousal, weakened reward seeking, and altered stress response) in obese animals.

Keywords: Metabolism; Neuroendocrine regulation; Neurological disorders; Neuroscience; Obesity.


Conflict of interest statement

Conflict of interest: The authors have declared that no conflict of interest exists.

Figures

Figure 1
Figure 1. Measurements of body weight, body composition, and basic electrophysiological and morphological parameters in Hcrt cells in control and DIO mice.
(A and B) Body weight (control, n = 15 mice; DIO, n = 16 mice) and percentage of fat mass (control, n = 12 mice; DIO, n = 9 mice) in control (Con) and DIO mice sampled in animals used in our experiments. *P < 0.01, 2-tailed t test. Data shown in these panels were from different cohorts of mice. (C and D) Input resistance and membrane capacitance of Hcrt cells tested with potassium-based pipette solution in control (n = 32 cells from 12 mice) and DIO mice (n = 31 cells from 12 mice). (E) Lengths of primary cilia (PC) in Hcrt cells. Left: microscopic image of a primary cilium (red) in a Hcrt (green) cell in control Hcrt-GFP mice. GFP was expressed in Hcrt cells under the control of a Hcrt promoter in Hcrt-GFP mice (39, 44, 69). PC was detected by immunostaining for AC3 using an anti-AC3 primary antibody. Scale bar: 10 μm. Right: mean lengths of primary cilia in Hcrt cells in control (n= 61 cells from 3 mice) and DIO (n = 63 cells from 3 mice) mice. *P < 0.05, 2-tailed t test.
Figure 2
Figure 2. Synaptic deficiency in the Hcrt system in obese mice.
(A and B) Frequency and median amplitude of miniature EPSCs and IPSCs recorded in Hcrt cells from control (n = 6 mice) and obese (n = 6 mice) groups. (C) Excitatory and inhibitory inputs onto Hcrt cells from control and obese mice. Each dot is plotted with logarithmic scales of mEPSC (x axis) and mIPSC (y axis) frequencies from the same cell. (DH) Evoked EPSCs triggered by HFS (100 Hz, 50 pulses) in Hcrt cells in LH slices from control (n = 10 cells from 5 mice) and obese (n = 11 cells from 3 mice) groups. (D) Raw eEPSC traces (top, control mice; bottom, obese mice). (E) Averaged amplitudes (normalized to the first eEPSC) during HFS (initial 20 pulses) in Hcrt cells. (F) Decay constants of eEPSC amplitudes during initial 20 pulses of HFS in control (black) and obese (red) mice. *P < 0.05, 2-tailed t test. (G and H) Release probability of glutamatergic synapses on Hcrt cells in control and obese mice. (G) Cumulative eEPSC amplitude normalized to the maximum value from 2 representative cells in control (black) and obese (red) mice. Linear regression along the last 15 data points was performed and y intercept (RRPtrain) was obtained. (H) Release probability in Hcrt cells from control and obese mice. *P < 0.05, 2-tailed t test. (I) STDP in Hcrt neurons from control (black, n = 6 cells from 3 mice) and obese (red, n = 8 cells from 4 mice) animals. Left panel: time courses of normalized eEPSC amplitudes before and after the STD protocol (indicated by the arrow). Top: raw traces of eEPSPs recorded at time points 1 and 2. Right panel: eEPSP before and 40 minutes after STD protocol in Hcrt cells from control and DIO mice. **P < 0.01, 2-way ANOVA.
Figure 3
Figure 3. The D1DR- but not the D2DR-mediated effect was impaired in Hcrt cells in obese mice compared with control counterparts.
(A) Raw traces of membrane potential (MP) and APs recorded before, during, and after the application of a specific D1 receptor agonist, SKF, in Hcrt cells in control mice. Please note that AP amplitudes were small due to the use of whole-cell recording with a high series resistance to preserve intracellular contents and prevent rundown of AP firing in Hcrt cells in this experiment. The shaded bar indicates the application of SKF. (B and C) Averaged changes in AP frequencies and MP values before, during, and after the application of SKF in Hcrt neurons in control (n = 7 cells from 5 mice) and obese (DIO, n = 8 cells from 6 mice) groups. *P < 0.05, 2-tailed t test. (D) Averaged MP before, during, and after the application of a selective D2 receptor agonist (Suma) in Hcrt neurons in control and obese mice. *P < 0.01, repeated-measures 1-way ANOVA.
Figure 4
Figure 4. Spontaneous neural oscillations recorded from the LH in mice under urethane anesthesia.
(A) Images showing the expression of a stimulatory DREADD receptor (hM3Dq) selectively in Hcrt cells through an AAV viral vector (rAAV5/EF1α-DIO-hM3Dq[Gq]-mCherry) under the control of Cre-recombinase expressed specifically in Hcrt cells in Hcrt-Cre mice. Top: diagram showing the bilateral microinjection of the AAV viral vector into the LH. Bottom: confocal microscopic images of immunostaining of Hcrt (left, green), expression of mCherry (middle, red), and overlap of Hcrt and mCherry signals in Hcrt cells. Scale bars: 40 μm. (B) Diagram showing the placement of the recording electrode in the LH. Scale bars: 0.05 mV, 0.1 seconds. (C) Both obese (HFD, n = 7 mice) and obese-CNO (HFD+CNO, hM3Dq mice injected with CNO, n = 4 mice) animals showed significantly enhanced LH γ oscillation power compared with control (ND, n = 7 mice) and obese mice with a selective activation of Hcrt cells through the hM3Dq receptor (HFD+DREADD+CNO, n = 7 mice). *P < 0.05; **P < 0.01, 1-way ANOVA. Top: raw traces of typical LFPs in γ band from control (ND) and obese (HFD) mice (signal is band-pass filtered between 30 and 90 Hz).
Figure 5
Figure 5. Spontaneous and evoked neural oscillations recorded from the hippocampus in mice under urethane anesthesia.
Hippocampal LFPs were recorded from the CA1 region in urethane-anesthetized mice under basal spontaneous conditions and during brainstem nucleus pontis oralis (nPO) electrical stimulation (A, left panel). Typical traces showing elicited θ oscillation (right panel, upper) and heatmaps (right panel, lower) depicting θ phase–γ amplitude coupling from control (ND, n = 7 mice) and obese (HFD, n = 7 mice) mice. Stimulation period with the same current intensity is indicated by train pulses under the lower trace. Scale bar: 0.2 mV, 1 second. (B) Spontaneous γ oscillation power. (CE) Stimulus-response relationship plotted for θ power and peak frequency over increasing stimulus intensities (C and D) and AUC (E) analyses showed a decline in elicited θ power in obese (HFD, n = 7 mice) and CNO-treated obese (HFD+CNO, n = 4 mice) mice (obese hM3Dq-negative mice injected with CNO) compared with controls (ND, n = 7 mice) and mice with a selective activation of Hcrt cells through the hM3Dq receptor (HFD+DREADD+CNO, N = 7 mice). *P < 0.05; **P < 0.01, 1-way ANOVA. (F and G) The θ–low γ (F) and θ–high γ coupling (G) expressed by the MI and computed during hippocampal stimulation were not different between the groups (1-way ANOVA test).
Figure 6
Figure 6. Weakened Hcrt system was responsible for the attenuation of expression of cocaine CPP in obese mice.
Bar graph showing the preference scores of 3 groups of mice after the completion of cocaine CPP at a dose of 3 mg/kg (i.p.): control, obese (DIO), and obese with Hcrt cell activation (DIO+DREADD+CNO). Box, preference scores of control and obese mice after the completion of cocaine CPP at a dose of 10 mg/kg (i.p.). *P < 0.05, 2-tailed t test.
Figure 7
Figure 7. Weakened Hcrt system was responsible for a decreased swim time during forced CWS in obese mice as compared with controls.
(A) Images showing immunostaining of the expression of CREB phosphorylation (green) in Hcrt cells (red) in control and obese mice. Arrows indicate positive p-CREB staining (green) in Hcrt-positive (red) cells in control and obese groups. Scale bars: 40 μm. (B) Bar graph showing percentage of p-CREB–positive Hcrt cells in all Hcrt cells 5 minutes after CWS in control and obese (DIO) groups. **P < 0.01, 2-tailed t test. (C) Bar graph showing the time spent swimming during a 5-minute session of CWS in 4 groups of mice: control, obese (DIO), obese with a selective activation of Hcrt cells (DIO+DREADD+CNO), and obese with CNO alone (DIO+CNO). *P < 0.05, 1-way ANOVA.
Figure 8
Figure 8. Paradigm depicting the potential consequences of changes that occur in Hcrt cells in obese mice.
These changes can lead to altered activities in neuronal networks downstream of the Hcrt system, which would affect arousal levels as well as animal behaviors governed by the Hcrt system.

Comment in

References

    1. Johnson PM, Kenny PJ. Dopamine D2 receptors in addiction-like reward dysfunction and compulsive eating in obese rats. Nat Neurosci. 2010;13(5):635–641. doi: 10.1038/nn.2519. - DOI - PMC - PubMed
    1. Brown RM, et al. Addiction-like synaptic impairments in diet-induced obesity. Biol Psychiatry. 2017;81(9):797–806. doi: 10.1016/j.biopsych.2015.11.019. - DOI - PMC - PubMed
    1. Sharma S, Fulton S. Diet-induced obesity promotes depressive-like behaviour that is associated with neural adaptations in brain reward circuitry. Int J Obes (Lond) 2013;37(3):382–389. doi: 10.1038/ijo.2012.48. - DOI - PubMed
    1. Dutheil S, Ota KT, Wohleb ES, Rasmussen K, Duman RS. High-fat diet induced anxiety and anhedonia: impact on brain homeostasis and inflammation. Neuropsychopharmacology. 2016;41(7):1874–1887. doi: 10.1038/npp.2015.357. - DOI - PMC - PubMed
    1. Vgontzas AN, Bixler EO, Tan TL, Kantner D, Martin LF, Kales A. Obesity without sleep apnea is associated with daytime sleepiness. Arch Intern Med. 1998;158(12):1333–1337. doi: 10.1001/archinte.158.12.1333. - DOI - PubMed

Publication types

MeSH terms