Multicenter Study
. 2020 Jun 3;61(6):18.
doi: 10.1167/iovs.61.6.18.

Rare Genetic Variants in Complement Factor I Lead to Low FI Plasma Levels Resulting in Increased Risk of Age-Related Macular Degeneration

Affiliations
Multicenter Study

Rare Genetic Variants in Complement Factor I Lead to Low FI Plasma Levels Resulting in Increased Risk of Age-Related Macular Degeneration

Thomas M Hallam et al. Invest Ophthalmol Vis Sci. .

Abstract

Purpose: Rare genetic variants in complement factor I (CFI) that cause low systemic levels of the protein (FI) have been reported as a strong risk factor for advanced age-related macular degeneration (AMD). This study set out to replicate these findings.

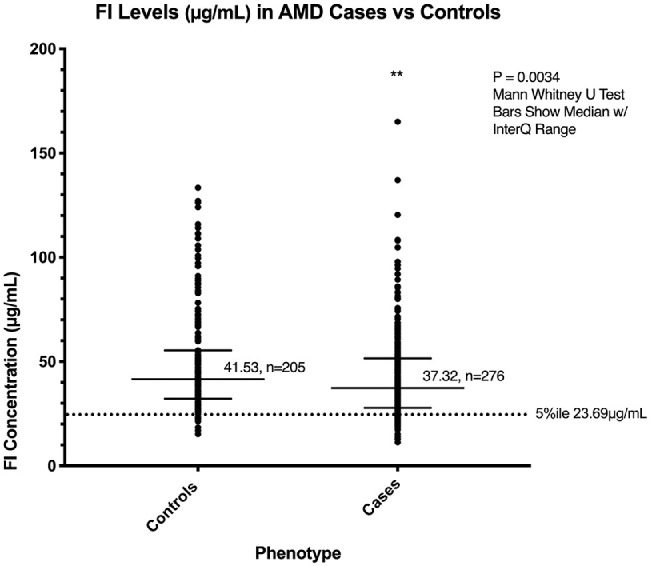
Methods: FI levels were measured by sandwich ELISA in an independent cohort of 276 patients with AMD and 205 elderly controls. Single-nucleotide polymorphism genotyping and Sanger sequencing were used to assess genetic variability.

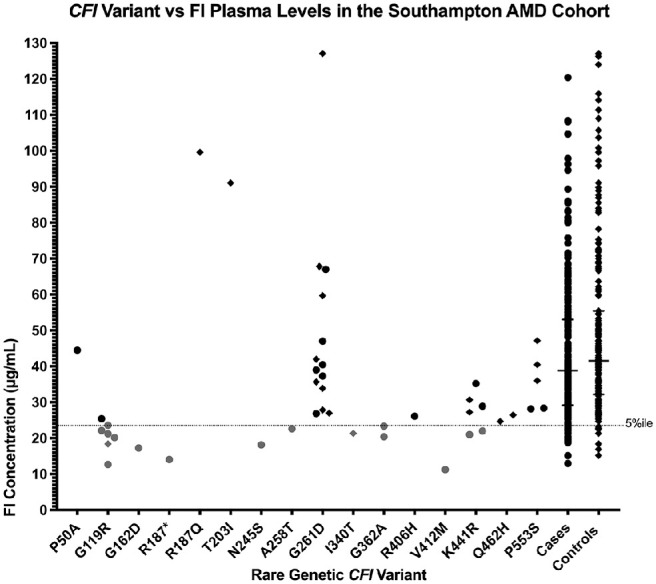
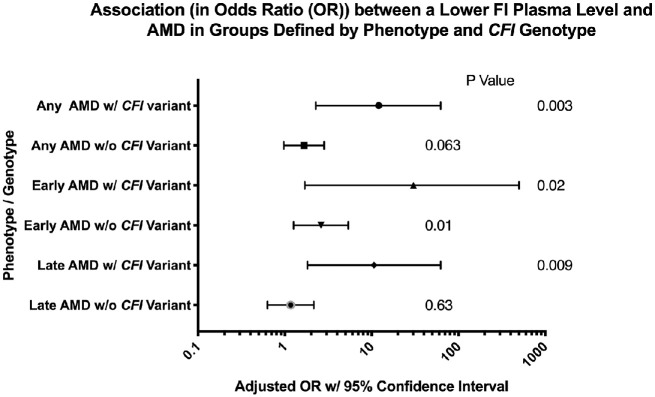
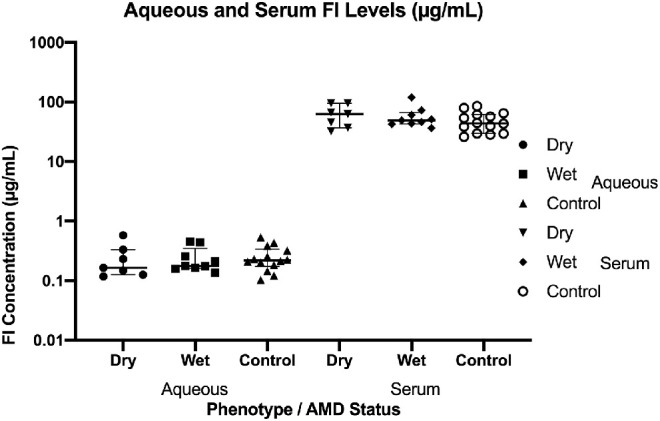
Results: The median FI level was significantly lower in those individuals with AMD and a rare CFI variant (28.3 µg/mL) compared to those with AMD without a rare CFI variant (38.8 µg/mL, P = 0.004) or the control population with (41.7 µg/mL, P = 0.0085) or without (41.5 µg/mL, P < 0.0001) a rare CFI variant. Thirty-six percent of patients with AMD with a rare CFI variant had levels below the fifth percentile, compared to 6% in controls with CFI variants. Multiple regression analyses revealed a decreased FI level associated with a rare CFI variant was a risk factor for AMD (early or late AMD: odds ratio [OR] 12.05, P = 0.03; early AMD: OR 30.3, P = 0.02; late AMD: OR 10.64, P < 0.01). Additionally, measurement of FI in aqueous humor revealed a large FI concentration gradient between systemic circulation and the eye (∼286-fold).

Conclusions: Rare genetic variants in CFI causing low systemic FI levels are strongly associated with AMD. The impermeability of the Bruch's membrane to FI will have implications for therapeutic replacement of FI in individuals with CFI variants and low FI levels at risk of AMD.


Conflict of interest statement

Disclosure: T.M. Hallam, None; K.J. Marchbank, Gemini Therapeutics Ltd (C, F), Freeline Therapeutics (C), MPM Capital (C, R), Catalyst Biosciences (C, F); C.L. Harris, GlaxoSmithKline (C), Roche (C), Admirx (C), Gyroscope Therapeutics (C), Freeline Therapeutics (C), Ra Pharmaceuticals (C, F); C. Osmond, None; V.G. Shuttleworth, None; H. Griffiths, None; A.J. Cree, None; D. Kavanagh, Gyroscope Therapeutics (I, C), Alexion Pharmaceuticals (F, C, R), Novartis (C), Apellis (C); A.J. Lotery, Gyroscope Therapeutics (I, C)

Figures

Figure 1.
Figure 1.
Median factor I levels in patients with AMD and controls. A sandwich ELISA was used to measure the FI level (µg/mL) in the plasma of patients in the Southampton AMD cohort. These levels were measured in triplicate and calculated as an interpolation of OD values on a computer-generated standard curve resulting from 1:2 dilutions of purified FI starting from 1 µg/mL and ending at 0.004 µg/mL. The median level was significantly lower in cases compared to controls (P = 0.0034, interquartile range shown, for 276 cases and 205 controls). A low fifth percentile of 23.69 µg/mL was calculated from the healthy control cohort only and is indicated by the dotted line. **P < 0.01.
Figure 2.
Figure 2.
Plasma factor I levels in patients with AMD and controls by rare CFI variant status. FI levels (in µg/mL) in plasma were significantly lower in AMD cases with CFI variants when compared to all other groups. P values were determined using Dunn's multiple comparisons test. The median and interquartile range are shown by bars. The fifth percentile cutoff point is indicated by the dotted line. *P < 0.05. **P < 0.01. ****P < 0.0001.
Figure 3.
Figure 3.
CFI rare genetic variant versus factor I plasma level. The nonsynonymous genetic variants in CFI identified in the cohort are plotted along the x-axis, while the corresponding plasma FI level (µg/mL) in each patient (case (●), or control (◆)) carrying the given variant in the cohort is displayed on the y-axis. The low fifth percentile is indicated by the dotted line.
Figure 4.
Figure 4.
The association between factor I level, rare CFI variant status, and AMD. Plotted are odds ratios and 95% confidence intervals from six logistic regression models used to predict AMD (any, early, or late) according to whether the patient had a rare CFI variant. Each model is adjusted for age and CRP level, and the odds ratio is per one natural log (ln) unit decrease in FI level (µg/mL). The odds ratios are similar for any, early, and late AMD within the same genotype groups (i.e., with CFI variant or without CFI variant). However, the odds ratios for any and late AMD in the groups with a rare CFI variant (OR 12.05, P = 0.003 and OR 10.6, P = 0.009, respectively) are significantly higher than those in the groups without a CFI variant (OR 1.66, P = 0.06 and OR 1.16, P = 0.63, respectively). The test for the difference in these values, performed using a 1-df chi-squared test has χ2 = 4.93, P = 0.03 and χ2 = 5.378, P = 0.02 for the any AMD cohort and the late AMD cohort, respectively. Statistical significance was reached at *P < 0.05.
Figure 5.
Figure 5.
Concurrent serum and aqueous factor I levels measurement. FI concentrations (µg/mL) were measured in matched aqueous fluid and serum samples in 16 cases (without rare genetic variants) and 14 controls. There were no differences between the mean or median (median displayed with interquartile range, as shown by bars) FI levels in each group in this instance, but the mean values demonstrated a concentration gradient between serum and aqueous humor. The mean concentration gradient [FI Conc. in Serum/FI Conc. in Aqueous] is 322.5-fold (SEM ± 52.07) in cases and 243.6-fold (SEM ± 41.83) in controls. This implies that the blood retinal barrier acts as an impermeable blockade to FI and suggests that the majority of FI present in the eye is secreted by the RPE (or other components of the retina) itself.

References

    1. Wong WL, Su X, Li X, et al. .. Global prevalence of age-related macular degeneration and disease burden projection for 2020 and 2040: a systematic review and meta-analysis. Lancet Glob Health. 2014; 2: e106–e116. - PubMed
    1. Cursiefen C, Chen L, Borges LP, et al. .. VEGF-A stimulates lymphangiogenesis and hemangiogenesis in inflammatory neovascularization via macrophage recruitment. J Clin Invest. 2004; 113: 1040–1050. - PMC - PubMed
    1. Combadière C, Feumi C, Raoul W, et al. .. CX3CR1-dependent subretinal microglia cell accumulation is associated with cardinal features of age-related macular degeneration. J Clin Invest. 2007; 117: 2920–2928. - PMC - PubMed
    1. Maguire MG, Martin DF, Ying G-S, et al. .. Five-year outcomes with anti–vascular endothelial growth factor treatment of neovascular age-related macular degeneration: the comparison of age-related macular degeneration treatments trials. Ophthalmology. 2016; 123: 1751–1761. - PMC - PubMed
    1. Scholl HPN, Issa PC, Walier M, et al. .. Systemic complement activation in age-related macular degeneration. PLoS One. 2008; 3: 1–7. - PMC - PubMed

Publication types

MeSH terms