. 2020 Jul 9;182(1):50-58.e8.
doi: 10.1016/j.cell.2020.05.027. Epub 2020 May 21.

Pathogenesis of SARS-CoV-2 in Transgenic Mice Expressing Human Angiotensin-Converting Enzyme 2

Affiliations

Pathogenesis of SARS-CoV-2 in Transgenic Mice Expressing Human Angiotensin-Converting Enzyme 2

Ren-Di Jiang et al. Cell. .

Abstract

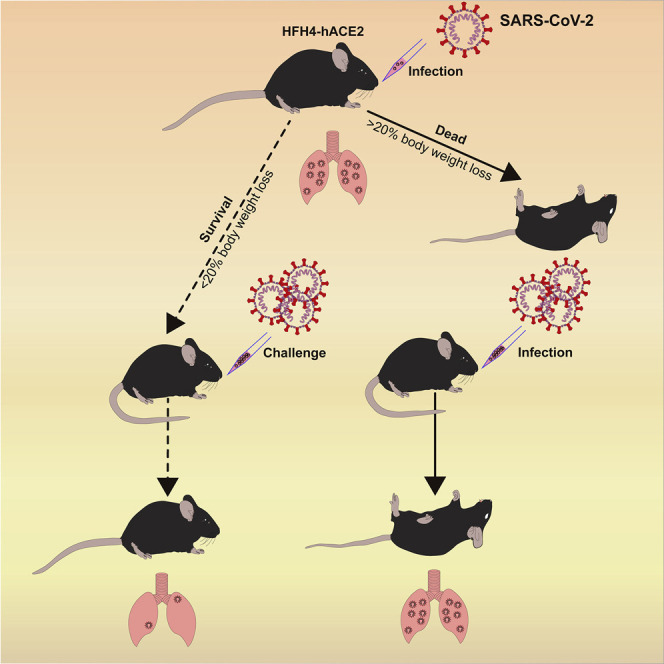
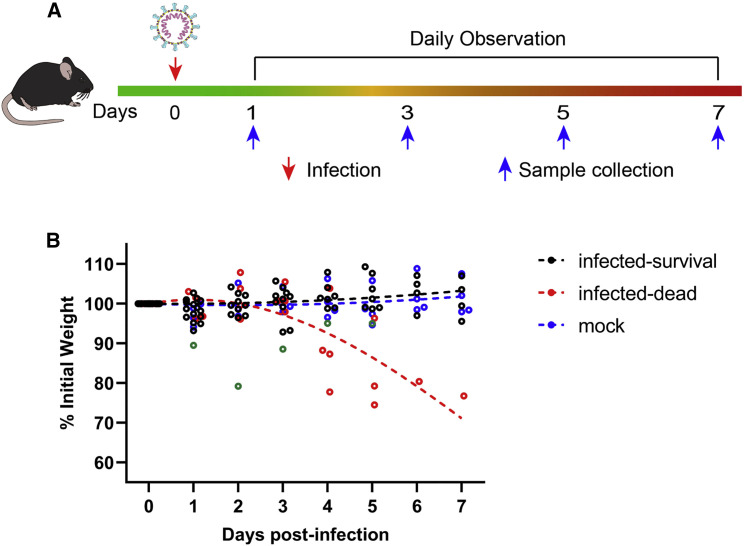
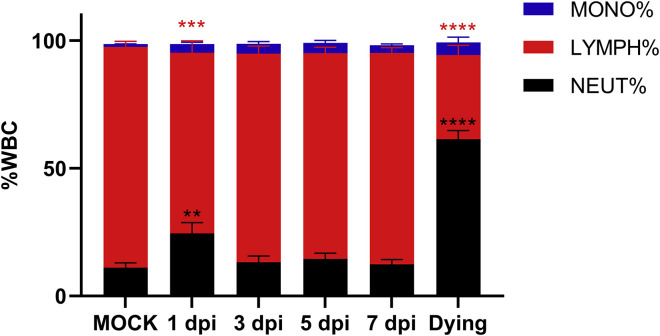
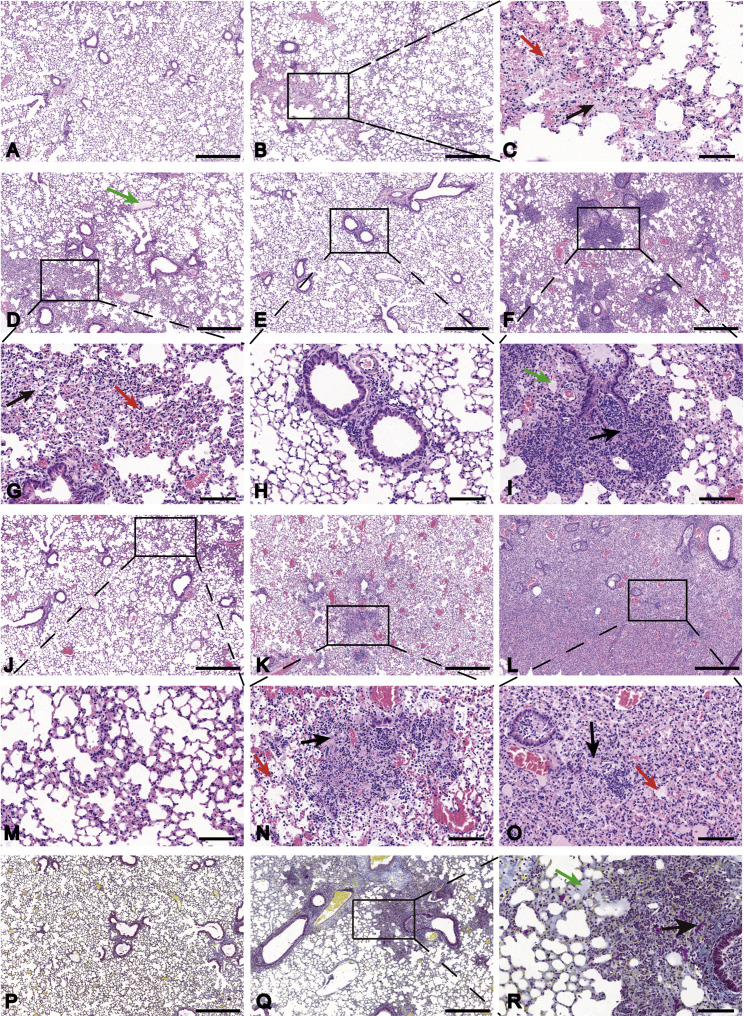
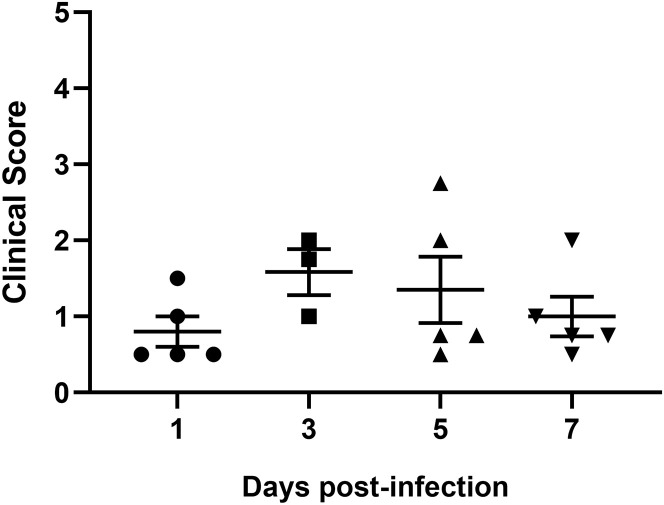
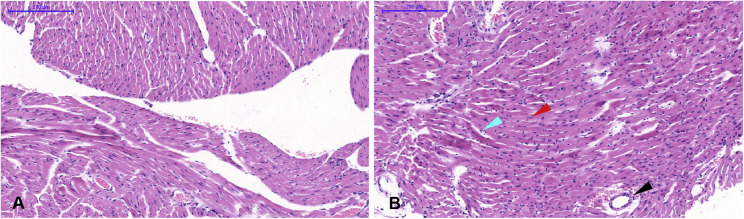
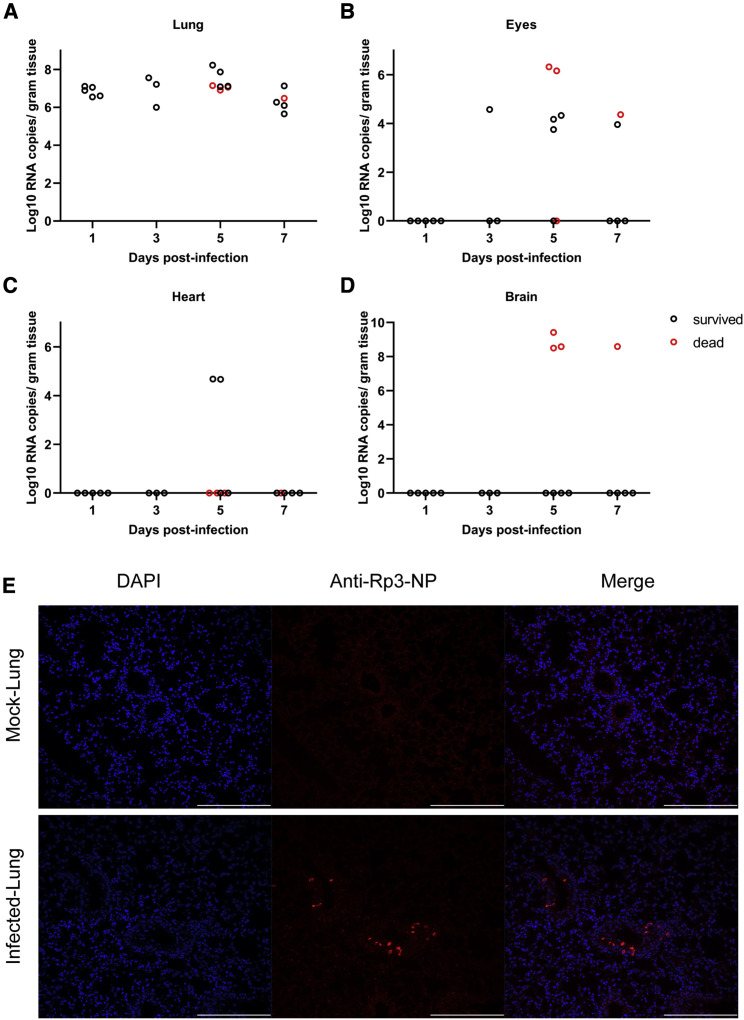
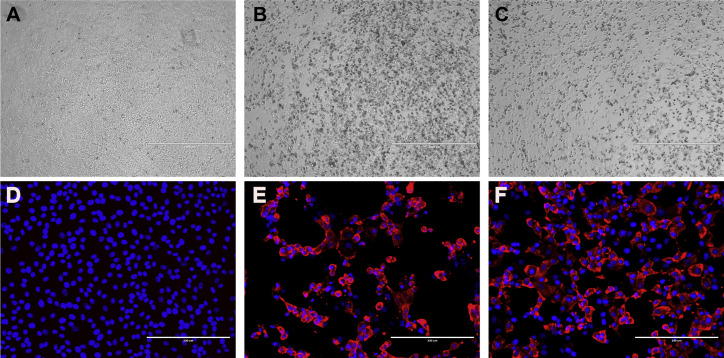
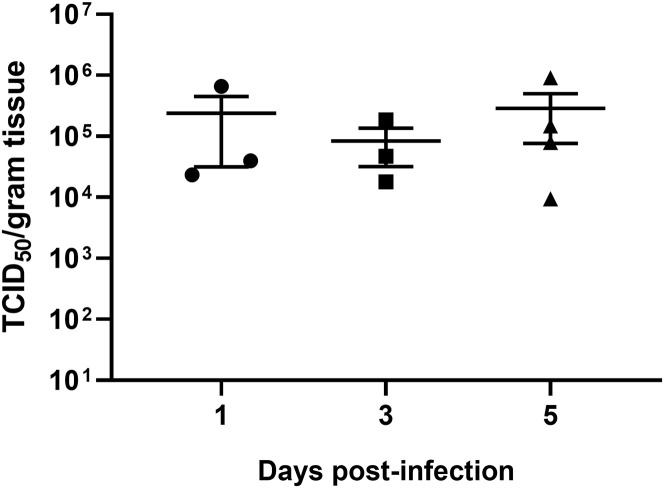
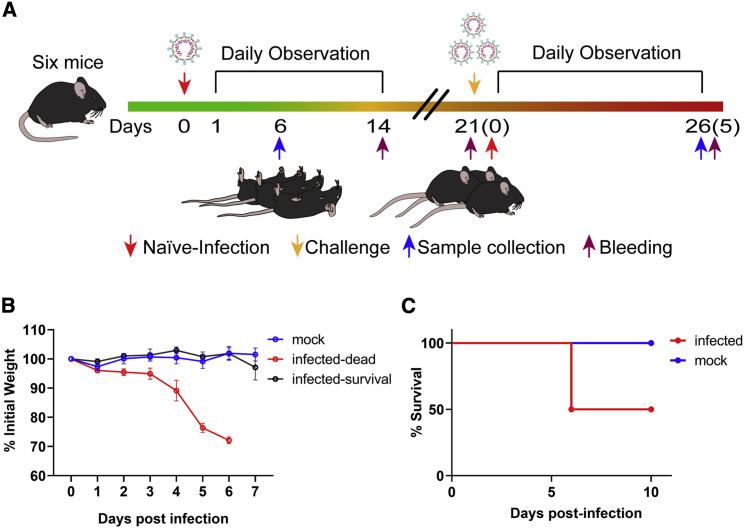
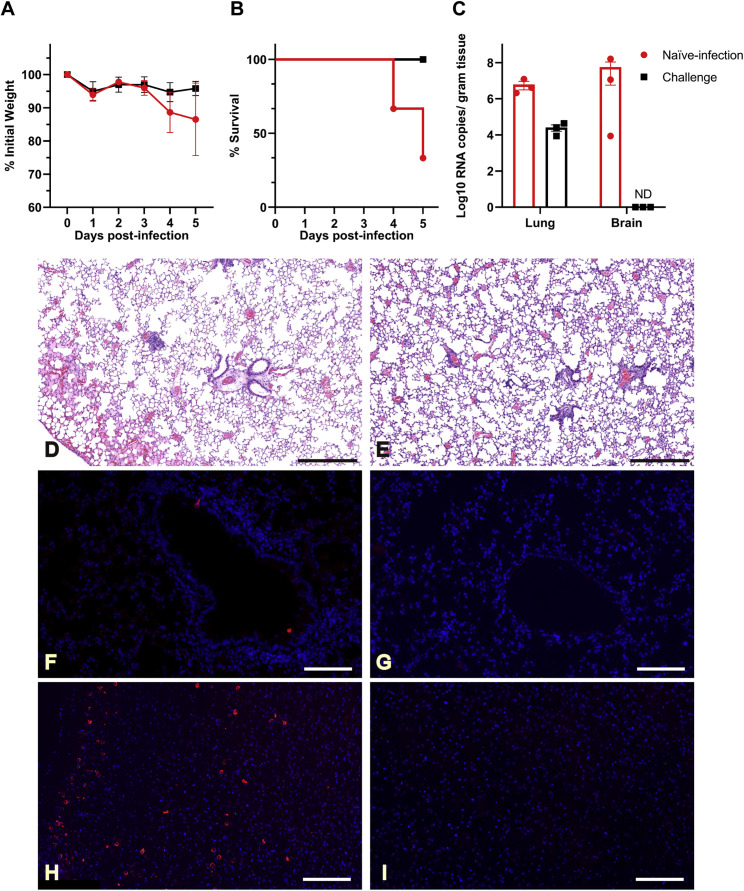
COVID-19 has spread worldwide since 2019 and is now a severe threat to public health. We previously identified the causative agent as a novel SARS-related coronavirus (SARS-CoV-2) that uses human angiotensin-converting enzyme 2 (hACE2) as the entry receptor. Here, we successfully developed a SARS-CoV-2 hACE2 transgenic mouse (HFH4-hACE2 in C3B6 mice) infection model. The infected mice generated typical interstitial pneumonia and pathology that were similar to those of COVID-19 patients. Viral quantification revealed the lungs as the major site of infection, although viral RNA could also be found in the eye, heart, and brain in some mice. Virus identical to SARS-CoV-2 in full-genome sequences was isolated from the infected lung and brain tissues. Last, we showed that pre-exposure to SARS-CoV-2 could protect mice from severe pneumonia. Our results show that the hACE2 mouse would be a valuable tool for testing potential vaccines and therapeutics.

Keywords: COVID-19; SARS-CoV-2; human ACE2 transgenic mouse; pneumonia.


Conflict of interest statement

Declaration of Interests The authors declare no competing interests.

Figures

None
Graphical abstract
Figure 1
Figure 1
Experiment Scheme and Body-Weight Changes in SARS-CoV-2-Infected HFH4-hACE2 Mice (A) Twenty-four HFH4-hACE2 mice were intranasally infected with 3 × 10⁴ TCID50 virus each and sacrificed to collect tissue and blood samples at 1, 3, 5, and 7 days post-infection (DPI). Mouse body weights were monitored for up to 7 days. Each dot represents one mouse at the indicated time point. One mouse showed a rapid body weight decrease with dyspnea beginning on day 2 and then recovered (green dot). Infected mice that died showed noticeable body weight decreases from day 4 to 6 (red dot). (B) Mock-infected (blue dot) and survived mice (black dot) demonstrated normal statuses. The dotted lines represent the fitted curve of each color-indicated group. See also Figure S1 and Tables S1 and S2.
Figure S1
Figure S1
White Blood Cells in Peripheral Blood, Related to Figure 1 and Table S2 Peripheral blood was collected from mock-infected (n = 4) and, virus-infected mice 1 (n = 5), 3 (n = 3), 5 (n = 4) and 7 (n = 4) DPI and three dying (one from the infected group and the other two from the survival test group) mice 6 DPI. The WBC population was measured using ProCyte Dx Hematology Analyzer. Error bars indicate the standard error. Statistical significance was measured by two-way ANOVA compared with the mock infection group. ∗∗p < 0.01, ∗∗∗p < 0.001, ∗∗∗∗p < 0.0001.
Figure 2
Figure 2
Pathological Changes in HFH4-hACE2 Mouse Lung after SARS-CoV-2 Infection Three to six euthanized mice were used to examine the pathological changes in the lungs 1, 3, 5, and 7 DPI, respectively. (A) Mock-infected mice lacked lesions. (B and C) Mouse lung 1 DPI showed multifocal lesion (B) with lymphocyte and macrophage infiltration (C, red arrow) and fibrin exudation (C, black arrow). (D and G) Moderate interstitial pneumonia was observed 3 DPI with hyaline membrane formation (D, green arrow), inflammatory infiltration (G, red arrow), and fibrin exudation (G, black arrow). (E, F, H, I, J–N) Mild peri-bronchial and peri-vascular infiltration were observed 5 DPI (E and H) and 7 DPI (J and M). Some infected mice 5 DPI (F), 7 DPI (K), and at death (L) suffered severe pneumonia with blocked terminal bronchioles, fibroplasia or organization, and hyaline membrane formation (I, green arrow; O, red arrow). Alveolar necrosis (I, N, and O, black arrow) and hyaline thrombus (N, red arrow) were observed in severely infected lungs. Martius Scarlet Blue (MSB) staining was performed to staining fibrin in the lung. (P–R) Mock-infected mice served as control (P). Severely infected mice (Q) show hyaline membrane (R, green arrow) and hyaline thrombus (R, black arrow). Images were collected using a Pannoramic MIDI system. Scale bar: 500 μm (A, B, D–F, J–L, P, and Q) and 100 μm (C, G–I, M–O, and R). See also Figure S2.
Figure S2
Figure S2
Clinical Scores of Lung Pathology, Related to Figure 2 Quantitative scoring of pathology of lung tissues from infected mice 1 (n = 5), 3 (n = 3), 5 (n = 5) and 7 (n = 5) DPI. Error bars indicate the standard error.
Figure S3
Figure S3
Pathological Changes of HFH4-hACE2 Mouse Heart after SARS-CoV-2 Infection, Related to Figure 3 Mock-infected mice (A). Infected mice showed edema in some cardiomyocytes, lymphocyte proliferation (cyan arrow), several necrotic myocytes (red arrow), and vascular edema (black arrow) (B). Scale bar is 200 μm.
Figure 3
Figure 3
Virus Quantification and Antigen Detection in Mice after SARS-CoV-2 Infection (A–D) Viral RNA was quantified using RT-qPCR in mouse tissues collected 1, 3, 5, and 7 DPI. The virus was detected in the mouse lung (A), eyes (B), heart (C), and brain (D). (E) Viral antigen was detected by anti-Rp3-CoV N protein polyclonal antibody (red) in lung bronchi and alveoli collected 1 DPI (G-D1-5) (E). Images were collected using FV1200 confocal microscopy. Scale bar is 200 μm. See also Figures S3, S4, and S5 and Table S3.
Figure S4
Figure S4
Virus Isolation from Infected Mouse Lung and Brain Tissues, Related to Figure 3 and Table S3 Infected mouse lung and brain tissues were homogenized with DMEM, and the supernatant was used to infect Vero E6 cells. CPE was observed in cells infected by the homogenized supernatant of lung (B) and brain (C) but not in mock-infected cells (A). Viral antigen was detected in the cells infected by homogenized supernatant of the lung (E) and brain (F) but not in mock-infected cells (D). Scale bar: 1000 μm (A, B, C) and 200 μm (D, E, F).
Figure S5
Figure S5
Viral Titers in Lung Tissue of Mice after SARS-CoV-2 Infection, Related to Figure 3 Viral titers were determined by the TCID50 assay using VeroE6 cells for mouse lung tissues collected 1 (n = 3), 3 (n = 3) and 5 (n = 4) DPI. The lung samples collected 7 DPI were used for virus isolation. Error bars indicate the standard error.
Figure 4
Figure 4
Experiment Scheme and Mortality of HFH4-hACE2 Mice after SARS-CoV-2 Infection Six hACE2 mice (four males and two females) were intranasally infected with 3 × 10⁴ TCID50 SARS-CoV-2. Body weights and survival were monitored. Three survived mice were observed at 21 days. Then, the three surviving mice and another three healthy mice were intranasally infected with 7 × 10⁵ TCID50 SARS-CoV-2. (A) The number in the parenthesis indicates the DPI of reinfection. (B) Body weights and survival were monitored every day. Body weights decreased quickly, beginning at 4 DPI and led to death, or mice survived in the absence of significant body weight decreases. (C) Three of four male mice died after infection, while two females survived. Error bars indicate the standard error. See also Table S4.
Figure 5
Figure 5
Previous Infection Protected Mice from a Higher Dose of Virus Reinfection Three surviving mice 21 DPI and three previously mock-infected mice were infected with 7 × 10⁵ TCID50 SARS-CoV-2 at 21 DPI, respectively. (A and B) Body weights (A) and survival outcomes (B) were monitored for up to 5 days. (C) Mice were euthanized 5 DPI, and the viral loads were measured using RT-qPCR. (D) Naive-infected mouse lung showed peri-bronchial and peri-vascular infiltration and edema with hyaline membrane formation. (E) In contrast, previously challenged mice presented mild peri-bronchial and peri-vascular infiltration. (F–I) Viral antigen was widely present in the naive-infected mouse lung (F) and brain (H) but barely observed in previously challenged mouse lung (G) and brain (I). Error bars indicate the standard error. ND, not detected. Scale bar: 500 μm (D and E), 100 μm (F and G), and 200 μm (H and I). See also Tables S4 and S5.

References

    1. Chan J.F., Zhang A.J., Yuan S., Poon V.K., Chan C.C., Lee A.C., Chan W.M., Fan Z., Tsoi H.W., Wen L. Simulation of the clinical and pathological manifestations of Coronavirus Disease 2019 (COVID-19) in golden Syrian hamster model: implications for disease pathogenesis and transmissibility. Clin. Infect. Dis. 2020 doi: 10.1093/cid/ciaa325. ciaa325. - DOI - PMC - PubMed
    1. Channappanavar R., Fett C., Mack M., Ten Eyck P.P., Meyerholz D.K., Perlman S. Sex-Based Differences in Susceptibility to Severe Acute Respiratory Syndrome Coronavirus Infection. J. Immunol. 2017;198:4046–4053. - PMC - PubMed
    1. Chen N., Zhou M., Dong X., Qu J., Gong F., Han Y., Qiu Y., Wang J., Liu Y., Wei Y. Epidemiological and clinical characteristics of 99 cases of 2019 novel coronavirus pneumonia in Wuhan, China: a descriptive study. Lancet. 2020;395:507–513. - PMC - PubMed
    1. Cockrell A.S., Leist S.R., Douglas M.G., Baric R.S. Modeling pathogenesis of emergent and pre-emergent human coronaviruses in mice. Mamm. Genome. 2018;29:367–383. - PMC - PubMed
    1. Colavita F., Lapa D., Carletti F., Lalle E., Bordi L., Marsella P., Nicastri E., Bevilacqua N., Giancola M.L., Corpolongo A. SARS-CoV-2 isolation from ocular secretions of a patient with COVID-19 in Italy with prolonged viral RNA detection. Ann. Intern. Med. 2020 doi: 10.7326/M20-1176. - DOI - PMC - PubMed

Publication types

MeSH terms