. 2020 Jul 7;32(1):128-143.e5.
doi: 10.1016/j.cmet.2020.05.003. Epub 2020 Jun 8.

Toll-Like Receptors Induce Signal-Specific Reprogramming of the Macrophage Lipidome

Affiliations

Toll-Like Receptors Induce Signal-Specific Reprogramming of the Macrophage Lipidome

Wei-Yuan Hsieh et al. Cell Metab. .

Abstract

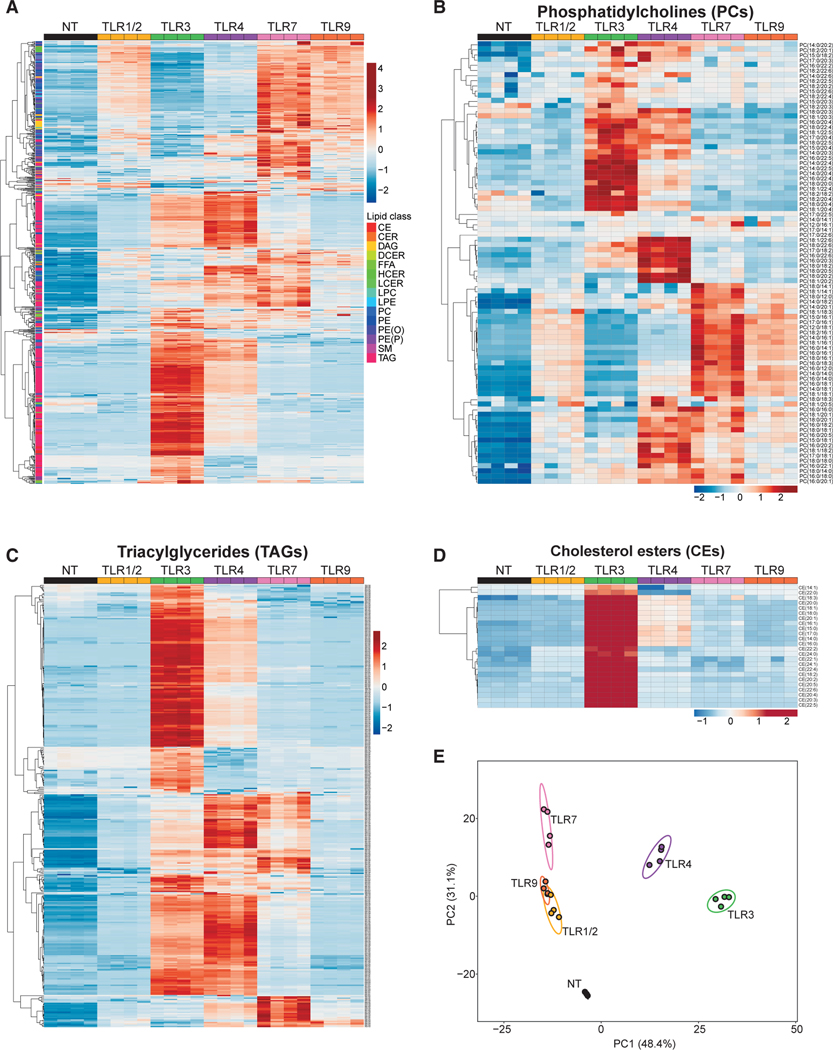
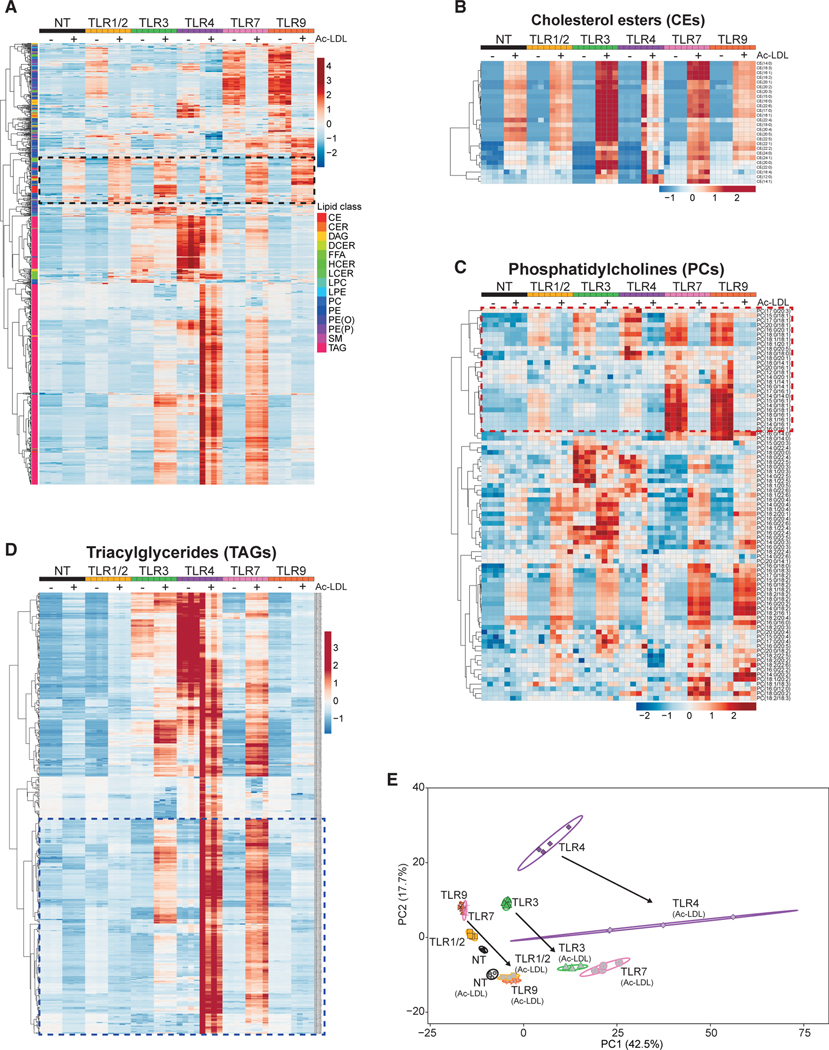
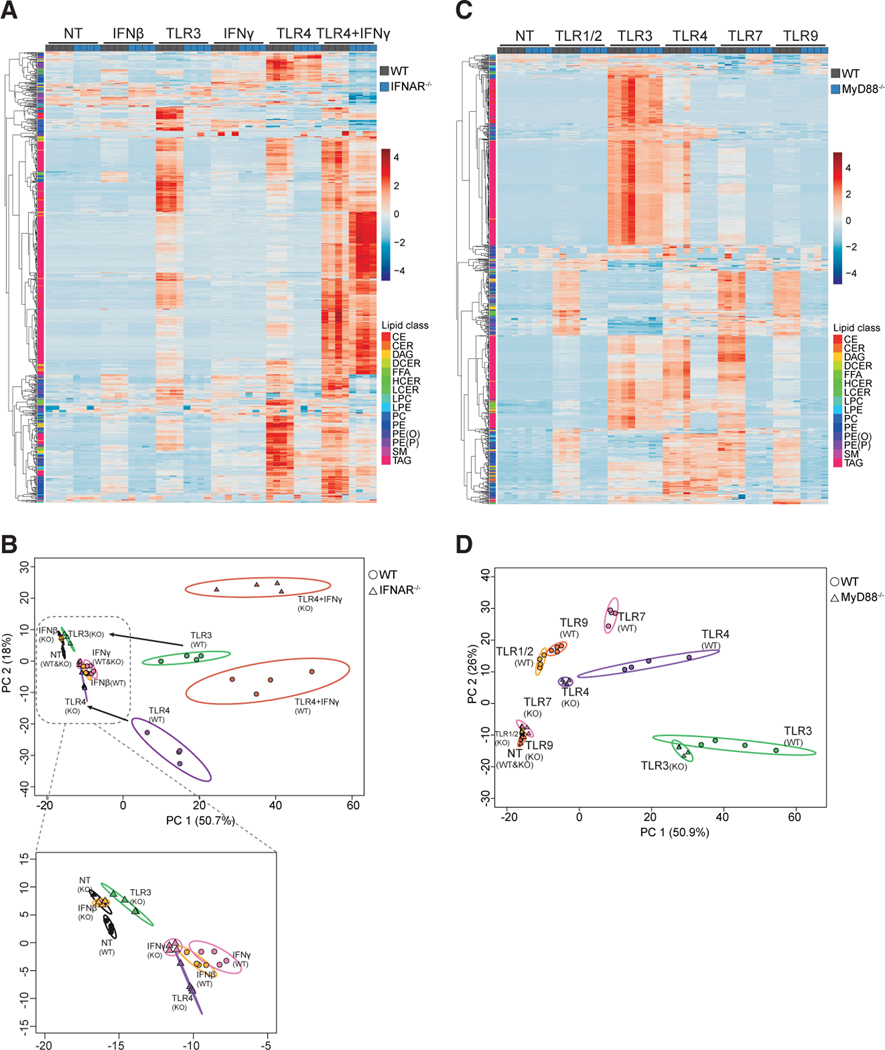
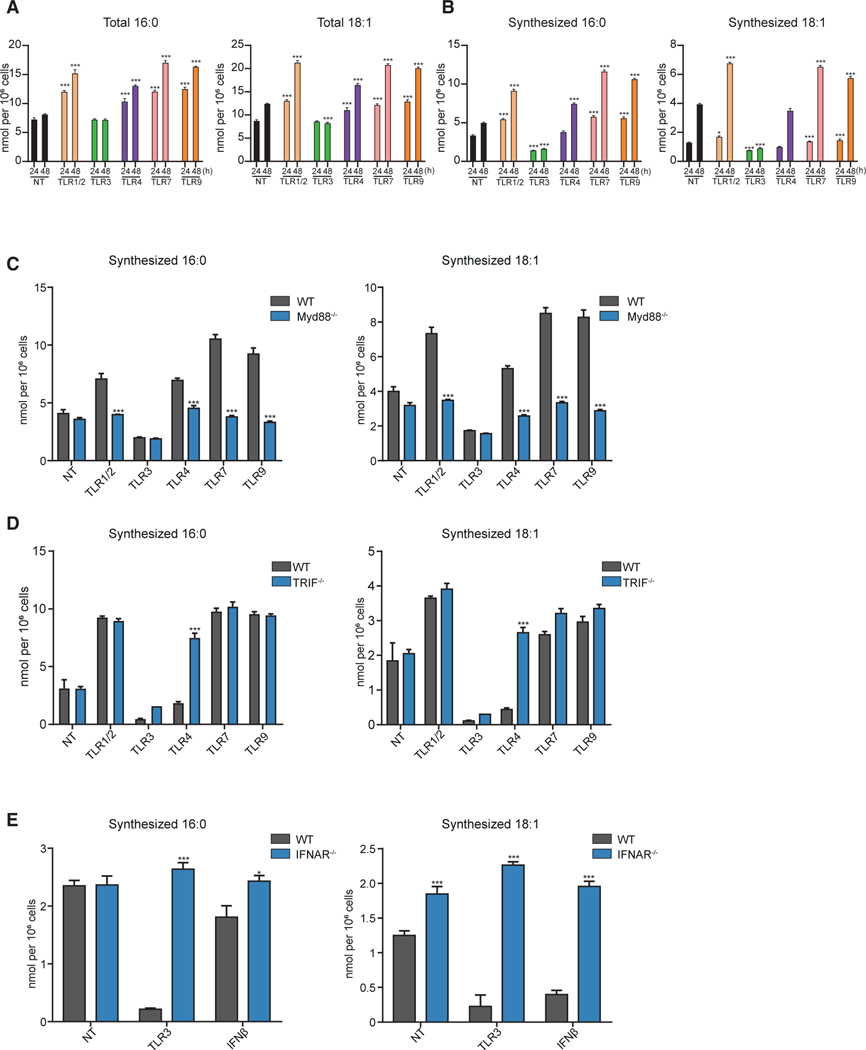
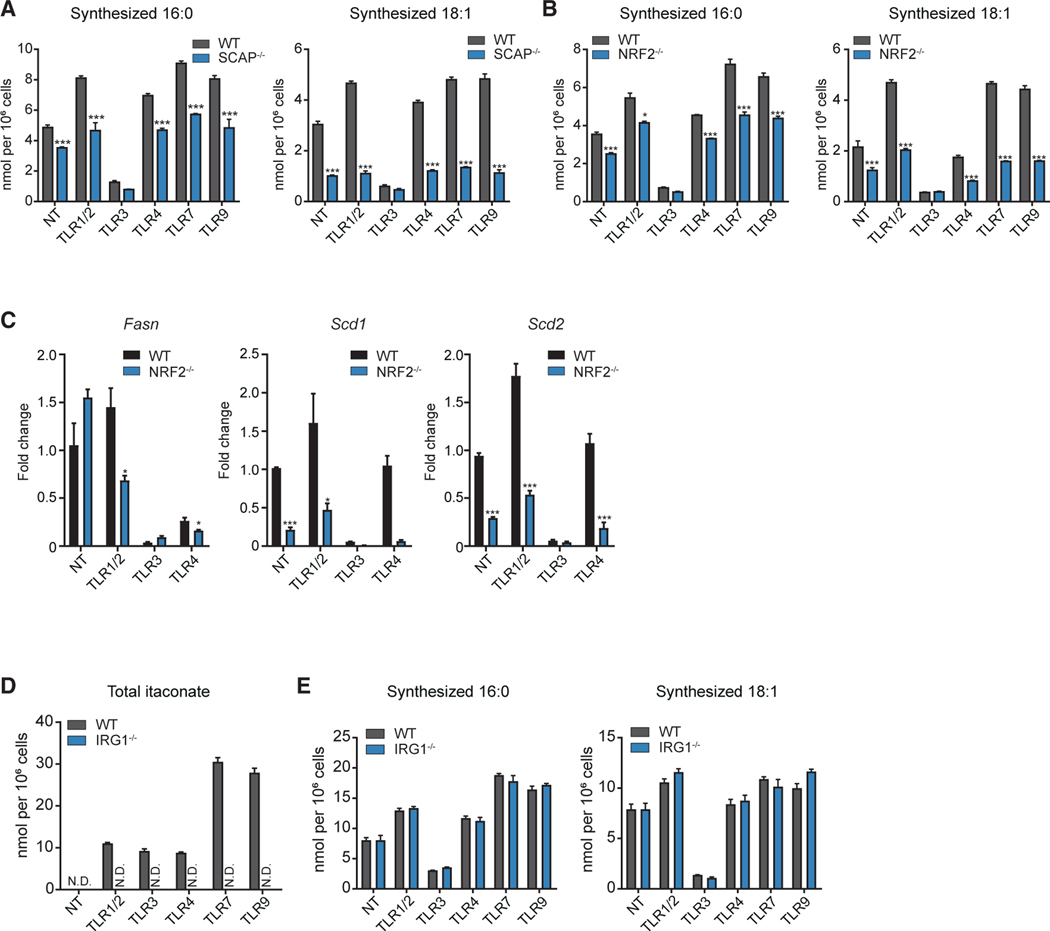
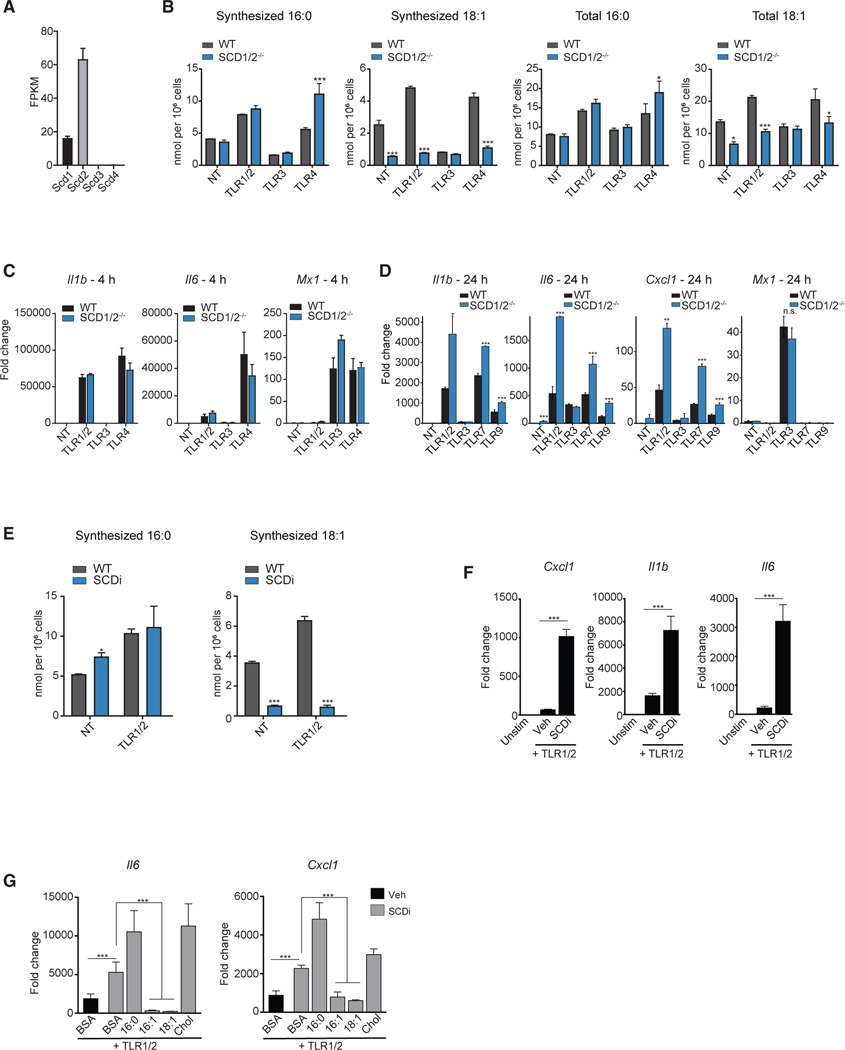
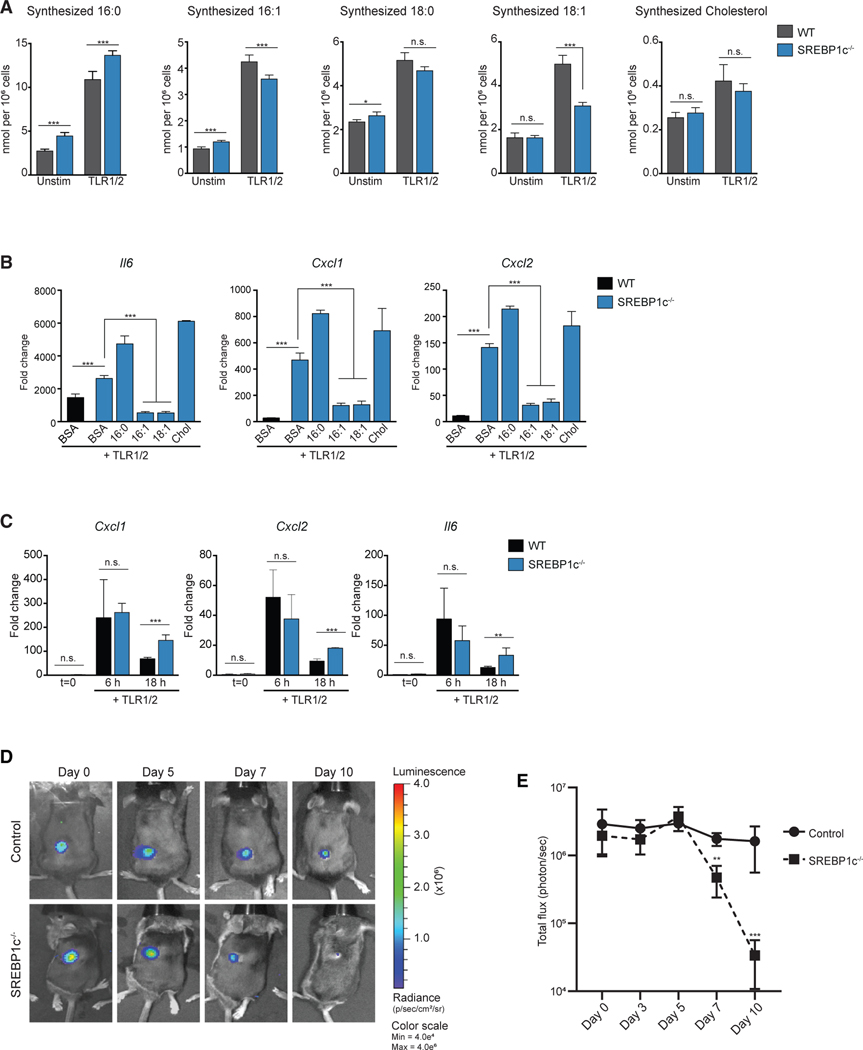
Macrophages reprogram their lipid metabolism in response to activation signals. However, a systems-level understanding of how different pro-inflammatory stimuli reshape the macrophage lipidome is lacking. Here, we use complementary "shotgun" and isotope tracer mass spectrometry approaches to define the changes in lipid biosynthesis, import, and composition of macrophages induced by various Toll-like receptors (TLRs) and inflammatory cytokines. "Shotgun" lipidomics data revealed that different TLRs and cytokines induce macrophages to acquire distinct lipidomes, indicating their specificity in reshaping lipid composition. Mechanistic studies showed that differential reprogramming of lipid composition is mediated by the opposing effects of MyD88- and TRIF-interferon-signaling pathways. Finally, we applied these insights to show that perturbing reprogramming of lipid composition can enhance inflammation and promote host defense to bacterial challenge. These studies provide a framework for understanding how inflammatory stimuli reprogram lipid composition of macrophages while providing a knowledge platform to exploit differential lipidomics to influence immunity.

Keywords: MyD88; acetylated-LDL; host defense; inflammation; interferon; lipidomics; macrophages; stable isotope tracer analysis; stearoyl-CoA desaturase; toll-like receptors.


Conflict of interest statement

Declaration of Interests The authors declare no competing interests.

Figures

Figure 1.
Figure 1.. Distinct Reprogramming of the Macrophage Lipidome by Different TLRs
(A) Heat map of all individual lipids quantified by direct infusion MS analysis of quiescent BMDMs (indicated as NT) or BMDMs stimulated with TLR1/2, TLR3, TLR4, TLR7, or TLR9 agonists for 48 h. (B) Heat map of individual PC species measured by direct infusion MS from BMDMs stimulated as above. (C) Heat map of individual TAG species measured by direct infusion MS from BMDMs stimulated as above. (D) Heat map of individual CE species measured by direct infusion MS from BMDMs stimulated as above. (E) PCA of individual lipids quantified by MS from BMDMs stimulated as above. Percentage of total variance explained by individual principal components indicated in axis. Prediction ellipses are set at 95% probability. All MS experiments and analysis shown are from four biologic replicates per experimental condition. Heatmap scales are Z score for number of deviations away from the row mean. Rows are clustered using correlation distance and complete linkage. Experiments shown are representative of more than three independent studies.
Figure 2.
Figure 2.. Lipid Loading Perturbs TLR-mediated Reprogramming of the Lipidome
(A) Heat map of all individual lipids quantified by direct infusion MS analysis of BMDMs pretreated with acetylated-LDL or stimulated with TLR1/2, TLR3, TLR4, TLR7, or TLR9 agonists for 48 h. Black dashed box denotes changes induced by Ac-LDL loading. (B) Heat map of individual CE species measured by direct infusion MS from BMDMs stimulated as above. (C) Heat m ap of individual PC species measured by direct infusion MS from BMDMs stimulated as above. Red dashed box denotes changes induced by Ac-LDL loading. (D) Heat map of individual TAG species measured by direct infusion MS from BMDMs stimulated as above. Blue dashed box denotes changes induced by Ac-LDL loading. (E) PCA of individual lipids quantified by MS from BMDMs stimulated as above. Percentage of total variance explained by individual principal components indicated in axis. Prediction ellipses are set at 95% probability. Arrows indicate the shift in PCA in response to Ac-LDL loading. All MS experiments and analysis are from four biologic replicates per experimental condition. Heatmap scales are Z score for number of deviations away from the row mean. Rows are clustered using correlation distance and complete linkage.
Figure 3.
Figure 3.. Type I IFN and MyD88 Signaling Are Required to Drive Distinct Aspects of Lipidomic Reprogramming
(A) Heat map of all individual lipids quantified by direct infusion MS analysis of WT control or IFNAR−/− BMDMs stimulated with TLR3, TLR4 agonists, or IFNβ, IFNγ, or IFNγ + TLR4 agonist for 48 h. (B) PCA of individual lipids quantified by MS from WT control or IFNAR−/− BMDMs (designated as O or Δ, respectively) stimulated with indicated TLR agonists and/or cytokine for 48 h. Arrows indicate the shift of IFNAR−/− samples from controls in PCA stimulated with indicated TLR agonist. Inset of PCA provided to show the small changes induced by cytokines or TLR3 agonist. Percentage of total variance explained by individual principal components indicated in axis. Prediction ellipses are set at 95% probability. (C) Heat map of all individual lipids quantified by direct infusion (“shotgun”) MS analysis of WT control or MyD88−/− BMDMs stimulated with TLR1/2, TLR3, TLR4, TLR7, or TLR9 agonists for 48 h. (D) PCA of individual lipids quantified by MS from WT control or MyD88−/− BMDMs (designated as O or Δ, respectively) stimulated with TLR agonists as indicated for 48 h. Arrows indicate the shift of MyD88−/− samples from WT controls in PCA stimulated with indicated TLR agonist. Percentage of total variance explained by individual principal components indicated in axis. Prediction ellipses are set at 95% probability. All MS experiments and analysis are from four independent biologic replicates per experimental condition. Heatmap scales are Z score for number of deviations away from the row mean. Rows are clustered using correlation distance and complete linkage.
Figure 4.
Figure 4.. TLRs Promote Divergent Fatty Acid Synthetic Programs
(A) Total palmitic acid (16:0) and oleic acid (18:1) from quiescent BMDMs (indicated as NT) and BMDMs stimulated with TLR1/2, TLR3, TLR4, TLR7, or TLR9 agonists for either 24 or 48 h. (B) Net synthesized palmitic acid (16:0) and oleic acid (18:1) quiescent BMDMs (NT) or BMDMs stimulated with TLR1/2, TLR3, TLR4, TLR7, or TLR9 agonists for either 24 or 48 h. (C) Net synthesized palmitic acid (16:0) and oleic acid (18:1) from quiescent control or MyD88−/− BMDMs and BMDMs stimulated with TLR1/2, TLR3, TLR4, TLR7, or TLR9 agonists for 48 h. (D) Net synthesized of palmitic acid (16:0) and oleic acid (18:1) from quiescent WT control or TRIF−/− BMDMs, and stimulated with TLR1/2, TLR3, TLR4, TLR7, or TLR9 agonists for 48 h. (E) Net synthesized palmitic acid (16:0) and oleic acid (18:1) in control or IFNAR−/− BMDMs stimulated with TLR3 agonist or IFNβ for 48 h. All isotope labeling experiments are from four biologic replicates per experimental condition. All data are presented as mean ± SEM. *p < 0.05; **p < 0.01, ***p < 0.001. Experiments shown are representative of more than three independent studies.
Figure 5.
Figure 5.. NRF2/SREBP Axis Sets Basal and TLR Inducible Lipogenesis in Macrophages
(A) Net synthesized palmitic acid (16:0) and oleic acid (18:1) from WT control and SCAP−/− BMDMs stimulated with TLR1/2, TLR3, TLR4, TLR7, TLR9 agonists, or not treated (NT) for 48 h. (B) Net synthesized palmitic acid (16:0) and oleic acid (18:1) from WT control and NRF2−/− BMDMs stimulated with TLR1/2, TLR3, TLR4, TLR7, TLR9 agonists, or not treated (NT) for 48 h. (C) qPCR analysis of Fasn, Scd1, and Scd2 gene expression from WT control or NRF2−/− BMDMs stimulated with TLR1/2, TLR3, TLR4 agonists or not-treated (NT) for 24 h. (D) MS analysis of itaconate from WT control or IRG1−/− BMDMs stimulated with TLR1/2, TLR3, TLR4, TLR7, TLR9 agonists or not treated (NT) for 24 h. (E) Net synthesized palmitic acid (16:0) and oleic acid (18:1) in WT control or IRG1−/− BMDMs stimulated with TLR1/2, TLR3, TLR4 agonists or not-treated (NT) for 48 h. All isotope labeling experiments are from four independent replicates per experimental condition and are representative of greater than three experiments. Gene expression studies are from three biologic replicates per experimental condition and are representative of greater than three experiments. All data are presented as mean ± SEM. *p < 0.05; **p < 0.01, ***p < 0.001.
Figure 6.
Figure 6.. Perturbing MUFA Synthesis Prolongs MyD88-Mediated Inflammation
(A) FPKM values of Scd transcripts in quiescent BMDMs. (B) Net synthesized and total palmitic acid (16:0) and oleic acid (18:1) from WT control or SCD1/2−/− BMDMs stimulated with TLR1/2, TLR3, TLR4, TLR7, TLR9 agonists or not treated (NT) for 48 h. (C) qPCR analysis of Il1b, Il6, and Mx1 gene expression in WT control or SCD1/2−/− BMDMs stimulated with TLR1/2, TLR3, TLR4 agonists or not-treated for 4 h. (D) qPCR analysis of CXCL1, Il1b, Il6, and Mx1 gene expression in WT control or SCD1/2−/− BMDMs stimulated with TLR1/2, TLR3, TLR7, TLR9 agonists or not-treated for 24 h. (E) Net synthesized palmitic acid (16:0) and oleic acid (18:1) in BMDMs stimulated with TLR1/2 ± SCDi for 48 h. (F) qPCR analysis of CXCL1, Il1b, and Il6 gene expression in BMDMs stimulated with TLR1/2 ± SCDi for 24 h. (G) qPCR analysis of Il6, and CXCL1 gene expression in BMDMs stimulated with TLR1/2 ± SCDi (10 nM) ± BSA-conjugated 16:0, 16:1, or 18:1 fatty acids, or cholesterol for 24 h. FPKM values of Scd transcripts from five independent RNA-sequencing experiments. All isotope labeling experiments are from four biologic replicates per experimental condition and are representative of greater than three experiments. Gene expression studies are from three biologic replicates per experimental condition and are representative of greater than three experiments. Data are presented as mean ± SEM. *p < 0.05; **p < 0.01, ***p < 0.001.
Figure 7.
Figure 7.. Upregulation of SREBP1c Is Required for MUFA Flux to Control Inflammation
(A) Net synthesized palmitic acid (16:0), palmitoleic acid (16:1), stearic acid (18:0), oleic acid (18:1), and cholesterol from WT control or SREBP1c−/− BMDMs stimulated with TLR1/2 agonist. (B) qPCR analysis of inflammatory gene expression from WT control or SREBP1c−/− BMDMs stimulated with TLR1/2 agonist ± BSA-conjugated 16:0, 16:1, or 18:1 fatty acids, or cholesterol for 24 h. (C) qPCR analysis of inflammatory gene expression from cells collected by peritoneal lavage from WT control or SREBP1c−/− mice injected (intraperitoneal) with TLR1/2 agonist for 6 h and 18 h. (D) Time course bioluminescence images from a representative WT control and SREBP1c−/− mouse from day 0 (immediately post-infection) through day 10 post-infection challenged with the bioluminescent strain of Staphylococcus aureus (Xen36). (E) Time course quantification of total flux (photons/sec) from WT control or SREBP1c−/− mice infected with bioluminescent S. aureus. All isotope labeling experiments are from four biologic replicates per experimental condition and representative of greater than three experiments. Gene expression studies are from three biologic replicates per experimental condition and are representative of greater than three experiments. In vivo experiments with S. aureus infections or TLR1/2 agonists are representative of four independent experiments. All data are presented as mean ± SEM. *p < 0.05; **p < 0.01, ***p < 0.001.

References

    1. Ackerman D, Tumanov S, Qiu B, Michalopoulou E, Spata M, Azzam A, Xie H, Simon MC, and Kamphorst JJ (2018). Triglycerides promote lipid homeostasis during hypoxic stress by balancing fatty acid saturation. Cell Rep. 24, 2596–2605.e5. - PMC - PubMed
    1. Araldi E, Fernández-Fuertes M, Canfrán-Duque A, Tang W, Cline GW, Madrigal-Matute J, Pober JS, Lasunción MA, Wu D, Fernández-Hernando C, and Suárez Y (2017). Lanosterol modulates TLR4-mediated innate immune responses in macrophages. Cell Rep. 19, 2743–2755. - PMC - PubMed
    1. Argus JP, Wilks MQ, Zhou QD, Hsieh WY, Khialeeva E, Hoi XP, Bui V, Xu S, Yu AK, Wang ES, et al. (2018). Development and application of FASA, a model for quantifying fatty acid metabolism using stable isotope labeling. Cell Rep. 25, 2919–2934.e8. - PMC - PubMed
    1. Bambouskova M, Gorvel L, Lampropoulou V, Sergushichev A, Loginicheva E, Johnson K, Korenfeld D, Mathyer ME, Kim H, Huang LH, et al. (2018). Electrophilic properties of itaconate and derivatives regulate the IκBz-ATF3 inflammatory axis. Nature 556, 501–504. - PMC - PubMed
    1. Barnett KC, Coronas-Serna JM, Zhou W, Ernandes MJ, Cao A, Kranzusch PJ, and Kagan JC (2019). Phosphoinositide interactions position cGAS at the plasma membrane to ensure efficient distinction between self- and viral DNA. Cell 176, 1432–1446.e11. - PMC - PubMed

Publication types

Substances