Review
. 2020 Jun 5;11(6):624.
doi: 10.3390/genes11060624.

Evolution of the T-Cell Receptor (TR) Loci in the Adaptive Immune Response: The Tale of the TRG Locus in Mammals

Affiliations
Review

Evolution of the T-Cell Receptor (TR) Loci in the Adaptive Immune Response: The Tale of the TRG Locus in Mammals

Rachele Antonacci et al. Genes (Basel). .

Abstract

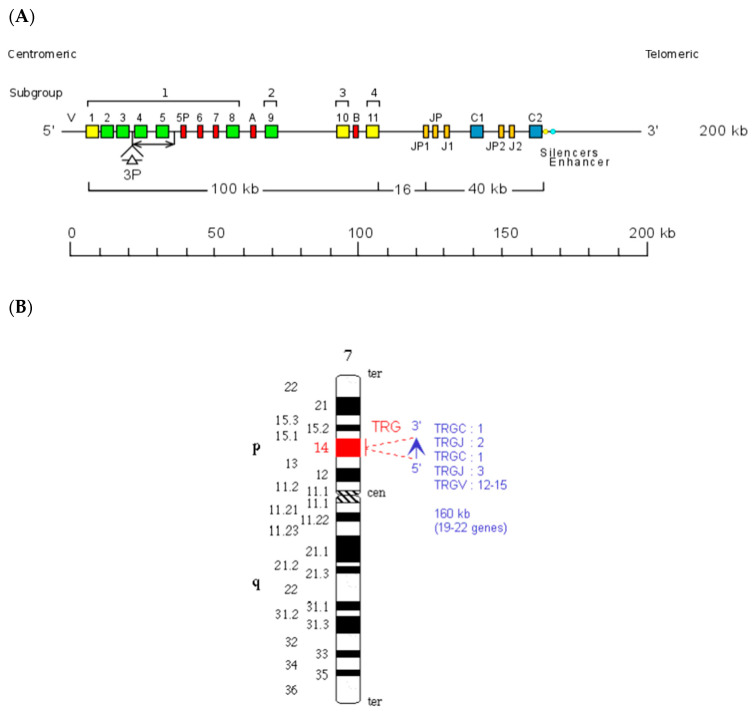
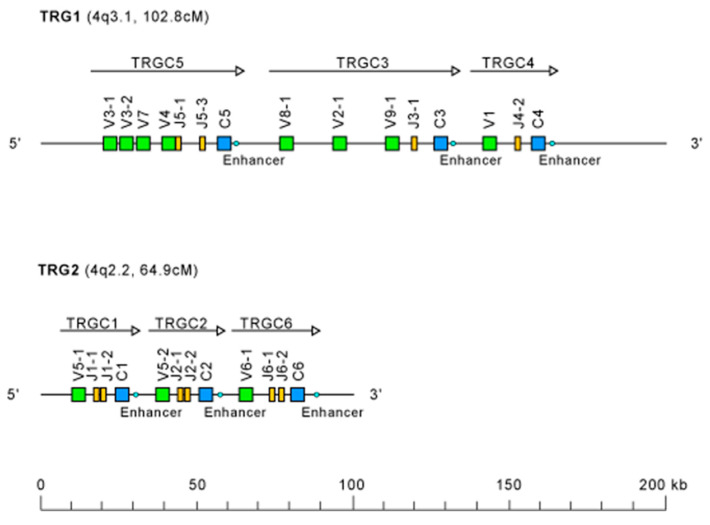
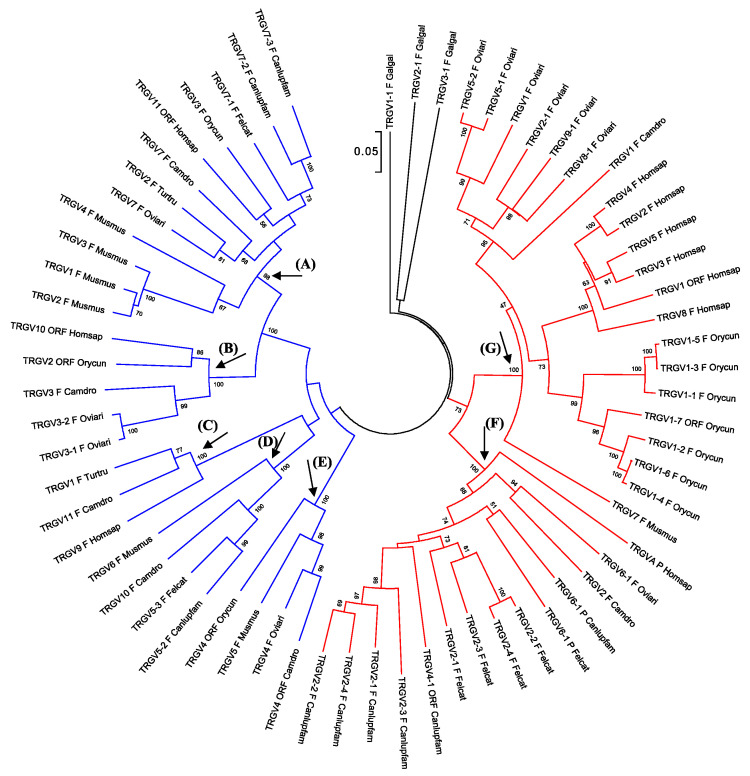
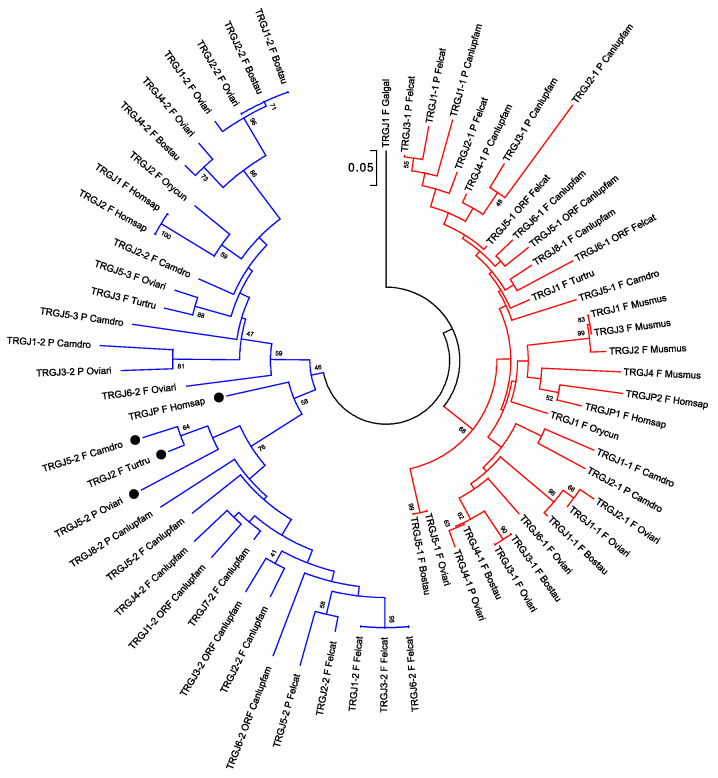
T lymphocytes are the principal actors of vertebrates' cell-mediated immunity. Like B cells, they can recognize an unlimited number of foreign molecules through their antigen-specific heterodimer receptors (TRs), which consist of αβ or γδ chains. The diversity of the TRs is mainly due to the unique organization of the genes encoding the α, β, γ, and δ chains. For each chain, multi-gene families are arranged in a TR locus, and their expression is guaranteed by the somatic recombination process. A great plasticity of the gene organization within the TR loci exists among species. Marked structural differences affect the TR γ (TRG) locus. The recent sequencing of multiple whole genome provides an opportunity to examine the TR gene repertoire in a systematic and consistent fashion. In this review, we report the most recent findings on the genomic organization of TRG loci in mammalian species in order to show differences and similarities. The comparison revealed remarkable diversification of both the genomic organization and gene repertoire across species, but also unexpected evolutionary conservation, which highlights the important role of the T cells in the immune response.

Keywords: IMGT; T cell receptor; TRG genes; TRG locus; evolution; immunogenomics; mammals.


Conflict of interest statement

The authors declare no conflict of interest.

Figures

Figure 1
Figure 1
Human (Homo sapiens) TRG locus representation (A) and chromosomal localization (B), reproduced with permission from IMGT® (http://www.imgt.org). In (A), colors are according to IMGT color menu for genes (https://www.imgt.org/IMGTScientificChart/RepresentationRules/colormenu.php#LOCUS). The boxes representing the genes are not to scale. Exons are not shown. A double arrow indicates insertion/deletion polymorphisms. The Amphiphysin (AMPH) (IMGT 5′ borne) was identified 16 kb upstream of TRGV1 (ORF), the most 5′ gene in the locus, and the Related to steroidogenic acute regulatory protein D3-N-terminal like (STARD3NL) (3′ IMGT borne) was identified 9.4 kb downstream of TRGC2 (F), the most 3′ gene in the locus. In (B), a vertical red line indicates the localization of the TRG locus at 7p14. A blue arrow indicates the orientation 5′ → 3′ of the locus, and the gene group order in the locus. The blue arrow is proportional to the size of the locus, indicated in kilobases (kb). The total number of genes in the locus is shown in parentheses.
Figure 2
Figure 2
Sheep (Ovis aries) TRG locus representation, reproduced with permission from IMGT® (http://www.imgt.org). The TRG genes are organized in two loci on Chromosome 4. Colors are according to IMGT color menu for genes (https://www.imgt.org/IMGTScientificChart/RepresentationRules/colormenu.php#LOCUS). The boxes representing the genes are not to scale. Exons are not shown. Arrows indicate the TRGC cassettes and the transcriptional orientation of their genes.
Figure 3
Figure 3
Evolutionary relationships of the eutherian mammalian TRGV genes. The TRGV as well as the TRGJ (Figure 4) and TRGC (Figure 5) gene sequences used for the phylogenetic analysis were retrieved from the IMGT® database (IMGT Repertoire, http://www.imgt.org) if annotated, or from the GenBank database using the accession numbers reported in the reference articles listed in Table 2 and Table 4. Chicken (Galgal) TRG genes were used as the outgroup [66]. For simplicity, we included in the analysis the TRGV genes belonging to a single species for each mammalian suborder in which the genomic organization of the TRG locus has been inferred. One member gene for each of the chicken (Galgal) TRGV subgroups was used as an outgroup. Multiple alignments of the V-region nucleotide sequences of functional genes and in-frame pseudogenes were carried out with the MUSCLE program [111]. The evolutionary analyses were conducted in MEGA7 [112]. We used the neighbor-joining (NJ) method to reconstruct the phylogenetic tree [113]. The percentage of replicate trees in which the associated taxa clustered together in the bootstrap test (100 replicates) is shown next to the branches [114]. The trees are drawn to scale, with branch lengths in the same units as those of the evolutionary distances used to infer the phylogenetic trees. The evolutionary distances were computed using the p-distance method [115], and the units are the number of base differences per site. The analysis involved 66 nucleotide sequences. All positions containing gaps and missing data were eliminated. There were a total of 176 positions in the final dataset. Monophyletic groupings described in the text are indicated by capital letters. The blue and red branches of the tree highlight two major groupings of the mammalian genes. The IMGT six-letter standardized abbreviations for species (Homsap (human), Musmus (mouse), Felcat (cat), Oviari (sheep), Camdro (dromedary), Turtru (dolphin), Orycun (rabbit)) and nine-letter abbreviations for subspecies (Canlupfam, dog) taxa are used.
Figure 4
Figure 4
Evolutionary relationships of the eutherian mammalian TRGJ genes. The TRGJ coding sequences of all mammalian species were included in the tree. A chicken (Galgal) TRGJ gene was used as outgroup [66]. Multiple alignments of the gene sequences were carried out using the MUSCLE program [111]. The evolutionary analyses were conducted in MEGA7 [112]. We used the neighbor-joining (NJ) method to reconstruct the phylogenetic tree [113]. The percentage of replicate trees in which the associated taxa clustered together in the bootstrap test (100 replicates) is shown next to the branches [114]. The trees are drawn to scale, with branch lengths in the same units as those of the evolutionary distances used to infer the phylogenetic trees. The evolutionary distances were computed using the p-distance method [115] and the units are the number of base differences per site. The analysis involved 67 nucleotide sequences. All positions containing gaps and missing data were eliminated. There were a total of 39 positions in the final dataset. The C-proximal TRGJ genes are shown in red; the C-distal TRGJ genes are shown in blue. The TRGJ genes occupying the middle position of the J cluster formed by three genes within each own TRG locus are marked with a black circle. The IMGT six-letter standardized abbreviations for species (Homsap (human), Musmus (mouse), Felcat (cat), Bostau (bovine), Oviari (sheep), Camdro (dromedary), Turtru (dolphin), Orycun (rabbit)) and nine-letter standardized abbreviation for subspecies (Canlupfam, dog) taxa are used.
Figure 5
Figure 5
Phylogenetic relationships of the eutherian mammalian TRGC genes. The TRGC coding nucleotide sequences from the different eutherian mammals were combined in the same alignment. The chicken (Galgal) TRGC gene was used as outgroup [66]. Multiple alignments of the gene sequences were carried out using the MUSCLE program [111]. The evolutionary analyses were conducted in MEGA7 [112]. We used the neighbor-joining (NJ) method to reconstruct the phylogenetic tree [113]. The percentage of replicate trees in which the associated taxa clustered together in the bootstrap test (100 replicates) is shown next to the branches [114]. The trees are drawn to scale, with branch lengths in the same units as those of the evolutionary distances used to infer the phylogenetic trees. The evolutionary distances were computed using the p-distance method [115] and the units are the number of base differences per site. The analysis involved 38 nucleotide sequences. All positions containing gaps and missing data were eliminated. There were a total of 324 positions in the final dataset. The IMGT six-letter standardized abbreviations for species (Homsap (human), Musmus (mouse), Felcat (cat), Bostau (bovine), Oviari (sheep), Camdro (dromedary), Turtru (dolphin), Orycun (rabbit)) and nine-letter standardized abbreviations for subspecies (Canlupfam, dog) taxa are used.

References

    1. Lefranc M.-P., Lefranc G. The T Cell Receptor FactsBook. Academic Press. Harcourt Science and Technology Company; San Diego, CA, USA: 2001.
    1. Lefranc M.-P. Immunoglobulin and T Cell Receptor Genes: IMGT® and the Birth and Rise of Immunoinformatics. Front. Immunol. 2014;5:22. doi: 10.3389/fimmu.2014.00022. - DOI - PMC - PubMed
    1. Janeway C.A., Jones B., Hayday A. Specificity and function of T cells bearing γδ receptors. Immunol. Today. 1988;9:73–76. doi: 10.1016/0167-5699(88)91267-4. - DOI - PubMed
    1. Sowder J.T., Yazawa C., Ager L.L., Chan M.M., Cooper M. A large subpopulation of avian T cells express a homologue of the mammalian T gamma/delta receptor. J. Exp. Med. 1988;167:315–322. doi: 10.1084/jem.167.2.315. - DOI - PMC - PubMed
    1. Hein W.R., MacKay C.R. Prominence of T-cell in the ruminant immune system. Immunol. Today. 1991;12:30–34. doi: 10.1016/0167-5699(91)90109-7. - DOI - PubMed

Publication types

Substances

LinkOut - more resources