. 2020 Jun 23;117(25):14243-14250.
doi: 10.1073/pnas.2001255117. Epub 2020 Jun 9.

Cell-size regulation in budding yeast does not depend on linear accumulation of Whi5

Affiliations

Cell-size regulation in budding yeast does not depend on linear accumulation of Whi5

Felix Barber et al. Proc Natl Acad Sci U S A. .

Abstract

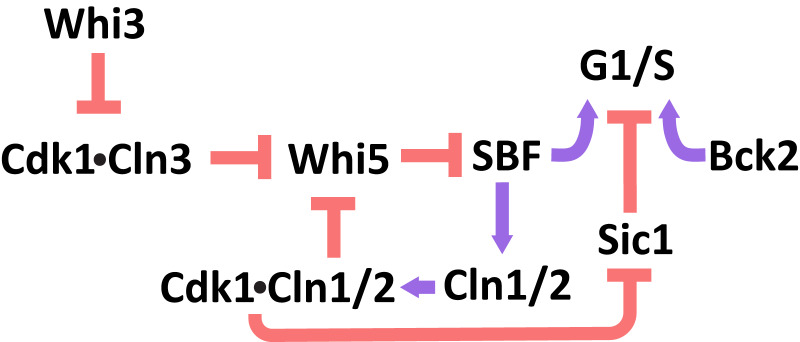
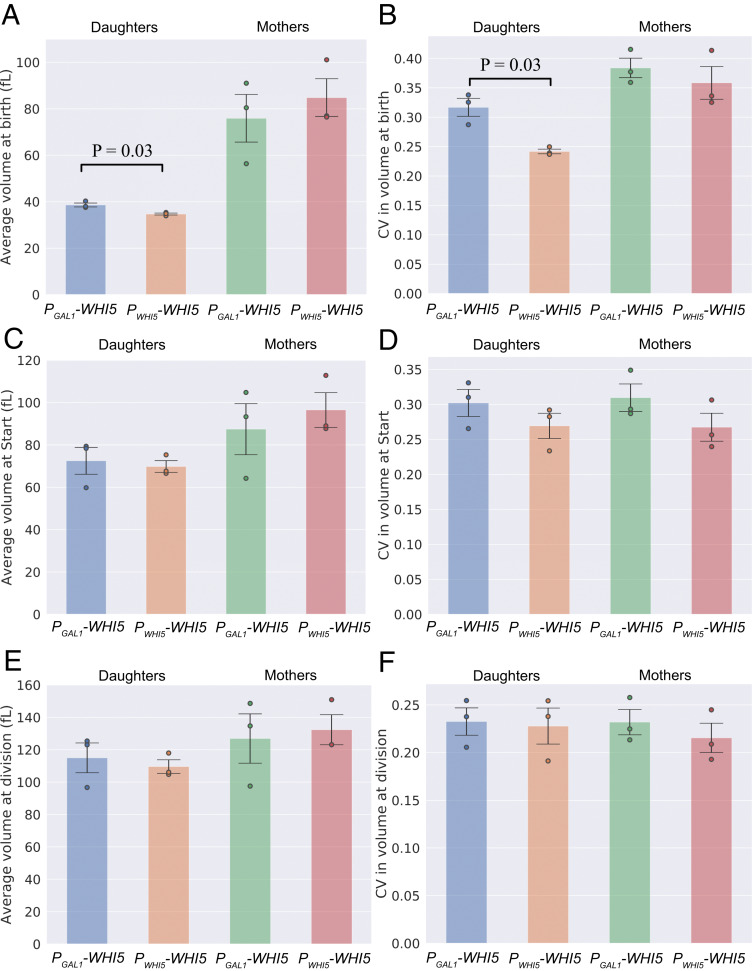
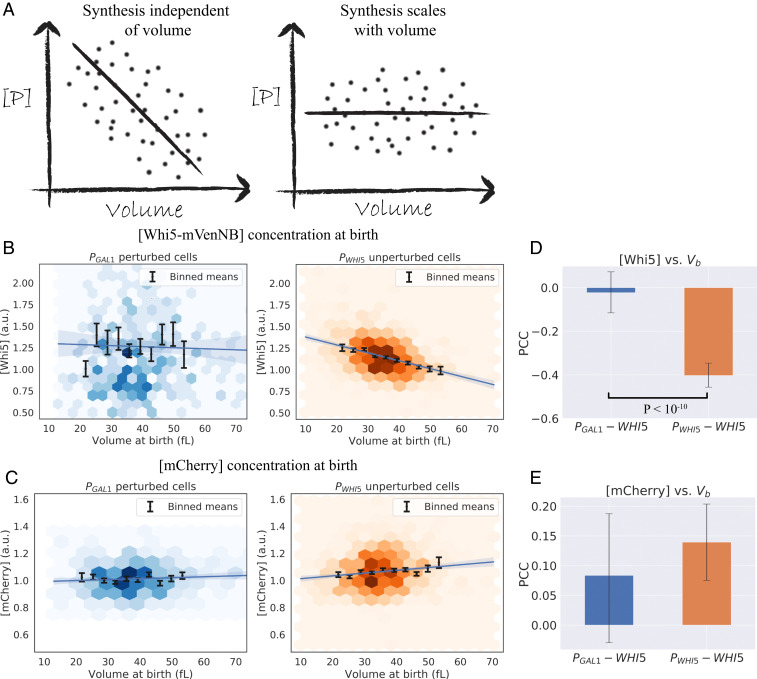
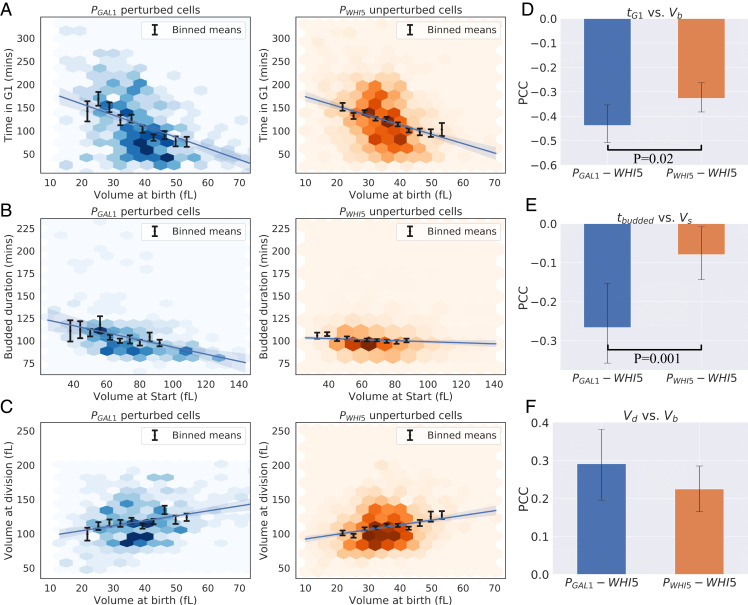
Cells must couple cell-cycle progress to their growth rate to restrict the spread of cell sizes present throughout a population. Linear, rather than exponential, accumulation of Whi5, was proposed to provide this coordination by causing a higher Whi5 concentration in cells born at a smaller size. We tested this model using the inducible GAL1 promoter to make the Whi5 concentration independent of cell size. At an expression level that equalizes the mean cell size with that of wild-type cells, the size distributions of cells with galactose-induced Whi5 expression and wild-type cells are indistinguishable. Fluorescence microscopy confirms that the endogenous and GAL1 promoters produce different relationships between Whi5 concentration and cell volume without diminishing size control in the G1 phase. We also expressed Cln3 from the GAL1 promoter, finding that the spread in cell sizes for an asynchronous population is unaffected by this perturbation. Our findings indicate that size control in budding yeast does not fundamentally originate from the linear accumulation of Whi5, contradicting a previous claim and demonstrating the need for further models of cell-cycle regulation to explain how cell size controls passage through Start.

Keywords: Start; Whi5; budding yeast; cell-size control; single-cell time-lapse microscopy.


Conflict of interest statement

The authors declare no competing interest.

Figures

Fig. 1.
Fig. 1.
Genetic regulation of passage through Start.
Fig. 2.
Fig. 2.
Perturbing Whi5 expression using a galactose-inducible promoter has a minimal effect on the spread in cell size, generating a modest increase in CV at birth, which is not observable at Start or cell division. Cell-size distributions are compared for PGAL1-WHI5 and PWHI5-WHI5 cell types for volume at birth, at Start, and at division. Volumes were measured via time-lapse microscopy and plotted by cell type (inducible and noninducible, mothers and daughters). (A) Average size at birth. (B) CV in size at birth. (C) Average size at Start. (D) CV in size at Start. (E) Average size at division. (F) CV in size at division. Values represent the mean across three biological replicates of the relevant statistic (average or CV). Data are compiled from three experiments for each cell type with a total of 347 PGAL1-WHI5 daughters, 800 PGAL1-WHI5 mothers, 853 PWHI5-WHI5 daughters and 1,581 PWHI5-WHI5 mothers. Error bars represent the SD taken across three biological replicates. Black lines correspond to statistically significant differences with two-tailed P values less than 0.05 quoted, calculated by comparing daughters and mothers separately between cell types using a Welch’s t test across biological replicates. Dots correspond to values for individual biological replicates.
Fig. 3.
Fig. 3.
Expressing Whi5 from the GAL1 promoter alters the relationship between Whi5 concentration and cell size. (A) Illustrations of the predicted correlation of protein concentration with cell size for a gene the production rate of which scales linearly with cell volume (53), contrasted with a gene the synthesis of which does not scale with cell volume. (B and C) Concentration of fluorescent proteins at cell birth vs. volume at birth (Vb), grouped by cell type (PWHI5-WHI5 “unperturbed” cells, and PGAL1-WHI5 “perturbed” cells) and derived from time-lapse experiments to monitor cell growth. The fluorescence intensity averaged over the cell is used as a proxy for protein concentration. Colored hexagons represent a 2D histogram of data points, with darker hexagons showing increased local density of data points. Black lines correspond to averages of the same data binned with respect to Vb, with error bars showing the SEM. Blue lines correspond to linear regression fits with 95% confidence intervals. Data are compiled from three experiments for each cell type with a total of 347 PGAL1-WHI5 daughters, 800 PGAL1-WHI5 mothers, 853 PWHI5-WHI5 daughters and 1,581 PWHI5-WHI5 mothers. (B) Whi5 signal. PWHI5-WHI5 cells (orange) show a negative correlation between Whi5 concentration at birth and cell volume at birth. PGAL1-WHI5 cells (blue) lose this negative correlation, consistent with Whi5 synthesis being proportional to cell volume. (C) pACT1-mCherry signal. Daughter cells display a weak positive correlation between [mCherry] and cell volume at birth. The origin of this correlation is unknown, although it is consistent between PGAL1-WHI5 and PWHI5-WHI5 cell types. (D and E) Pearson correlation coefficients (PCC) measured for the datasets plotted in B and C. Error bars correspond to 95% confidence intervals inferred by bootstrapping analysis. Black lines correspond to statistically significant differences with P values less than 0.05 quoted, calculated using a Fisher’s z-transformation on both datasets. (D) PCC values for [Whi5] measured at birth vs. Vb for daughter cells show a statistically significant difference between cell types with P < 10−10. (E) PCC values for [mCherry] measured at birth vs. Vb for daughter cells shows no statistically significant difference between the two cell types.
Fig. 4.
Fig. 4.
PGAL1-WHI5 cells retain size control during the G1 phase, in addition to weak size control in the budded portion of the cell cycle. (AC) Cell-cycle correlations for daughter cells. See Fig. 3 for details on plotting features for AC. Data are compiled from three experiments for each cell type with a total of 347 PGAL1-WHI5 daughters, 800 PGAL1-WHI5 mothers, 853 PWHI5-WHI5 daughters and 1,581 PWHI5-WHI5 mothers. (A) Plot of time spent in G1 phase (determined by nuclear localization of Whi5) vs. cell volume at birth (Vb) for PGAL1-WHI5 and PWHI5-WHI5 cells. (B) Plot of time spent in the budded phases (the sum of S-phase, G2, and mitosis, determined by nuclear exclusion of Whi5) vs. cell volume at Start (Vs) for PGAL1-WHI5 and PWHI5-WHI5 cells. (C) Plot of Vb vs. volume at division (Vd). (DF) PCCs measured for the datasets plotted in AC. Error bars show 95% confidence intervals inferred by bootstrapping analysis. Black lines correspond to statistically significant differences with P values less than 0.05 quoted, calculated using a Fisher’s z-transformation on both datasets. (D) PCC values for G1 duration vs. Vb for daughter cells show a statistically significant difference between cell types (P = 0.02). This difference is consistent with stronger size control occurring during the G1 phase for PGAL1-WHI5 cells, not weaker as would be predicted by the inhibitor dilution model. (E) PCC values for budded duration measured at birth vs. Vb for daughter cells shows a statistically significant difference between the two cell types with P = 0.001. This difference corresponds to the presence of weak size control during the budded portion of the cell cycle. (F) PCC values for Vb vs. Vd for daughter cells show no statistically significant difference between the two cell types.

References

    1. Donachie W. D., Relationship between cell size and time of initiation of DNA replication. Nature 219, 1077–1079 (1968). - PubMed
    1. Nurse P., Genetic control of cell size at cell division in yeast. Nature 256, 547–551 (1975). - PubMed
    1. Johnston G. C., Pringle J. R., Hartwell L. H., Coordination of growth with cell division in the yeast Saccharomyces cerevisiae. Exp. Cell Res. 105, 79–98 (1977). - PubMed
    1. Eun Y.-J. et al. ., Archaeal cells share common size control with bacteria despite noisier growth and division. Nat. Microbiol. 3, 148–154 (2018). - PubMed
    1. Amodeo A. A., Skotheim J. M., Cell-size control. Cold Spring Harb. Perspect. Biol. 8, a019083 (2016). - PMC - PubMed

Publication types

MeSH terms

LinkOut - more resources