. 2020 Jun 9;13(635):eaaz2597.
doi: 10.1126/scisignal.aaz2597.

Endothelial-to-mesenchymal transition compromises vascular integrity to induce Myc-mediated metabolic reprogramming in kidney fibrosis

Affiliations

Endothelial-to-mesenchymal transition compromises vascular integrity to induce Myc-mediated metabolic reprogramming in kidney fibrosis

Sara Lovisa et al. Sci Signal. .

Abstract

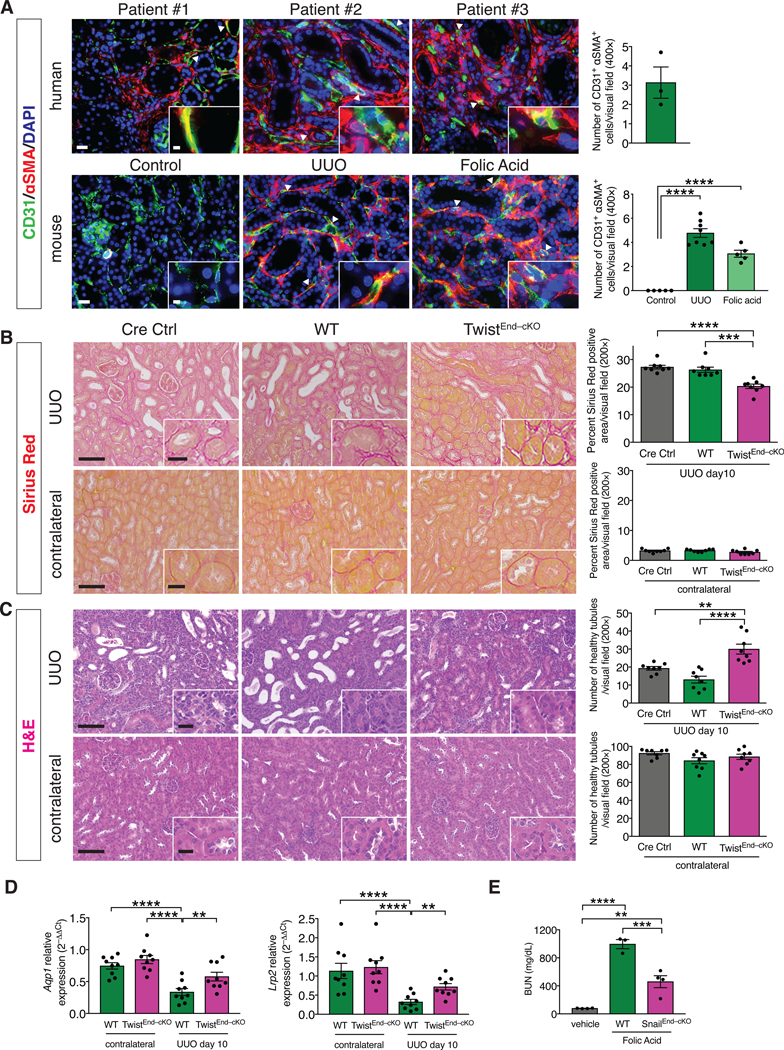
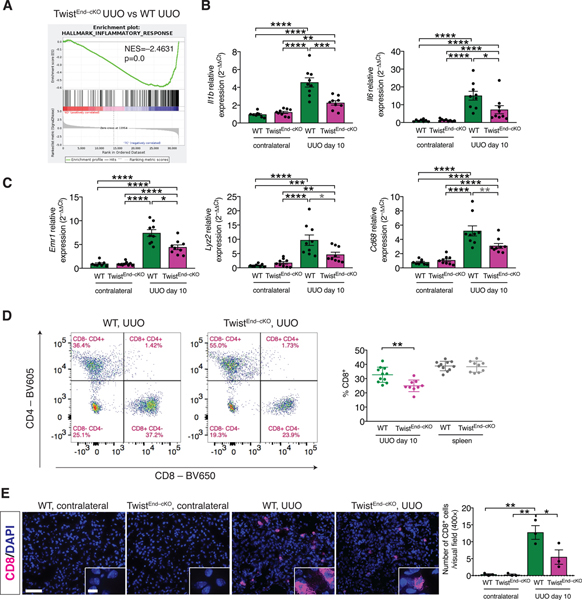
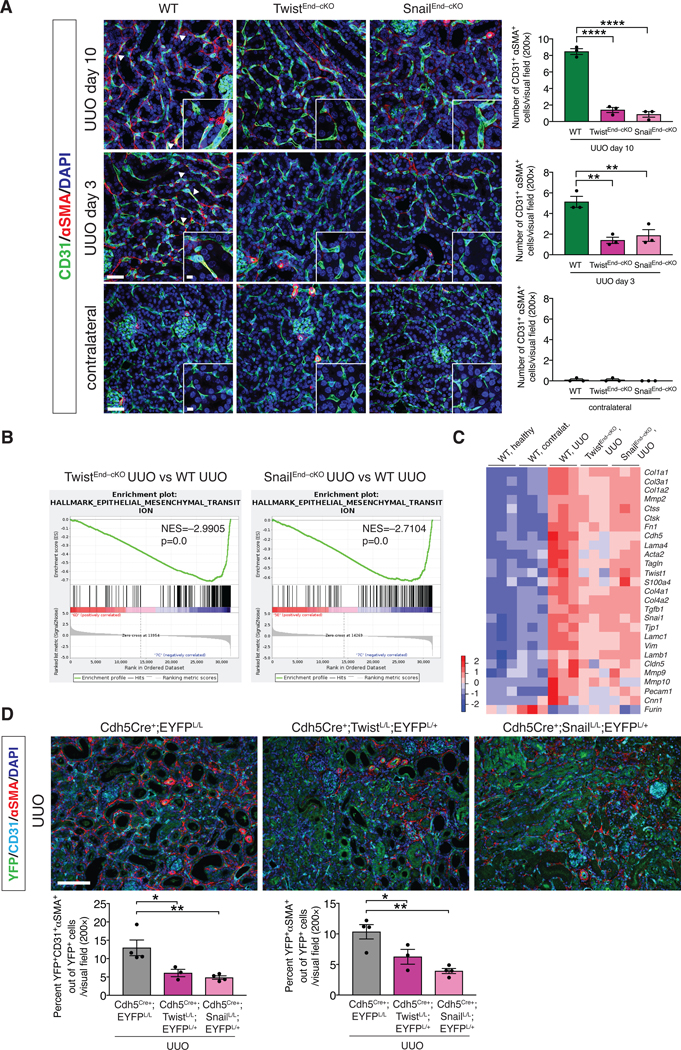
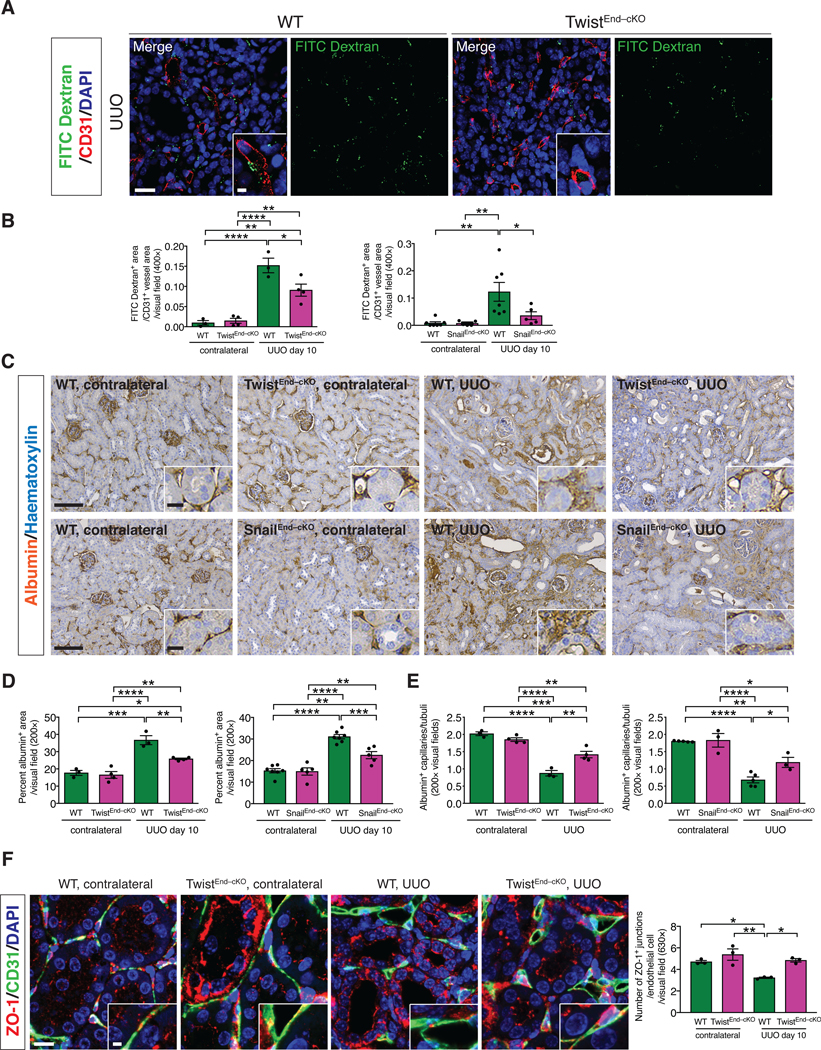
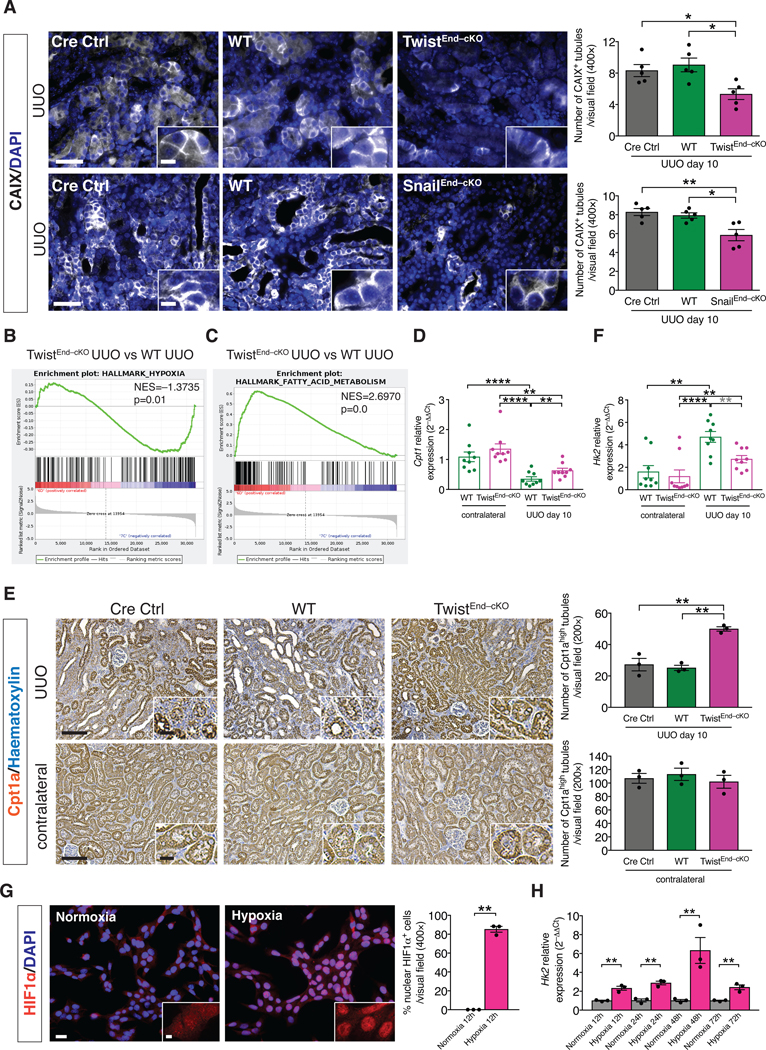
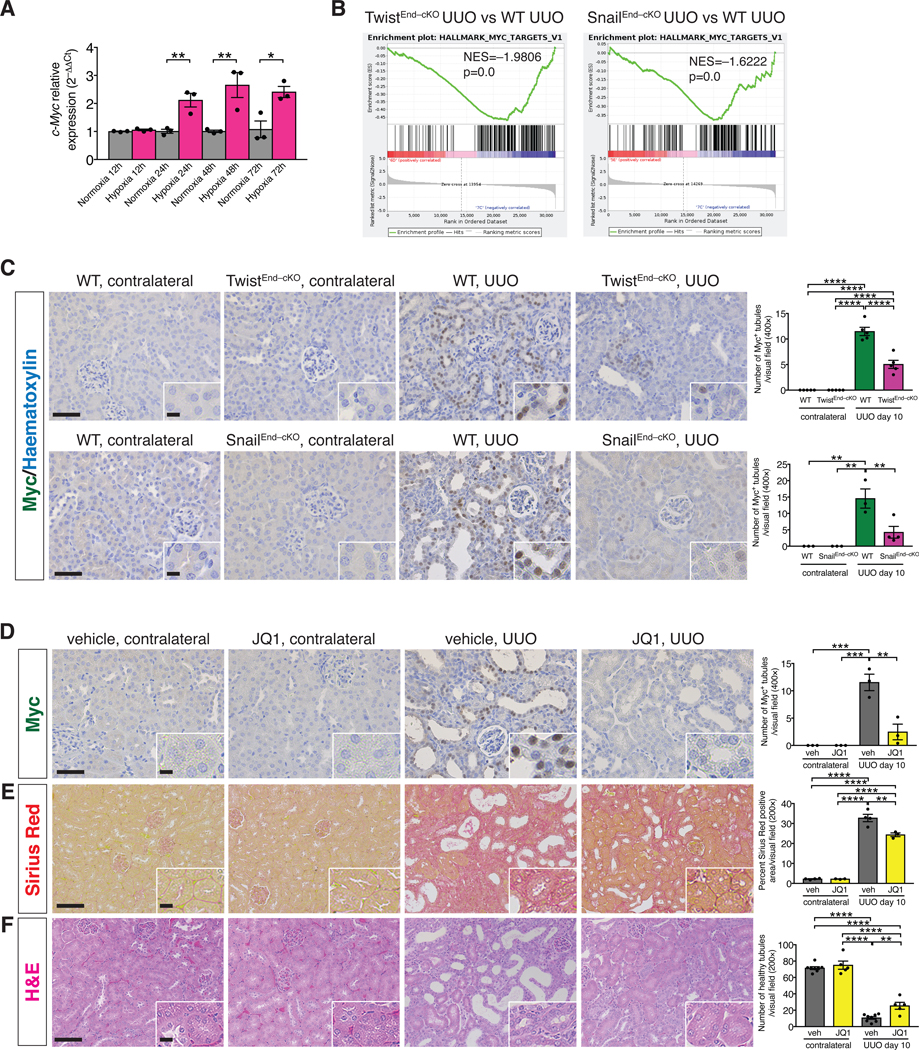
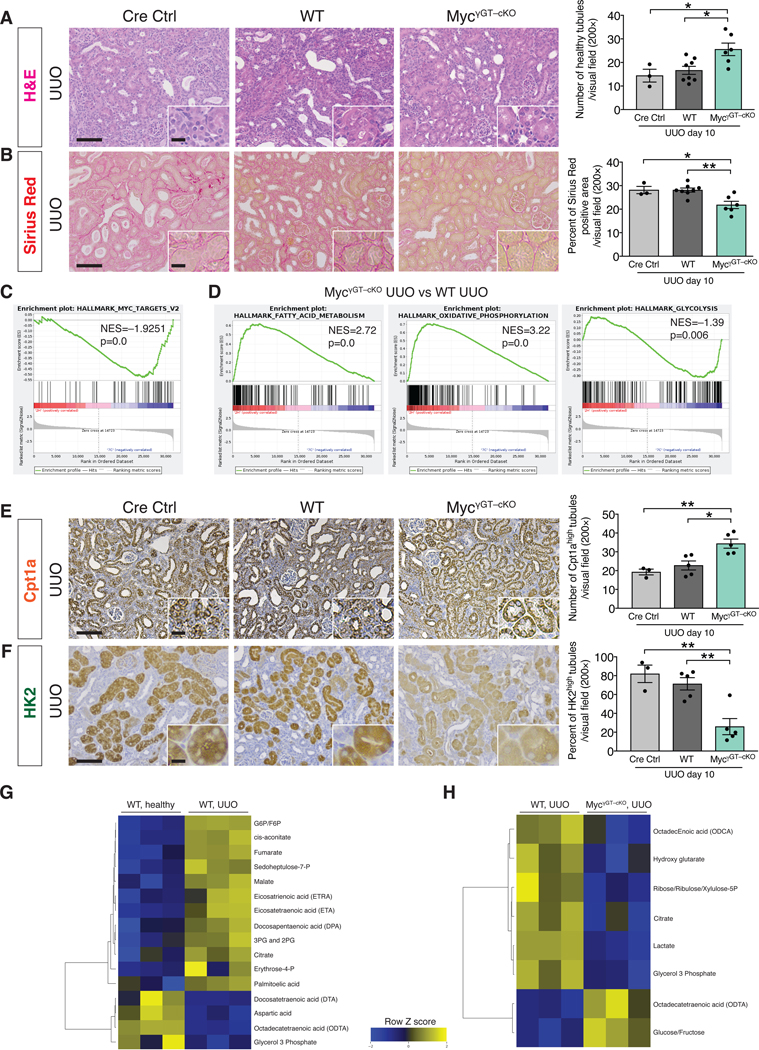
Endothelial-to-mesenchymal transition (EndMT) is a cellular transdifferentiation program in which endothelial cells partially lose their endothelial identity and acquire mesenchymal-like features. Renal capillary endothelial cells can undergo EndMT in association with persistent damage of the renal parenchyma. The functional consequence(s) of EndMT in kidney fibrosis remains unexplored. Here, we studied the effect of Twist or Snail deficiency in endothelial cells on EndMT in kidney fibrosis. Conditional deletion of Twist1 (which encodes Twist) or Snai1 (which encodes Snail) in VE-cadherin+ or Tie1+ endothelial cells inhibited the emergence of EndMT and improved kidney fibrosis in two different kidney injury/fibrosis mouse models. Suppression of EndMT limited peritubular vascular leakage, reduced tissue hypoxia, and preserved tubular epithelial health and function. Hypoxia, which was exacerbated by EndMT, resulted in increased Myc abundance in tubular epithelial cells, enhanced glycolysis, and suppression of fatty acid oxidation. Pharmacological suppression or epithelial-specific genetic ablation of Myc in tubular epithelial cells ameliorated fibrosis and restored renal parenchymal function and metabolic homeostasis. Together, these findings demonstrate a functional role for EndMT in the response to kidney capillary endothelial injury and highlight the contribution of endothelial-epithelial cross-talk in the development of kidney fibrosis with a potential for therapeutic intervention.


Figures

Figure 1.
Figure 1.. Conditional deletion of Twist1 in endothelial cells ameliorates UUO-induced kidney fibrosis.
(A) Immunolabeling for CD31 and αSMA in kidneys from human biopsies of obstructive and allograft nephropathies, n = 3 patients (top), and from UUO and Folic acid-induced experimental models of kidney fibrosis, n = 8 and n = 5 mice for each group, respectively (bottom). Scale bars: 20 μm. Insets: 5 μm. DAPI: nuclei. (B) Representative images of Sirius Red staining and quantification of Sirius Red positive area in UUO (top) and contralateral (bottom) kidneys from the indicated experimental groups. Cre Ctrl n = 8 mice, WT n = 8 mice, TwistEnd–cKO n = 8 mice. (C) Representative H&E images and quantification of the number of healthy tubules in UUO (top) and contralateral (bottom) kidneys from the indicated experimental groups. Cre Ctrl n = 8 mice, WT n = 8 mice, TwistEnd–cKO n = 8 mice. Scale bars: 100 μm. Insets: 25 μm. (D) Relative transcript levels of Aqp1 (which encodes Aquaporin 1) and Lrp2 (which encodes Megalin) in the kidneys of the indicated experimental groups. WT and TwistEnd–cKO n = 9 mice for each group. (E) Blood urea nitrogen (BUN) levels. Vehicle n = 4 mice, WT n = 3 mice, SnailEnd–cKO n = 4 mice. Data are presented as mean ± s.e.m. One-way analysis of variance (ANOVA) with Dunnett’s post-hoc analysis (A) or Tukey post-hoc analysis (B–E). **P < 0.01, ***P < 0.001, ****P < 0.0001.
Figure 2.
Figure 2.. Endothelial deletion of Twist1 or Snai1 reduces inflammation and CD8+ T cells infiltration in the fibrotic kidney.
(A) GSEA enrichment plots of Hallmark gene dataset associated with the inflammatory response in the kidneys of TwistEnd–cKO UUO compared to WT UUO mice. All groups, n = 3 mice for each group. (B) Relative transcript levels of Il1b (which encodes interleukin-1β) and Il6 (which encodes interleukin-6) in the kidneys of the indicated experimental groups. WT contr. n = 8 mice, WT UUO n = 9, TwistEnd–cKO n = 9 mice. (C) Relative transcript levels of Emr1 (which encodes F4/80), Lyz2 (which encodes lysozyme) and Cd68 in the kidneys of the indicated experimental groups. WT contr. n = 8 mice, WT UUO n = 9, TwistEnd–cKO n = 9 mice. (D) Flow cytometry analysis of the percentage of CD8+ cells in kidneys and spleens of the indicated experimental groups. Data are presented as mean ± s.d. WT n = 11 mice, TwistEnd–cKO n = 9 mice. (E) Immunolabeling for CD8 in UUO and contralateral kidneys of the indicated experimental groups and respective quantification. All groups, n = 3 mice for each group. Scale bars: 50 μm. Insets: 12.5 μm. DAPI: nuclei. Data are presented as mean ± s.e.m in A, B, C, E. One-way analysis of variance (ANOVA) with Tukey post-hoc analysis, with gray stars indicating the use of unpaired two-tailed t-test. * P < 0.05, **P < 0.01, ***P < 0.001, ****P < 0.0001.
Figure 3.
Figure 3.. EndMT occurs in UUO-induced kidney fibrosis and is inhibited by the conditional deletion of Twist1 or Snai1.
(A) Maximum intensity orthogonal projections of CD31 and αSMA co-immunolabeling of UUO kidneys from the indicated experimental groups and respective quantification of the number of CD31+αSMA+ double positive cells per visual field (200×). Cre Ctrl, WT and TwistEnd–cKO, n = 3 mice; Cre Ctrl, WT and SnailEnd–cKO n = 3 mice. Scale bars: 40 μm. Insets: 10 μm. DAPI: nuclei. (B) GSEA enrichment plots of Hallmark gene dataset associated with epithelial-to-mesenchymal transition in the kidneys of TwistEnd–cKO UUO or SnailEnd–cKO UUO compared to WT UUO mice. All groups, n = 3 mice for each group. (C) Heatmap representing the intensity of expression of EndMT-associated Twist and Snail transcriptional target genes in the kidneys of the indicated experimental groups. Columns represent individual mouse kidney samples. All groups, n = 3 mice for each group. (D) Immunolabeling for YFP, CD31 and αSMA of UUO kidneys from the indicated experimental groups. Cdh5Cre+;EYFPL/L n = 4 mice, Cdh5Cre+;TwistL/L;EYFPL/+ n = 3 mice, Cdh5Cre+;Snai1L/L;EYFPL/+ n = 4 mice. Scale bars: 100 μm. Data is presented as mean ± s.e.m. One-way analysis of variance (ANOVA) with Tukey post-hoc analysis. *P < 0.05, **P < 0.01, ***P < 0.001.
Figure 4.
Figure 4.. Blocking EndMT limits vascular leakage.
(A) Immunolabeling for CD31 and visualization of FITC-conjugated dextran in kidneys from the indicated experimental groups. Scale bars: 20 μm. DAPI: nuclei. (B) Quantification of the ratio of FITC-dextran+ area per CD31+ vessel area in UUO and contralateral kidneys of the indicated experimental groups. WT n = 3 mice, TwistEnd–cKO n = 4 mice; WT n = 7 mice and SnailEnd-cKO n = 5 mice. (C–D) Immunohistochemistry analysis of albumin in kidneys from the indicated experimental groups (C) and respective quantification (D). WT n = 3 mice, TwistEnd–cKO n = 4 mice; WT n = 7 and SnailEnd-cKO n = 5 mice. Scale bars: 100 μm. Insets: 25 μm. (E) Quantification of peritubular patented capillary density performed on the albumin immunohistochemistry analysis presented in (C). WT n = 3 mice, TwistEnd–cKO n = 4 mice; WT n = 5 and SnailEnd-cKO n = 3 mice. (F) Maximum intensity orthogonal projections of ZO-1 and CD31 co-immunolabeling and respective quantification of kidneys from the indicated experimental groups. All groups, n = 3 mice for each group. Scale bars: 30 μm. Insets: 7.5 μm. Data are presented as mean ± s.e.m. One-way analysis of variance (ANOVA) with Tukey post-hoc analysis. *P < 0.05, **P < 0.01, ***P < 0.001, ****P < 0.0001.
Figure 5.
Figure 5.. Blocking EndMT protects against tubular hypoxia and preserves metabolic homeostasis.
(A) Immunolabeling for the hypoxia marker CAIX of kidneys from the indicated experimental groups and respective quantification. All groups, n = 5 mice for each group. Scale bars: 50 μm. Insets: 12.5 μm. DAPI: nuclei. (B–C) GSEA enrichment plots of Hallmark gene dataset associated with hypoxia and fatty acid metabolism in the kidneys of TwistEnd–cKO UUO compared to WT UUO mice. All groups, n = 3 mice for each group. (D) Relative transcript levels of the metabolism-related gene Cpt1 (which encodes carnitine palmitoyltransferase 1A) in the kidneys of the indicated experimental groups. All groups, n = 9 mice for each group. (E) Immunohistochemistry analysis of the FAO marker Cpt1a in kidneys from the indicated experimental groups and respective quantification. All groups, n = 3 mice for each group. Scale bars: 100 μm. Insets: 25 μm. (F) Relative transcript levels of the metabolism-related gene Hk2 (which encodes hexokinase 2) in the kidneys of the indicated experimental groups. All groups, n = 9 mice for each group. (G) Immunolabeling for the hypoxia transcription factor HIF1α and relative quantification in MCT cells exposed to normoxia or hypoxia for 12 hrs. All groups, n = 3 biological replicates for each group. Scale bar: 20 μm. Insets: 5 μm. (H) Relative transcript level of Hk2 in MCT cells exposed to normoxia or hypoxia for 12 to 72 hrs. All groups, n = 3 biological replicates for each group. Data are presented as mean ± s.e.m. One-way analysis of variance (ANOVA) with Tukey post-hoc analysis with gray stars indicating the use of unpaired two-tailed t-test. Unpaired two-tailed Student’s t test (G–H). *P < 0.05, **P < 0.01, ****P < 0.0001.
Figure 6.
Figure 6.. Hypoxia-induced upregulation of Myc supports kidney fibrosis.
(A) Relative transcript level of c-Myc in MCT cells exposed to normoxia or hypoxia for 12 to 72 hrs. All groups, n = 3 biological replicates for each group. (B) GSEA enrichment plots of Hallmark gene dataset associated with Myc transcriptional targets in the kidneys of TwistEnd–cKO and SnailEnd–cKO UUO mice compared to WT UUO mice. All groups, n = 3 mice for each group. (C) Immunohistochemistry analysis of Myc in kidneys from the indicated experimental groups and respective quantification. WT and TwistEnd–cKO n = 5 mice; WT n = 3 mice, SnailEnd-cKO contr. n = 3 mice and SnailEnd-cKO UUO n = 4 mice. (D–F) Representative images of Myc immunohistochemistry (D), Sirius Red (E), and H&E (F) staining and respective quantification of UUO and contralateral kidneys from the indicated experimental groups. Vehicle n = 3–8 mice for each group, JQ1 n = 3–5 mice for each group. Scale bars: 50 μm (C–D) and 100 μm (E–F). Insets: 12.5 μm (C–D) and 25 μm (E–F). Data are presented as mean ± s.e.m. One-way analysis of variance (ANOVA) with Tukey post-hoc analysis (C–F). Unpaired two-tailed Student’s t test (A). *P < 0.05, **P < 0.01, ***P < 0.001, ****P < 0.0001.
Figure 7.
Figure 7.. Genetic deletion of Myc in proximal tubular epithelial cells ameliorates kidney fibrosis and preserves metabolic homeostasis.
(A) Representative H&E images and quantification of the number of healthy tubules in UUO kidneys from the indicated experimental groups. Cre Ctrl n = 3 mice, WT n = 8 mice, MycγGT–cKO n = 6 mice. (B) Representative images of Sirius Red staining and quantification of Sirius Red positive area in UUO kidneys from the indicated experimental groups. Cre Ctrl n = 3 mice, WT n = 8 mice, MycγGT–cKO n = 6 mice. (C) GSEA enrichment plots of Hallmark gene dataset associated with Myc transcriptional targets in the kidneys of MycγGT–cKO UUO compared to WT UUO mice. All groups, n = 3 mice for each group. (D) GSEA enrichment plots of Hallmark gene dataset associated with fatty acid metabolism and oxidative phosphorylation in the kidneys of MycγGT–cKO UUO compared to WT UUO mice. All groups, n = 3 mice for each group. (E) Cpt1a immunohistochemistry in UUO kidneys from the indicated experimental groups and respective quantification. Cre Ctrl n = 3 mice, WT n = 5 mice, MycγGT–cKO n = 5 mice. (F) HK2 immunohistochemistry in UUO kidneys from the indicated experimental groups and respective quantification. Cre Ctrl n = 3 mice, WT n = 5 mice, MycγGT–cKO n = 5 mice. Scale bars: 100 μm. Insets: 25 μm. (G–H) Heat maps showing the altered metabolites (FDR < 0.25) in WT UUO kidneys compared to healthy kidneys (G) and in MycγGT–cKO UUO compared to WT UUO kidneys (H). Columns represent individual mouse kidney samples and rows refer to individual metabolites. Shades of yellow represent increased abundance of a metabolite and shades of blue represent decreased abundance of a metabolites. Data are presented as mean ± s.e.m. One-way analysis of variance (ANOVA) with Tukey post-hoc analysis. *P < 0.05, **P < 0.01.

Comment in

References

    1. Dejana E, Hirschi KK, and Simons M, The molecular basis of endothelial cell plasticity. Nat Commun, 2017. 8: p. 14361. - PMC - PubMed
    1. Eisenberg LM and Markwald RR, Molecular regulation of atrioventricular valvuloseptal morphogenesis. Circ Res, 1995. 77(1): p. 1–6. - PubMed
    1. Zeisberg EM, et al., Endothelial-to-mesenchymal transition contributes to cardiac fibrosis. Nat Med, 2007. 13(8): p. 952–61. - PubMed
    1. Zeisberg EM, et al., Fibroblasts in kidney fibrosis emerge via endothelial-to-mesenchymal transition. J Am Soc Nephrol, 2008. 19(12): p. 2282–7. - PMC - PubMed
    1. Zeisberg EM, et al., Discovery of endothelial to mesenchymal transition as a source for carcinoma-associated fibroblasts. Cancer Res, 2007. 67(21): p. 10123–8. - PubMed

Publication types

Substances