. 2020 Aug 14;295(33):11435-11454.
doi: 10.1074/jbc.RA120.013426. Epub 2020 Jun 9.

The yeast exoribonuclease Xrn1 and associated factors modulate RNA polymerase II processivity in 5' and 3' gene regions

Affiliations

The yeast exoribonuclease Xrn1 and associated factors modulate RNA polymerase II processivity in 5' and 3' gene regions

Jonathan Fischer et al. J Biol Chem. .

Abstract

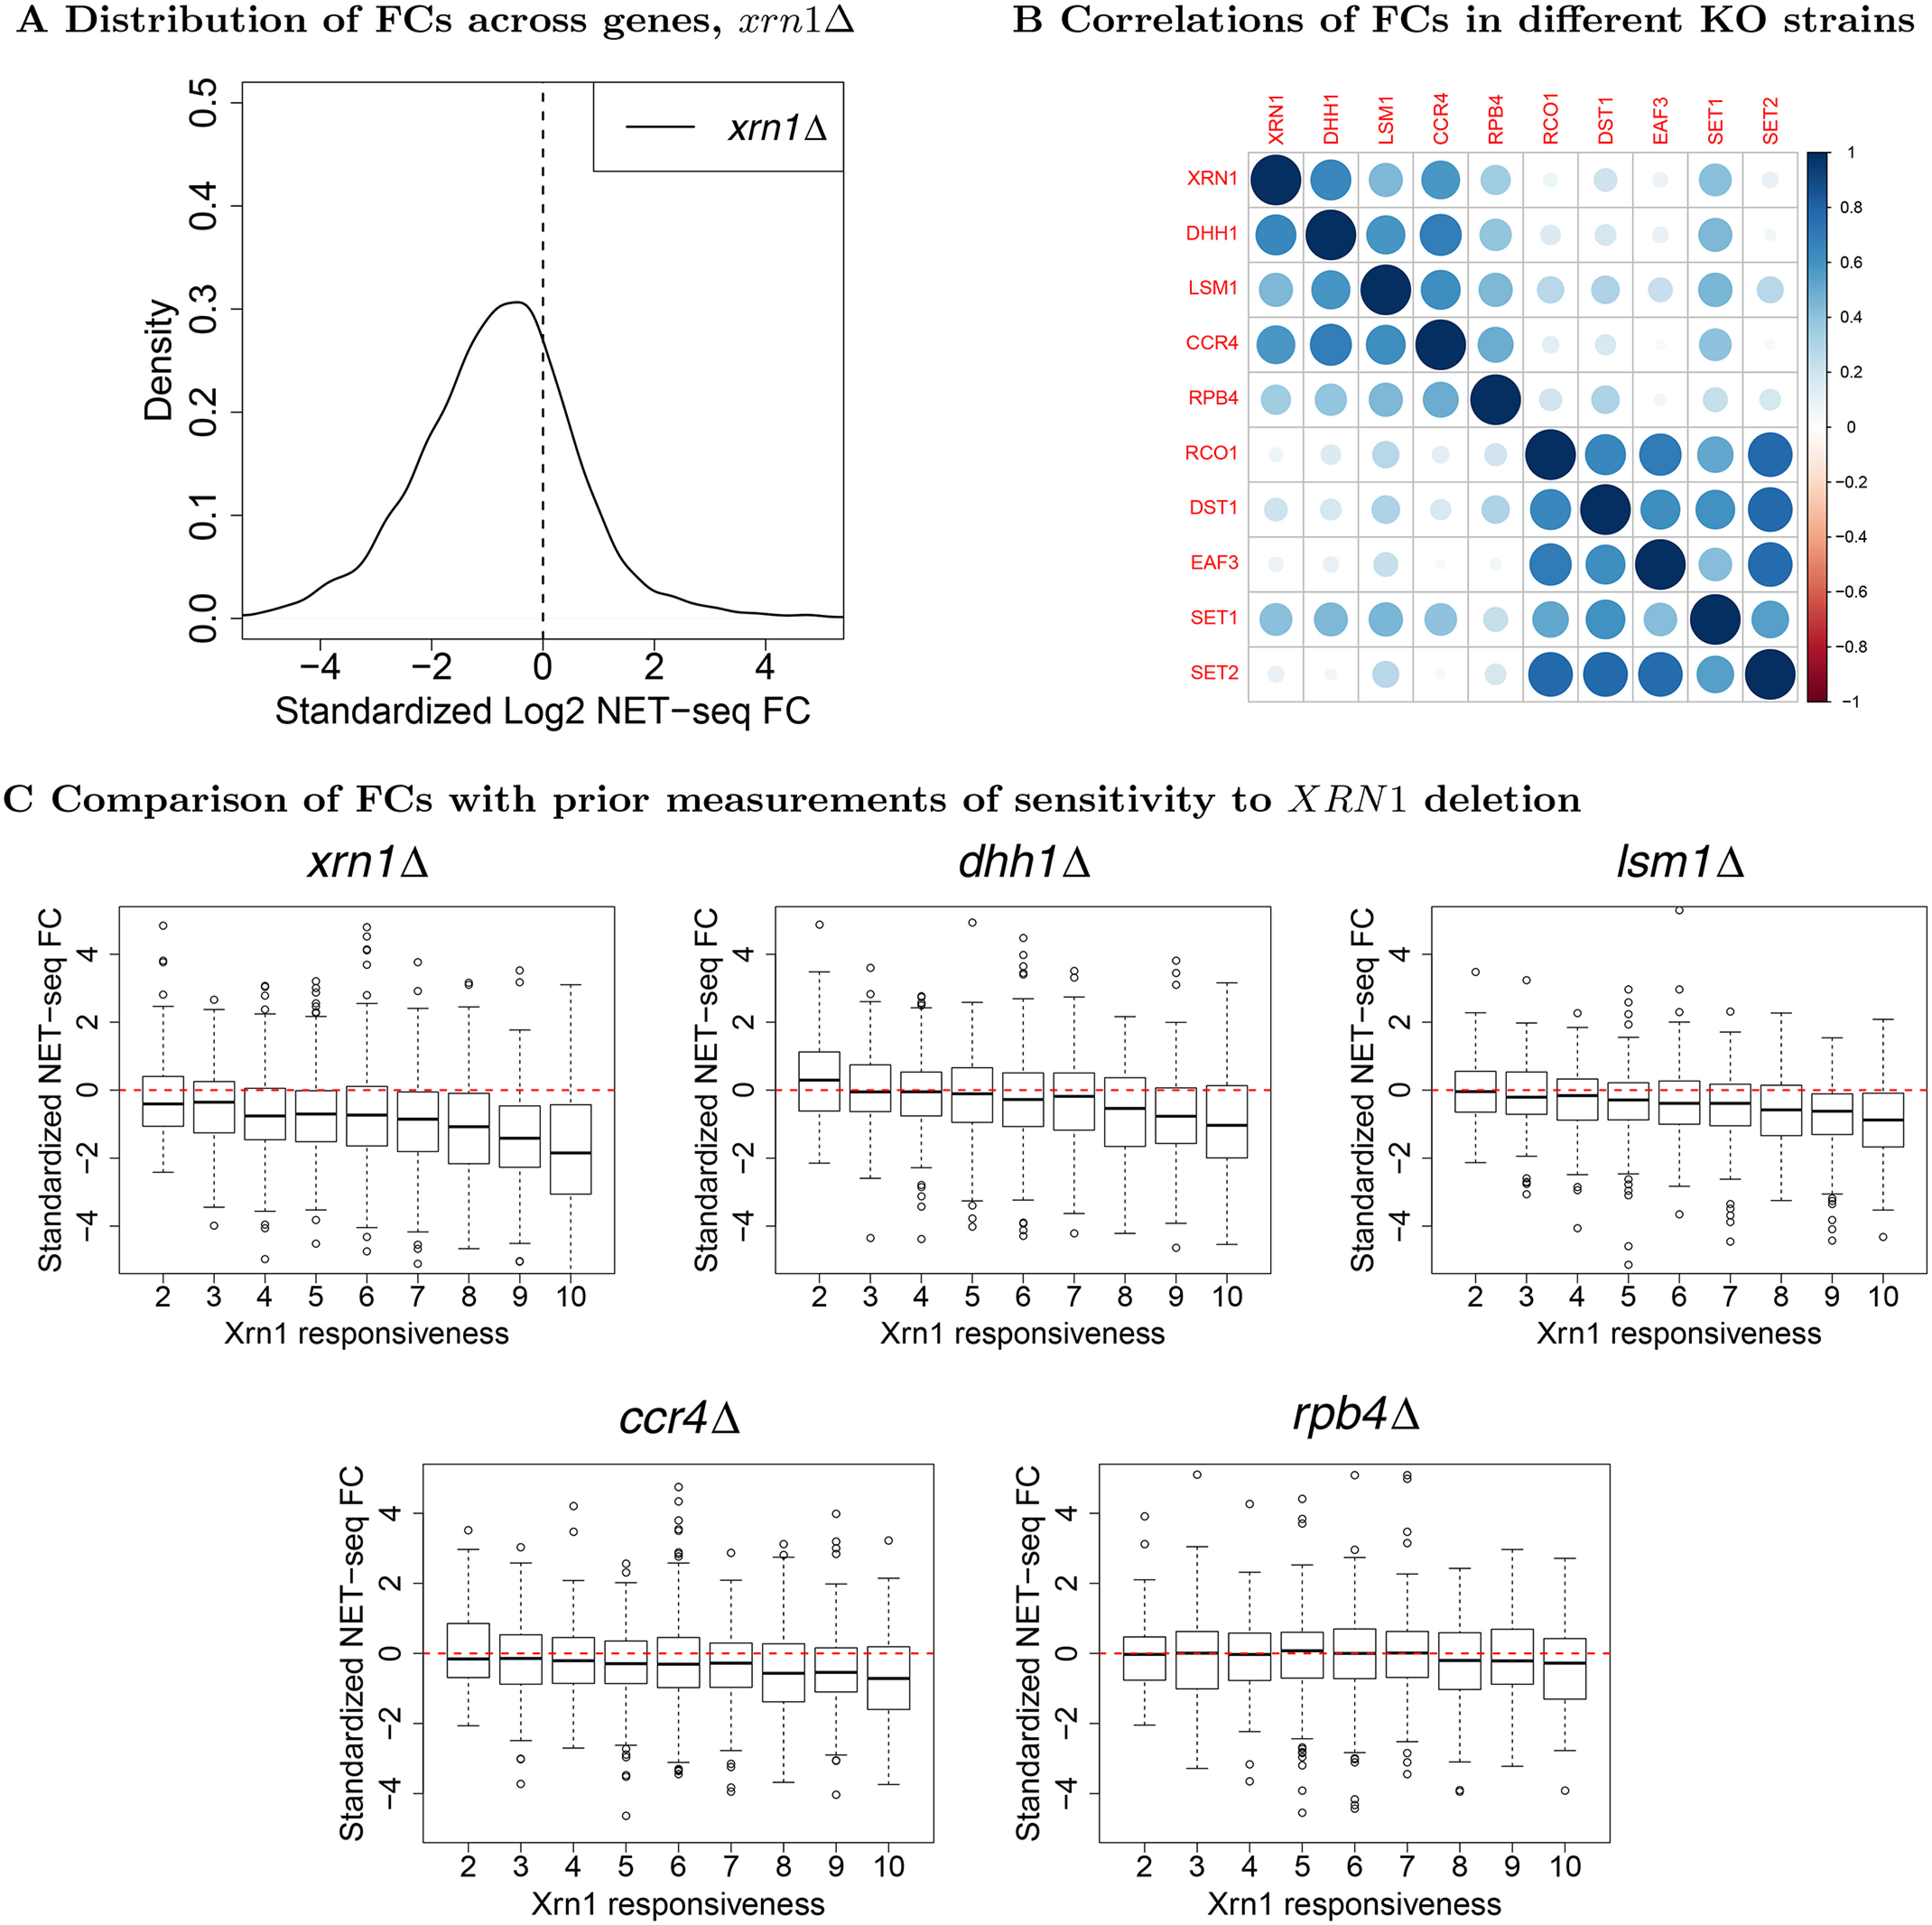
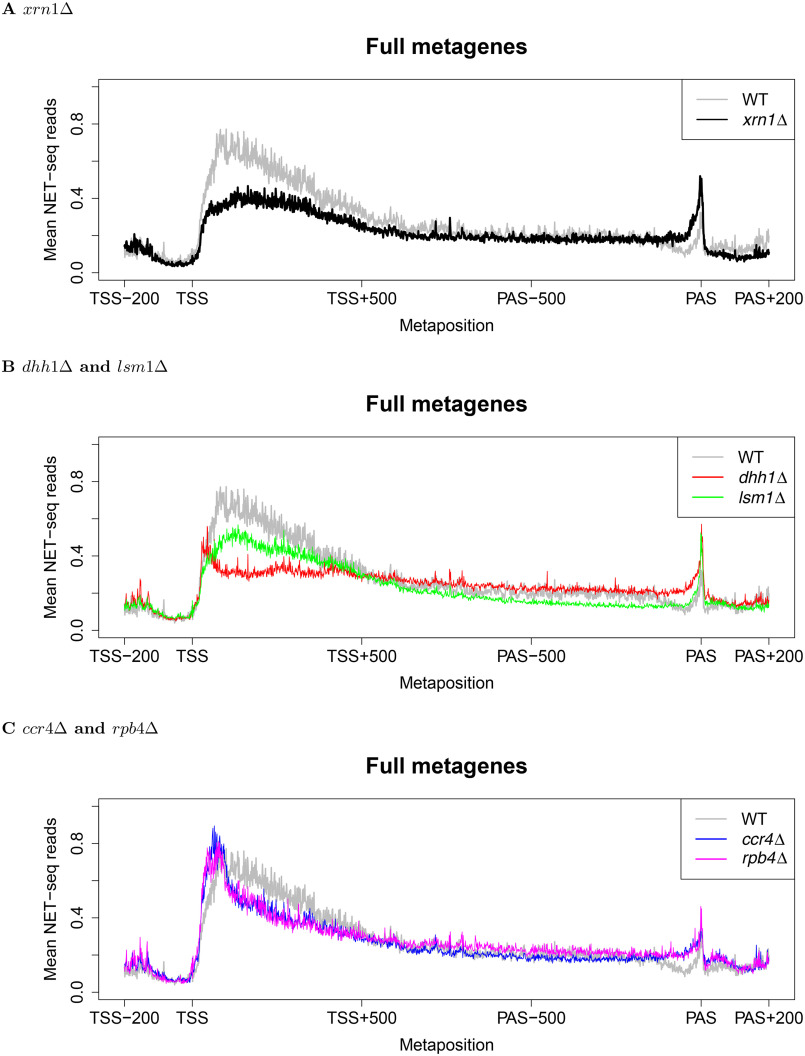
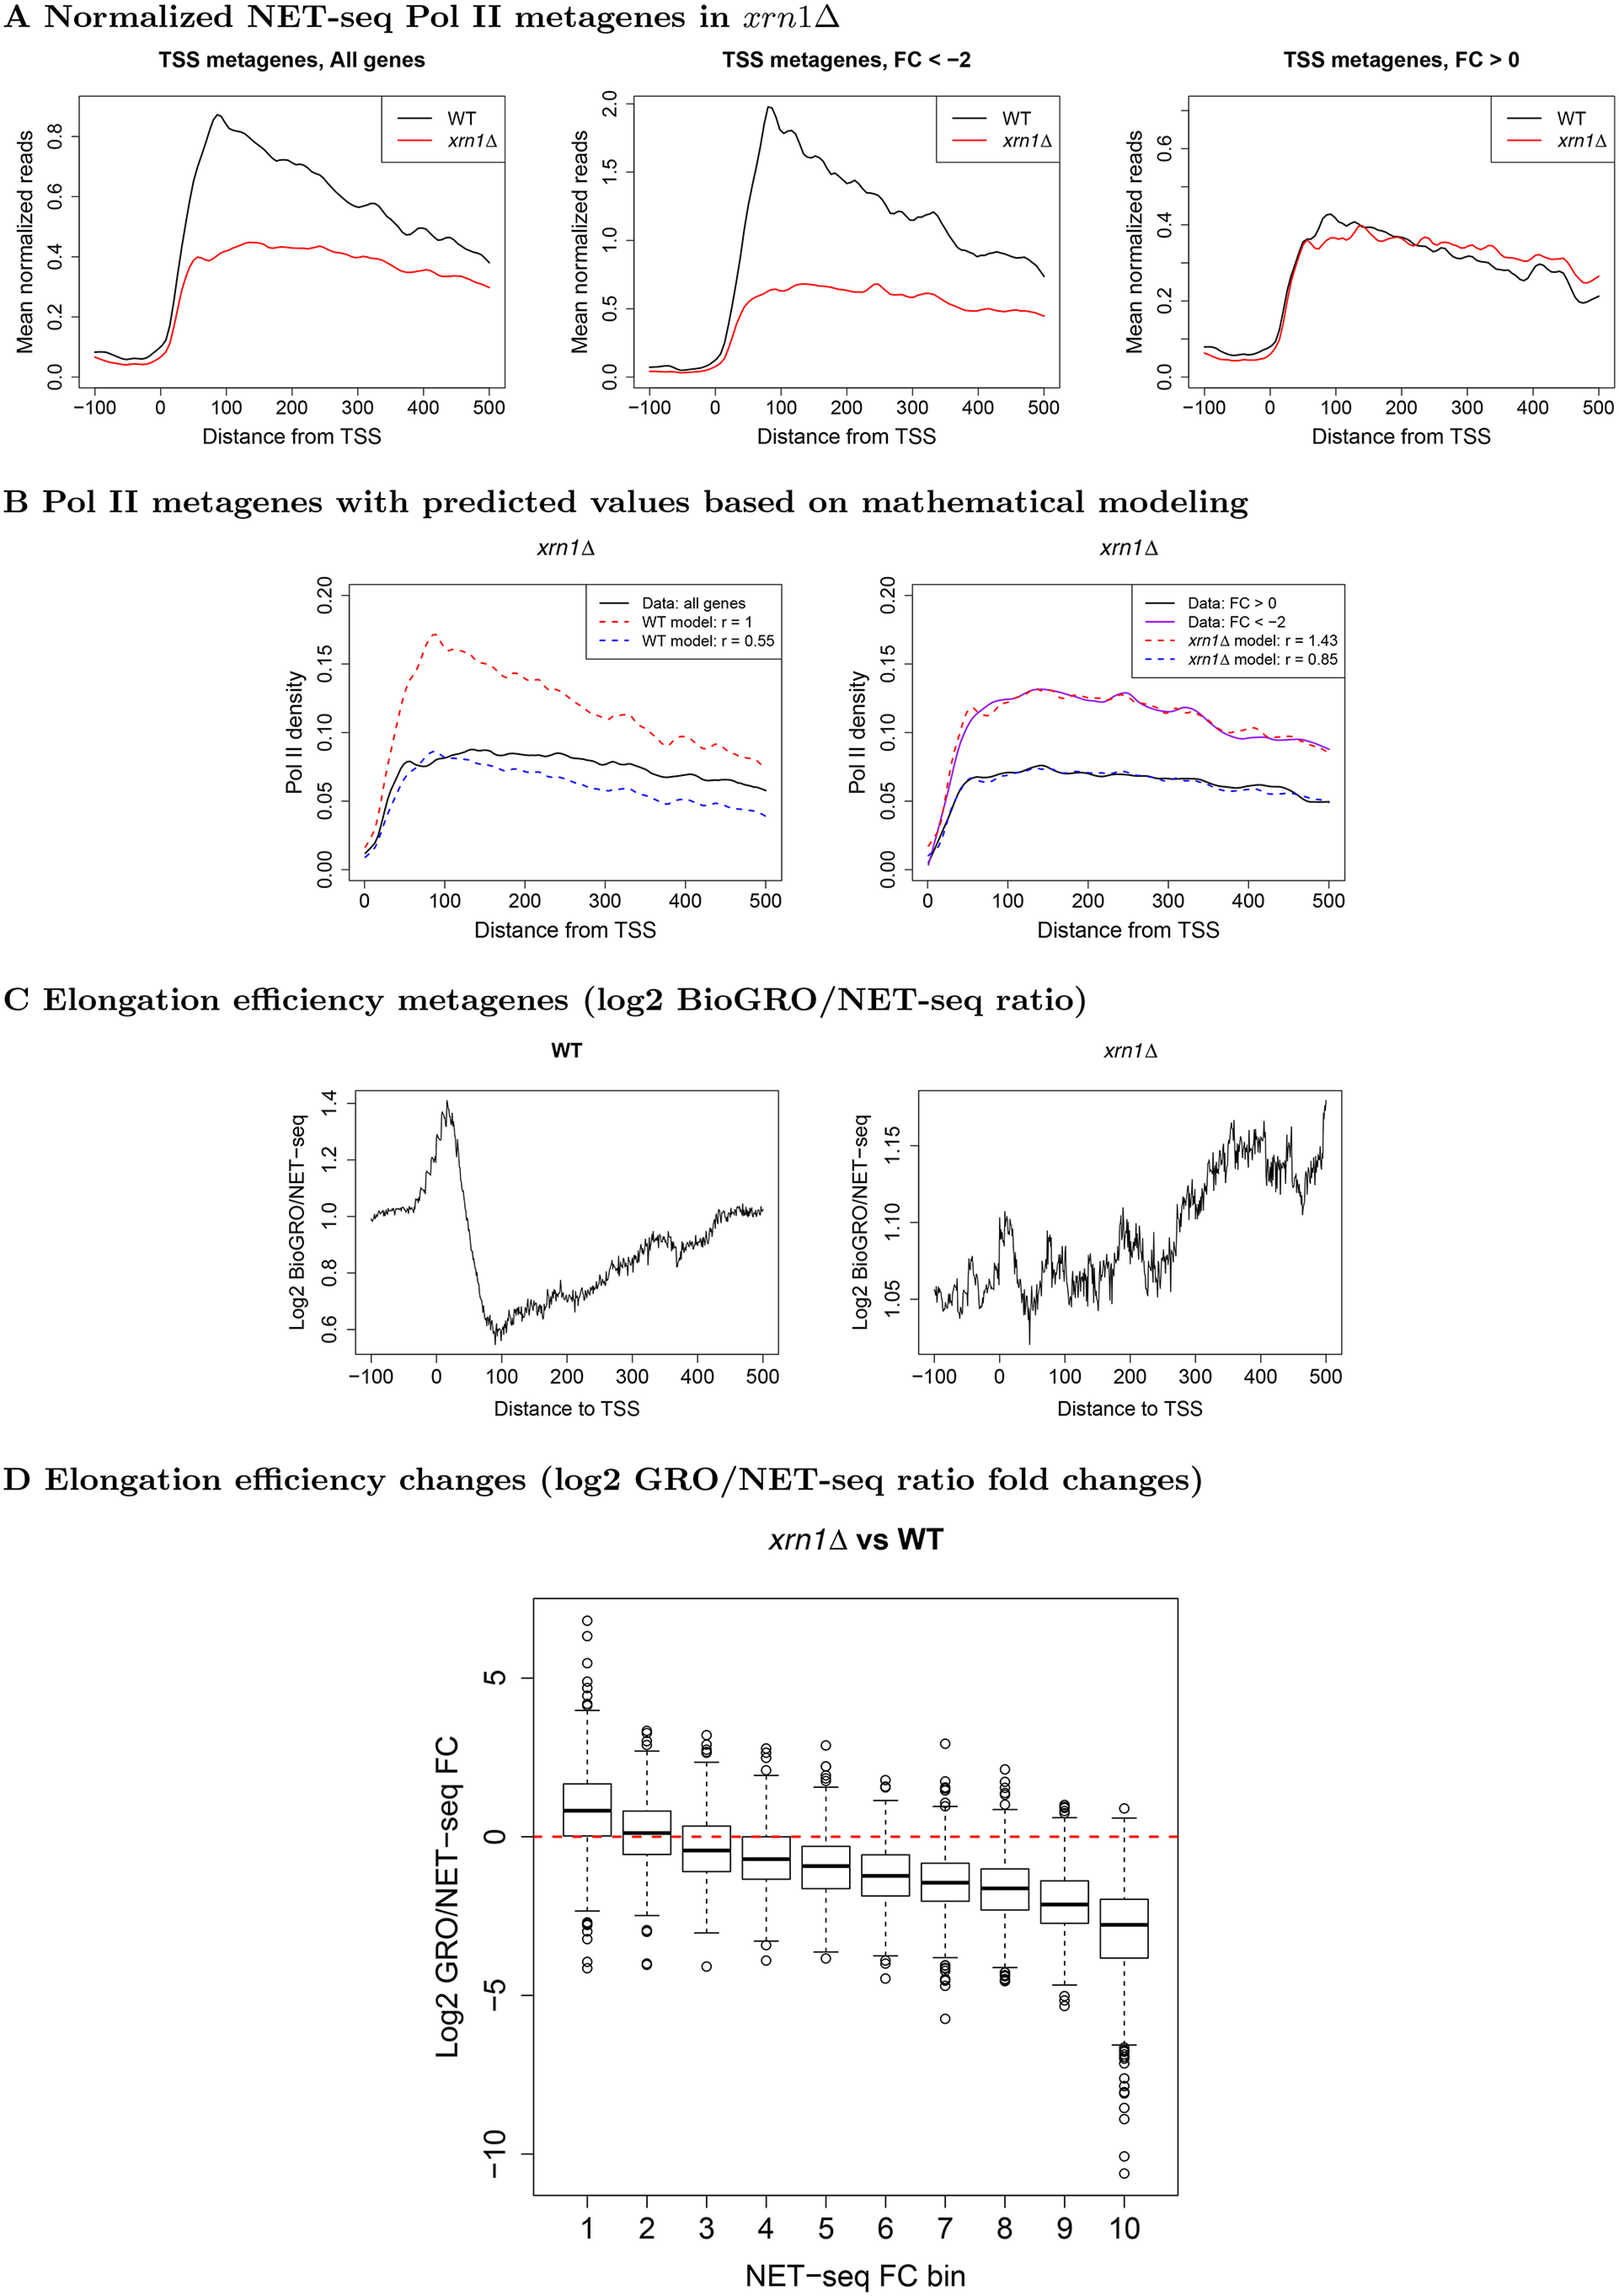
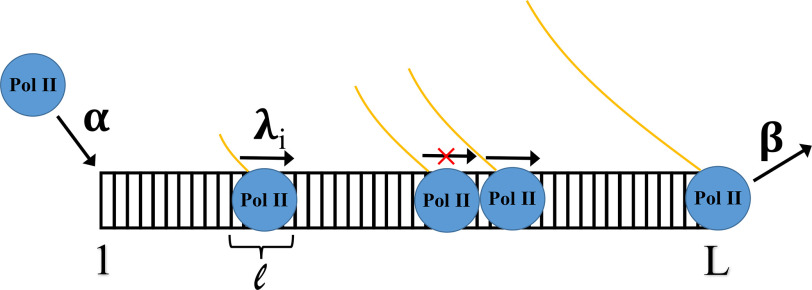
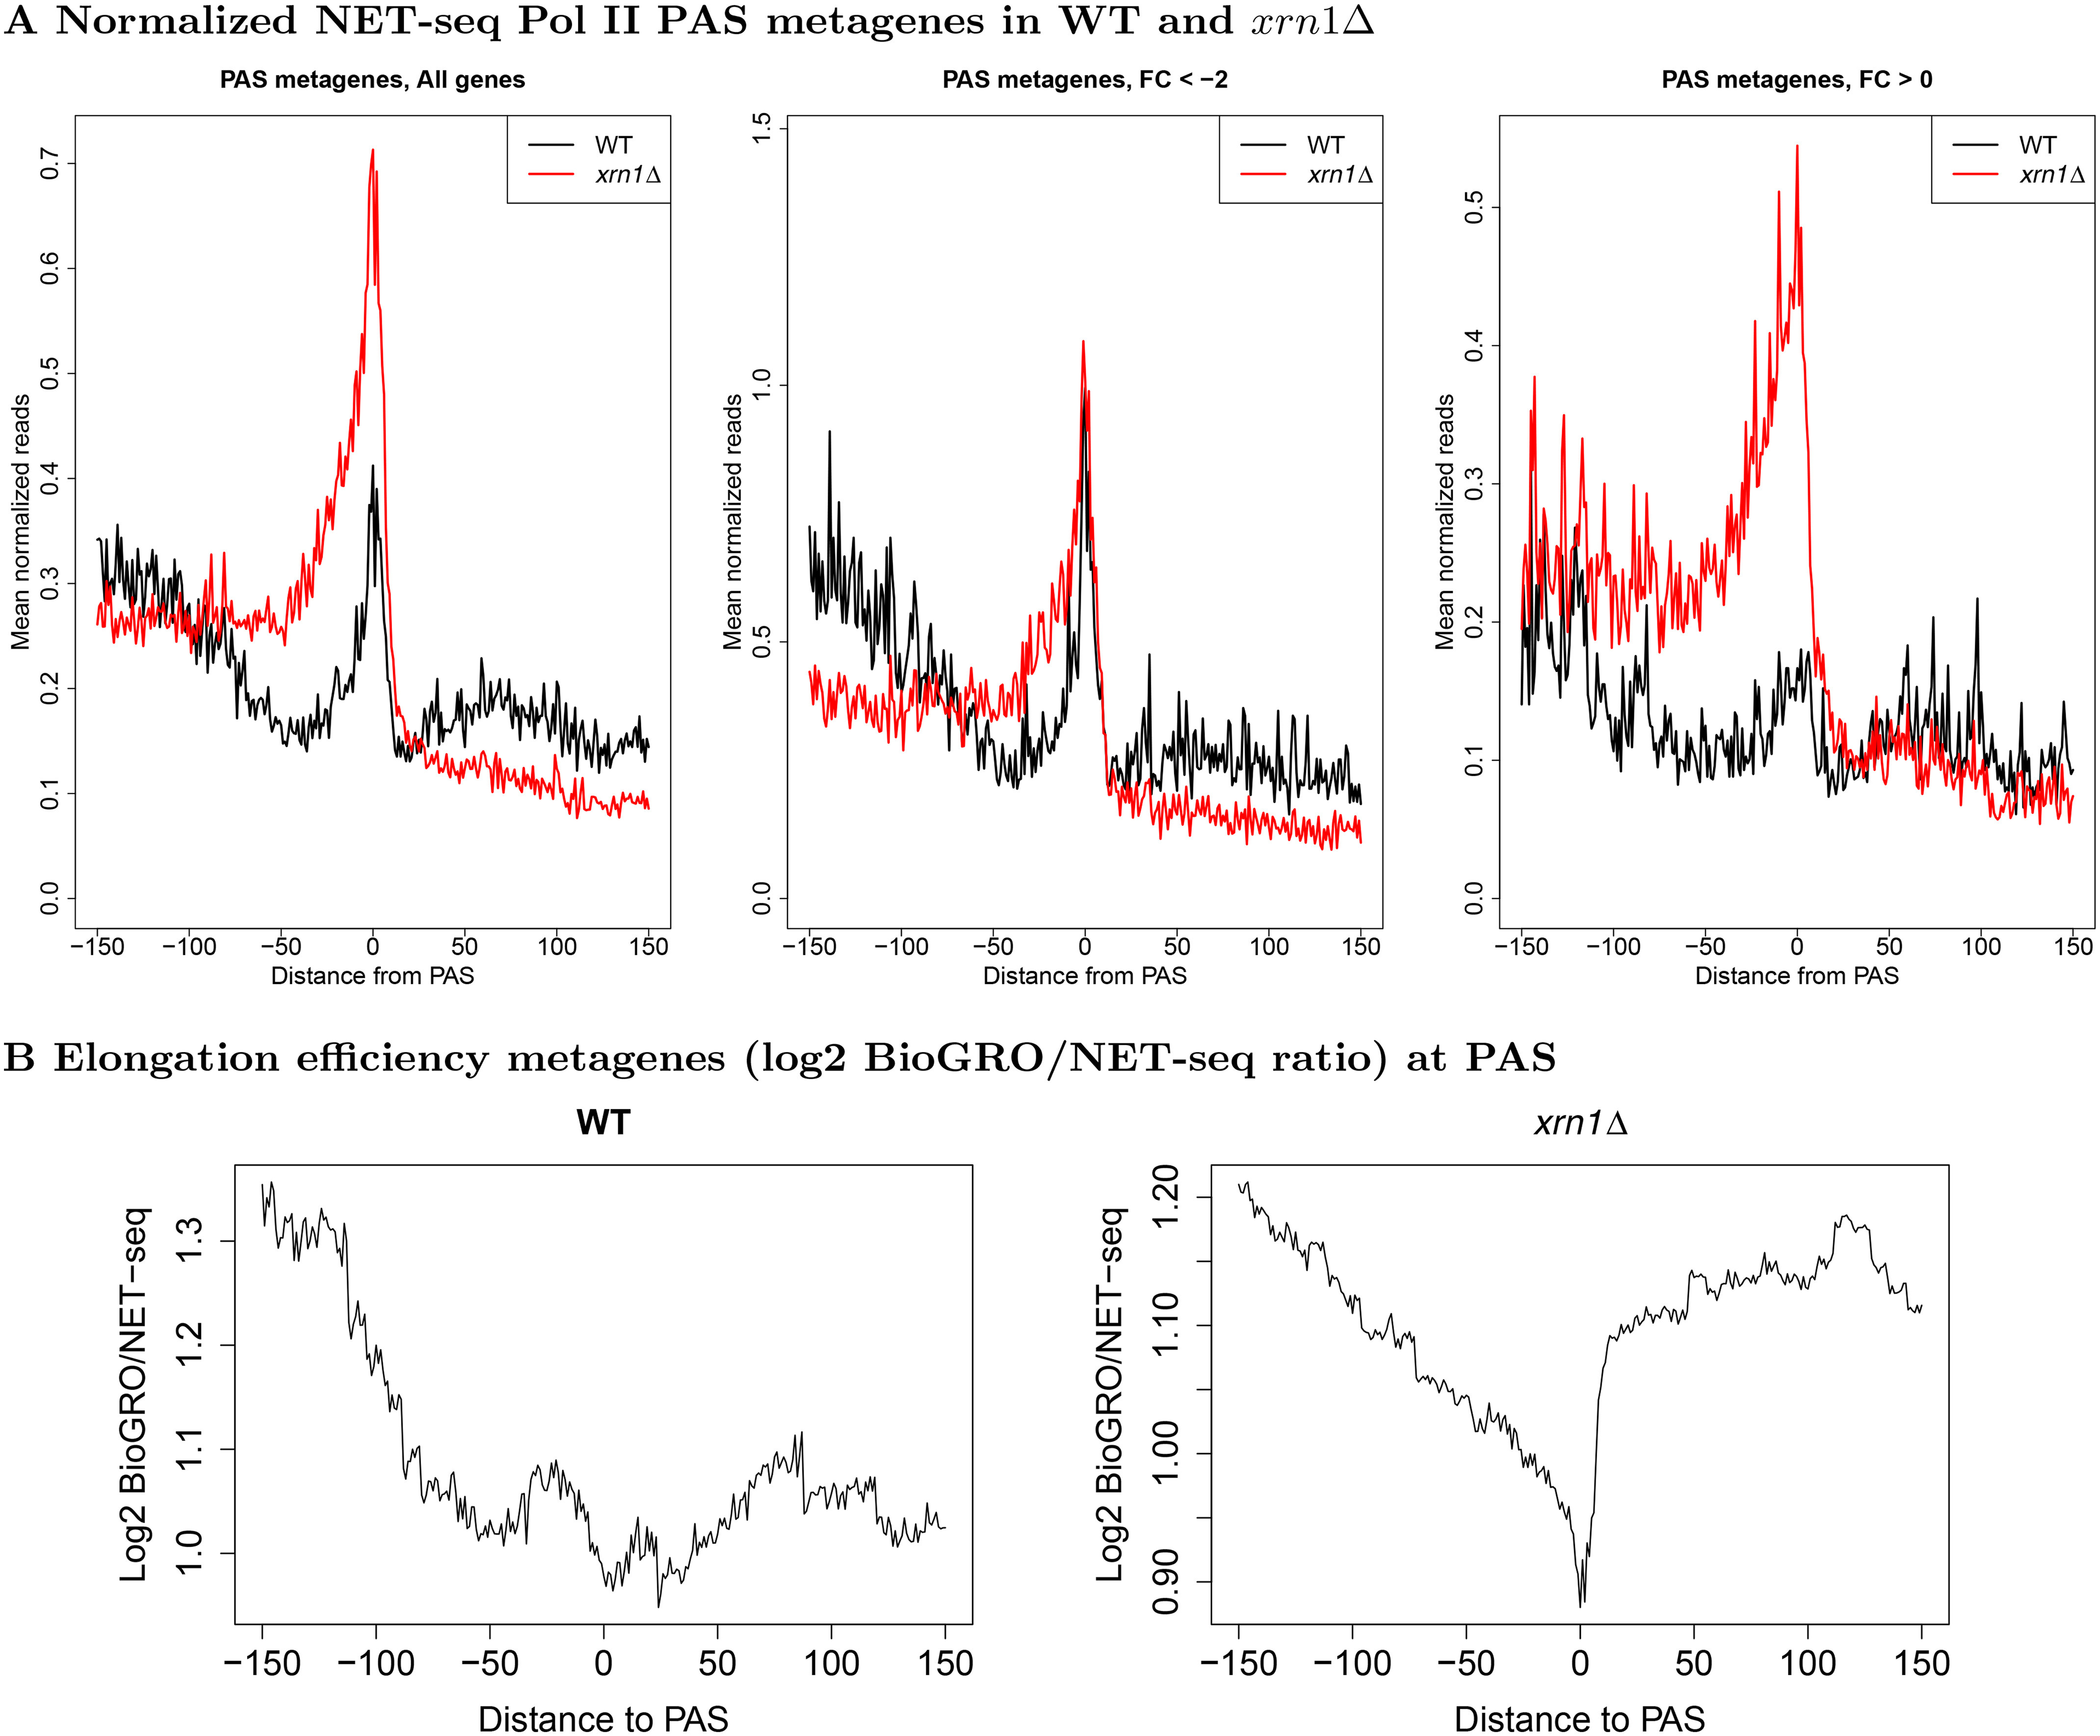
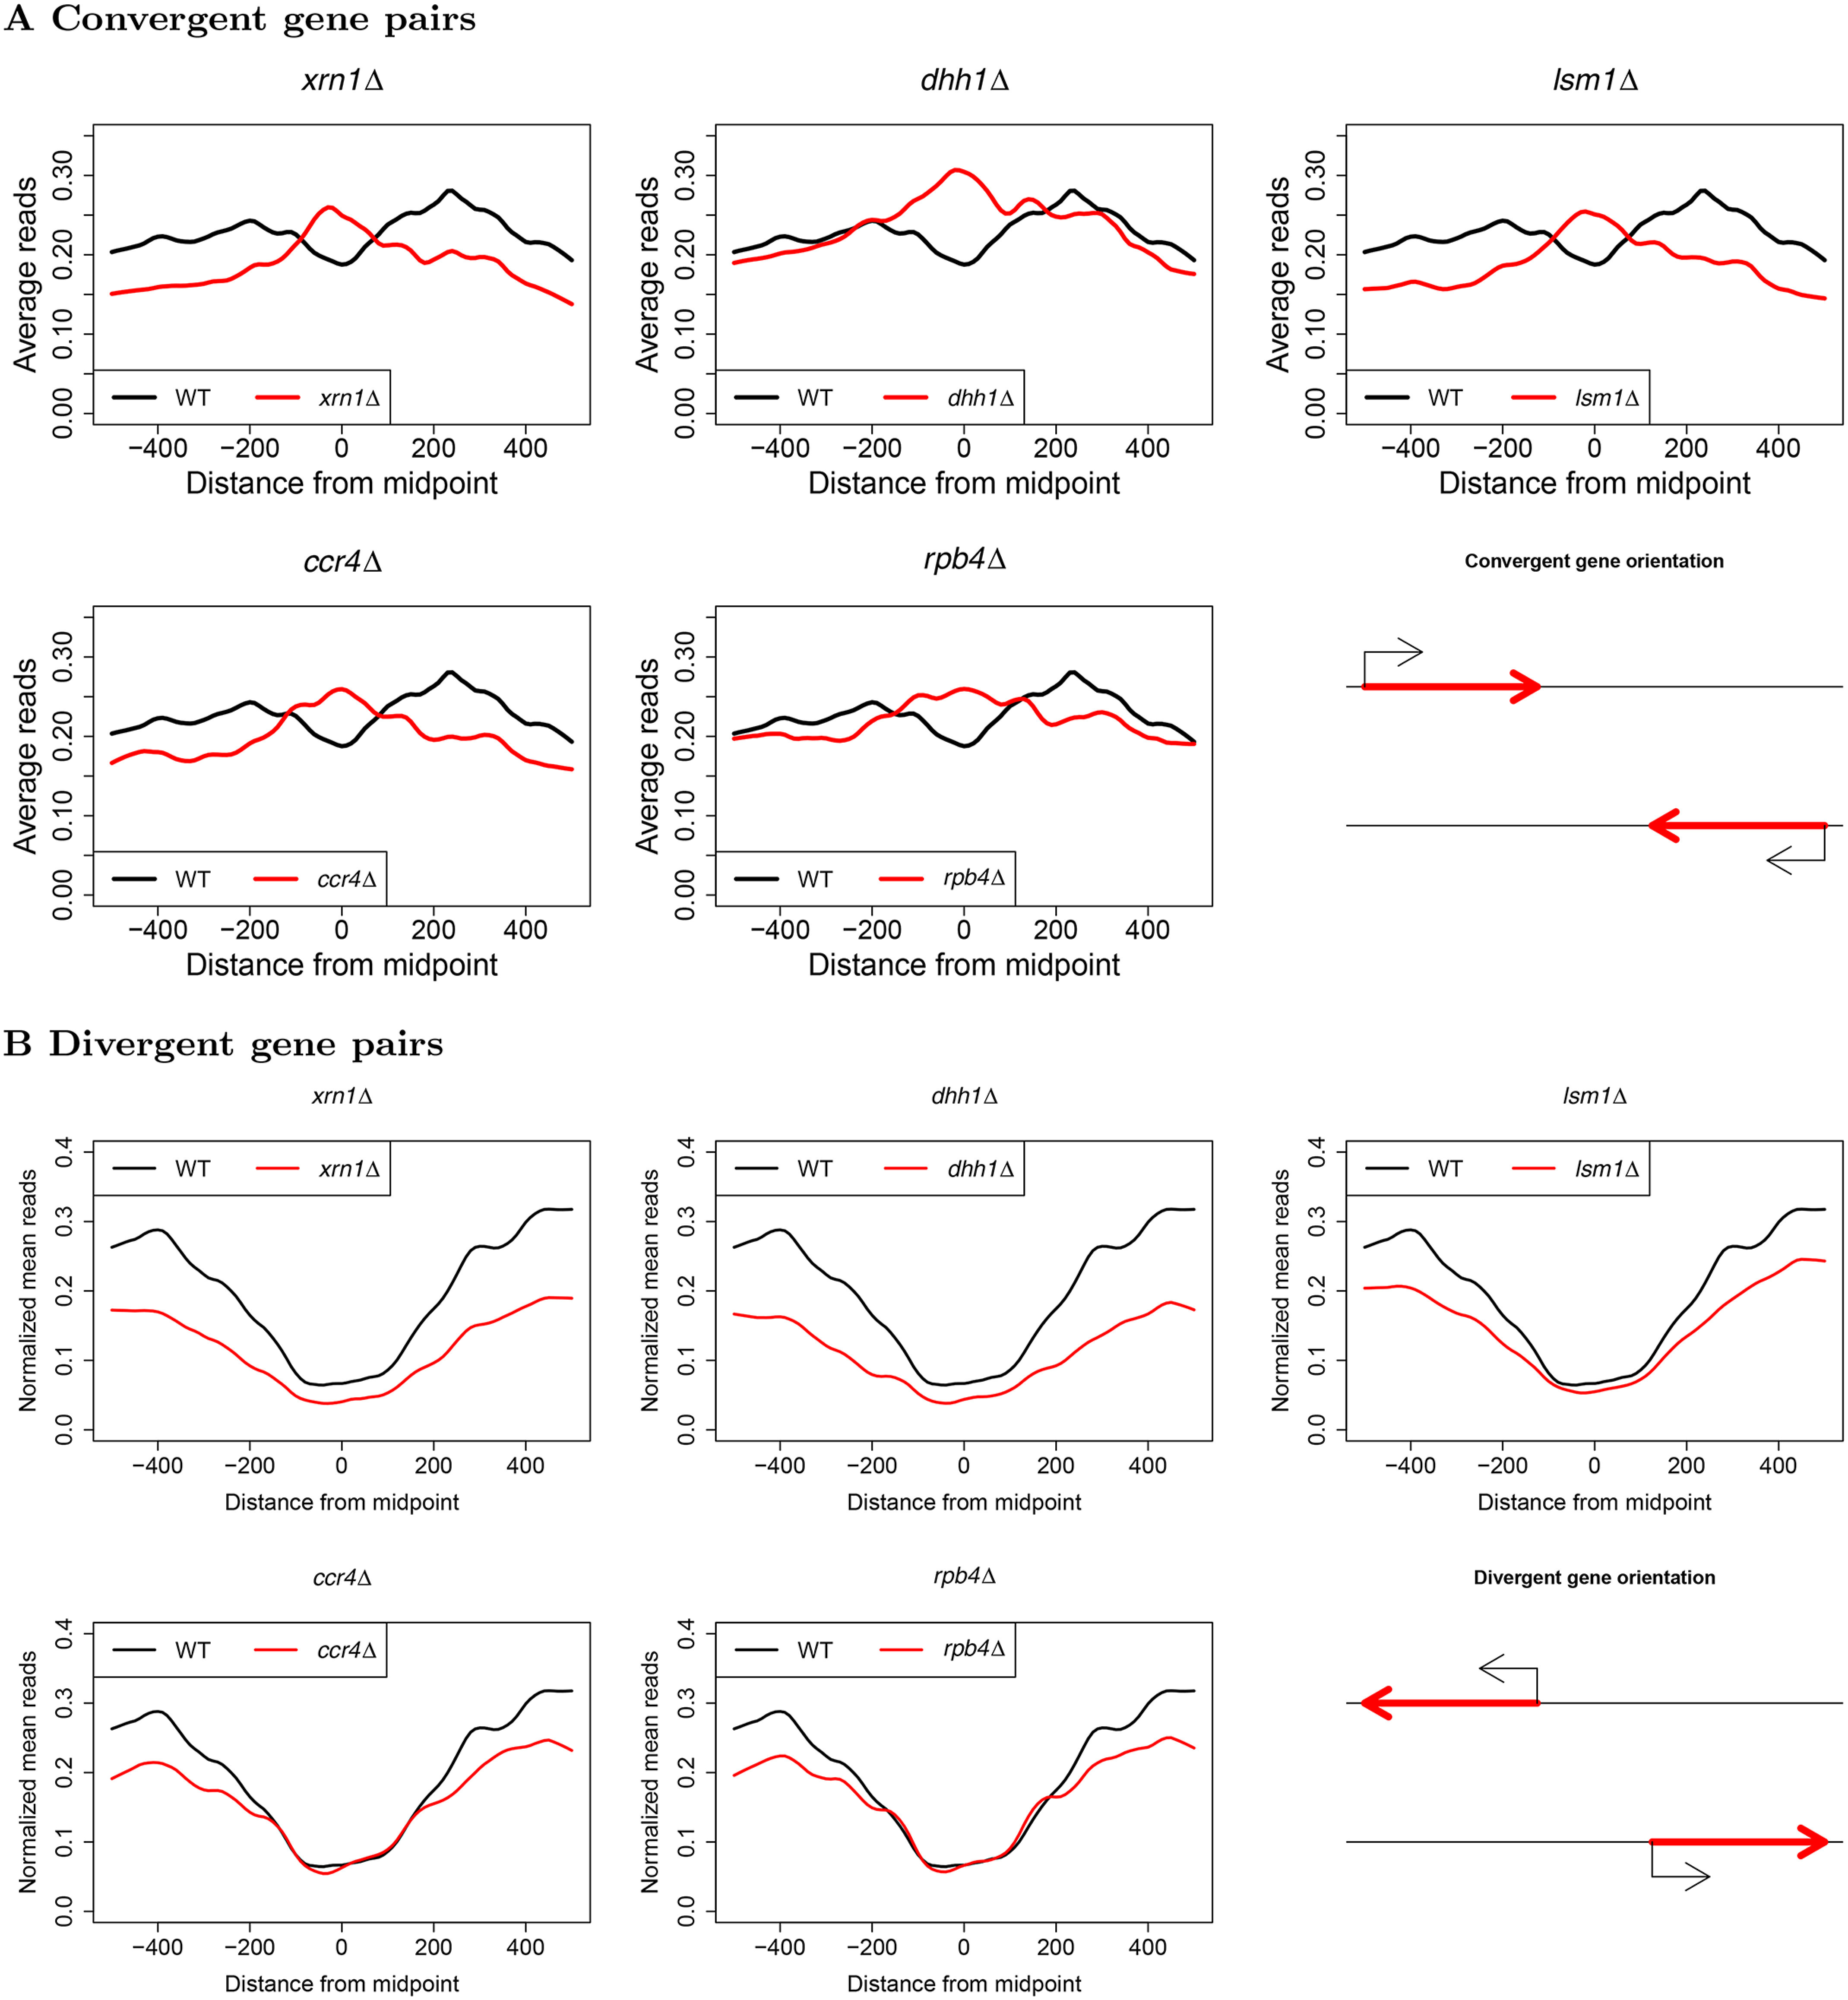
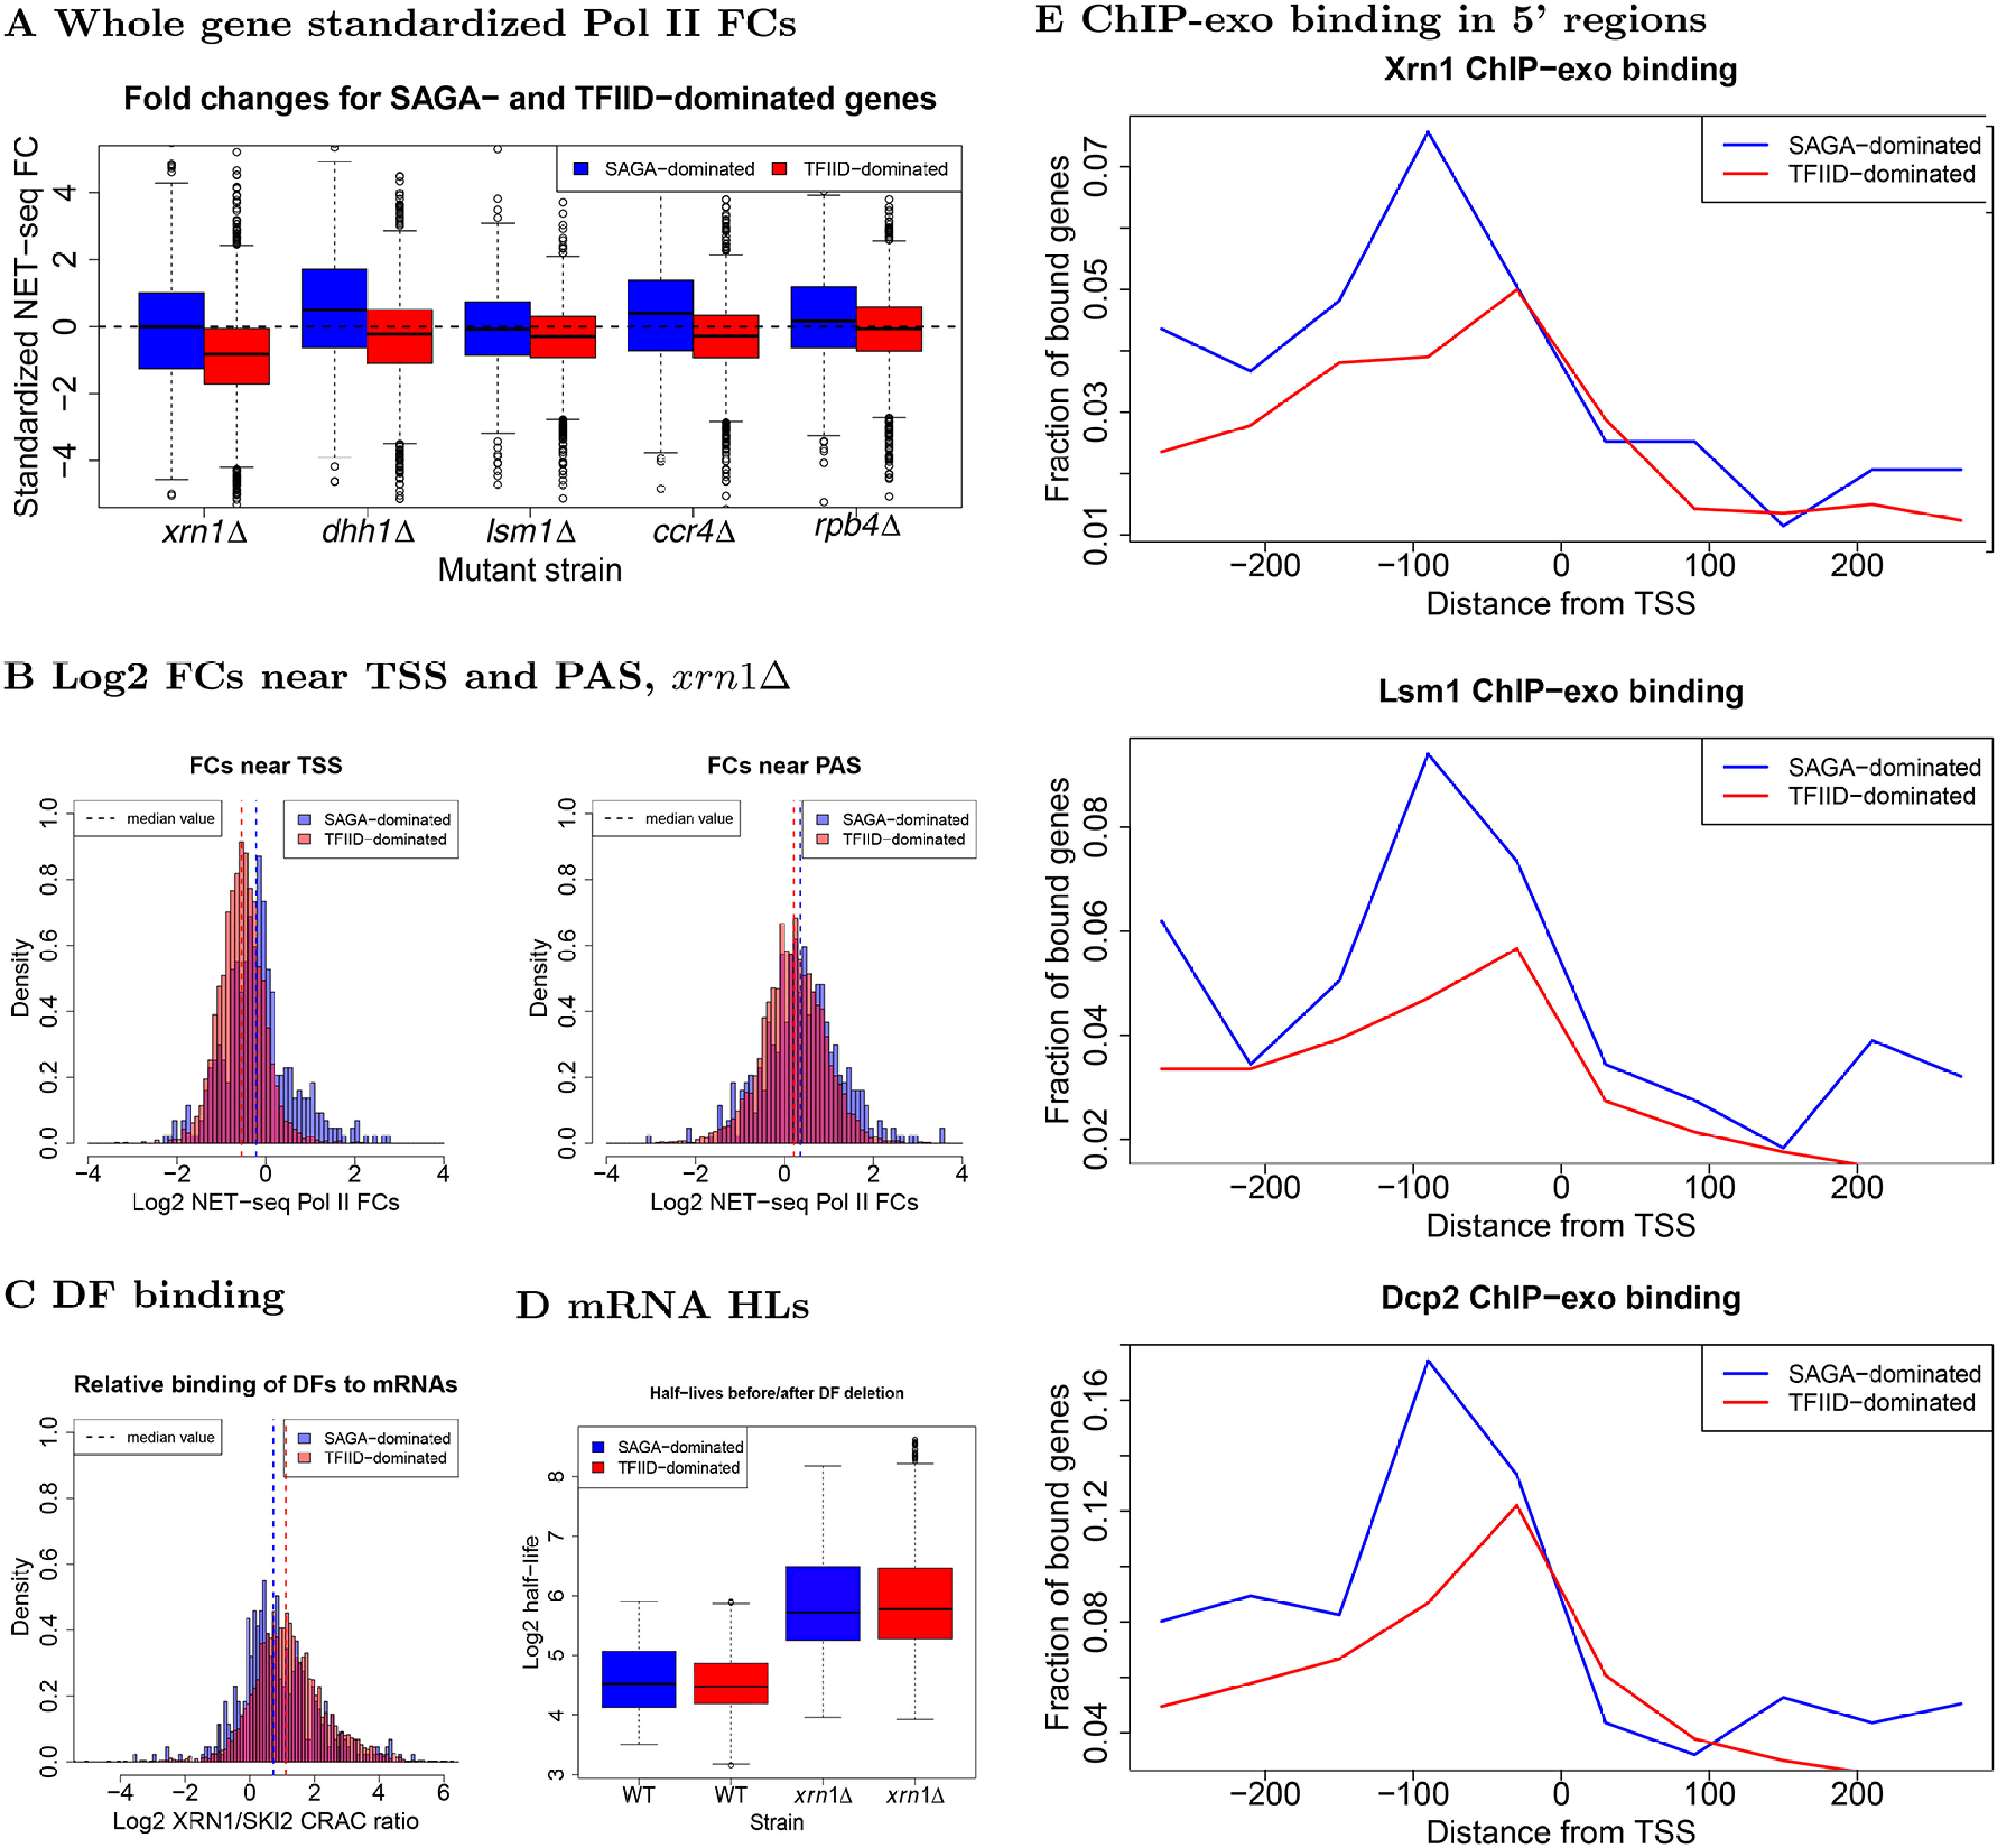
mRNA levels are determined by the balance between mRNA synthesis and decay. Protein factors that mediate both processes, including the 5'-3' exonuclease Xrn1, are responsible for a cross-talk between the two processes that buffers steady-state mRNA levels. However, the roles of these proteins in transcription remain elusive and controversial. Applying native elongating transcript sequencing (NET-seq) to yeast cells, we show that Xrn1 functions mainly as a transcriptional activator and that its disruption manifests as a reduction of RNA polymerase II (Pol II) occupancy downstream of transcription start sites. By combining our sequencing data and mathematical modeling of transcription, we found that Xrn1 modulates transcription initiation and elongation of its target genes. Furthermore, Pol II occupancy markedly increased near cleavage and polyadenylation sites in xrn1Δ cells, whereas its activity decreased, a characteristic feature of backtracked Pol II. We also provide indirect evidence that Xrn1 is involved in transcription termination downstream of polyadenylation sites. We noted that two additional decay factors, Dhh1 and Lsm1, seem to function similarly to Xrn1 in transcription, perhaps as a complex, and that the decay factors Ccr4 and Rpb4 also perturb transcription in other ways. Interestingly, the decay factors could differentiate between SAGA- and TFIID-dominated promoters. These two classes of genes responded differently to XRN1 deletion in mRNA synthesis and were differentially regulated by mRNA decay pathways, raising the possibility that one distinction between these two gene classes lies in the mechanisms that balance mRNA synthesis with mRNA decay.

Keywords: Xrn1; gene regulation; mRNA buffering; mRNA decay; native elongating transcript sequencing (NET-seq); transcription factor; transcription regulation; transcriptional profiling; transcriptomics; yeast.


Conflict of interest statement

Conflict of interest—The authors declare no conflicts of interest.

Figures

Figure 1.
Figure 1.
Fold changes in NET-seq Pol II occupancy. A, we aggregated NET-seq reads within annotated gene boundaries (TSS to PAS) and applied DESeq2 (33) to estimate standardized fold changes (FC) in each gene's normalized signal with respect to the WT. Both xrn1Δ and WT were done in two replicates. Normalization across runs was performed by selecting sets of housekeeping genes (see text and “Materials and methods”). B, the visualized correlation matrix for standardized fold changes in NET-seq reads in genes. Each entry corresponds to the Spearman correlation between the fold change with respect to the WT in NET-seq reads in annotated genes. xrn1Δ, dhh1Δ, lsm1Δ, ccr4Δ, and rpb4Δ come from the experiments associated with this paper, whereas the rest come from Ref. . Fold changes were estimated using DESeq2 (33) with both experiments analyzed simultaneously. C, genes were stratified using previously obtained measures of Xrn1 responsiveness, an aggregated measure of the sensitivity of synthesis and decay rates to Xrn1 deletion as measured in (1). A value of 2 indicates the lowest sensitivity and 10 the highest. Standardized NET-seq fold changes from our experiments were then plotted for genes falling into each responsiveness classification.
Figure 2.
Figure 2.
Comparison of normalized full-body metagenes. Normalized reads were aggregated from 200 bp before TSS to 200 bp after PAS. The −200:500 with respect to TSS and −500:200 with respect to PAS were kept fixed and the remaining parts of genes were re-scaled to 500 bp. To avoid compression, only genes at least 1100 bp long were included. Fig. S6 shows that similar profiles were obtained when all genes were analyzed and re-scaled to lengths of 1000 bp. Finally, the read counts corresponding to the new “metapositions” were averaged to yield a picture of Pol II occupancy along whole gene bodies. Different panels show comparisons between WT and the indicated deletion strains.
Figure 3.
Figure 3.
Metagene profiles near TSS in WT and xrn1Δ for Pol II and BioGRO/NET-seq ratios. A, we extracted NET-seq reads (–100:500 relative to TSS), normalized, and averaged them. Genes were separated into those which are stimulated (FC < 2) or repressed by Xrn1 (FC > 0). Note that the axes are on different scales to facilitate comparison of profile shapes within each panel. B, we applied a mathematical model (see “Materials and methods”) to investigate how initiation and elongation rates affect metagenes. Elongation rates for WT and mutant metagenes were estimated and initiation rates (r) were varied to find the best fits. L, varying initiation rates while using only the estimated WT elongation rates; R, varying initiation rates while using the estimated elongation rates from the xrn1Δ metagene. See Fig. S8 for other mutants. C, we extracted BioGRO and NET-seq values in the −100:500 region with respect to the TSS for all genes. For each gene, we smoothed the BioGRO and NET-seq profiles and took the log2 of their ratios. We then averaged over all genes to yield elongation efficiency metagenes. The profile shapes should be compared rather than the raw values due to potential differences in the scales of the BioGRO data. D, comparison of fold changes in elongation efficiency as a function of fold changes in NET-seq Pol II occupancy in xrn1Δ cells in the first 500 bp downstream of TSS. Genes were sorted into bins such that those in bin 1 had the largest reductions in occupancy, whereas those in bin 10 had slight increases. See “Materials and methods” for more details.
Figure 4.
Figure 4.
Schematic of mathematical model. The key parameters are α, β, λ, and ℓ, corresponding to the initiation, termination, and profile of elongation rates, respectively, plus the width of the polymerase. Note that λi gives the site-specific elongation rates, and a polymerase cannot move when blocked by another. These quantities can be estimated from the Pol II occupancy profiles produced using our NET-seq data, which are denoted as ρi. In particular, up to a common constant multiplicative factor J, λi ∼ J × [ρi(1 – ρi)]−1, α ∼ J × [1 – ℓ ρ1]−1, and β ∼ J × [ρL]−1. See “Materials and methods” or Ref. for additional details.
Figure 5.
Figure 5.
Metagene profiles near PAS in WT and xrn1Δ for Pol II and BioGRO/NET-seq ratios. A, we extracted NET-seq reads (−150:150 relative to PAS), normalized, and averaged them. Genes were separated into those that are stimulated (FC < 2) or repressed by Xrn1 (FC > 0). Note that the axes are on different scales to facilitate comparison of profile shapes within each panel. B, we extracted BioGRO and NET-seq values in the −150:150 region with respect to the PAS for all genes. For each gene, we smoothed the BioGRO and NET-seq profiles and took the log2 of their ratios. We then averaged over all genes to yield elongation efficiency metagenes. The profile shapes should be compared rather than the raw values due to potential differences in scales of the BioGRO data.
Figure 6.
Figure 6.
Metagene analysis with respect to midpoints between genes for convergent and divergent gene pairs. Convergent and divergent gene pairs were determined by the lengths between their PAS (convergent) and TSS (divergent). Midpoints between genes were defined as the halfway point between these respective features, and gene distances were computed as the difference between the annotated features on the negative and positive strand, respectively. Normalized NET-seq reads were then extracted for sites within 500 bp of gene midpoints and subsequently averaged to produce the metagene profiles.
Figure 7.
Figure 7.
Comparison of transcription, decay, and protein binding for SAGA- and TFIID-dominated genes. A, fold changes, computed as described in the legend to Fig. 1A, for SAGA- or TFIID-dominated genes, as indicated. B, histograms of log2 NET-seq Pol II FCs for regions near TSS (−100:500) and PAS (−150:150) in xrn1Δ. C, we summed Xrn1 and Ski2 CRAC data (60) mapped to each gene and took the log2 ratio of mapped reads for each DF in each gene. D, comparison of mRNA half-lives before and after XRN1 deletion (2). E, reads were binned into windows of 60 bp starting 300 bp upstream and extending 300 bp downstream of TSS. The proportion of bins having more than 10 recorded reads was then computed across the genome and plotted (1). Due to coverage differences across the Xrn1, Lsm1, and Dcp2 experiments, only the qualitative behavior between different panels should compared. Within panels, the fractions may be compared without worry.

References

    1. Haimovich G., Medina D. A., Causse S. Z., Garber M., Millán-Zambrano G., Barkai O., Chávez S., Pérez-Ortín J. E., Darzacq X., and Choder M. (2013) Gene expression is circular: factors for mRNA degradation also foster mRNA synthesis. Cell 153, 1000–1011 10.1016/j.cell.2013.05.012 - DOI - PubMed
    1. Medina D. A., Jordán-Pla A., Millán-Zambrano G., Chávez S., Choder M., and Pérez-Ortín J. E. (2014) Cytoplasmic 5′-3′ exonuclease Xrn1p is also a genome-wide transcription factor in yeast. Front. Genet. 5, 1 10.3389/fgene.2014.00001 - DOI - PMC - PubMed
    1. Choder M. (2004) Rpb4 and Rpb7: subunits of RNA polymerase II and beyond. Trends Biochem. Sci 29, 674–681 10.1016/j.tibs.2004.10.007 - DOI - PubMed
    1. Collart M. A. (2016) The CCR4-NOT complex is a key regulator of eukaryotic gene expression. Wiley Interdiscip. Rev. RNA 7, 438–454 10.1002/wrna.1332 - DOI - PMC - PubMed
    1. Goler-Baron V., Selitrennik M., Barkai O., Haimovich G., Lotan R., and Choder M. (2008) Transcription in the nucleus and mRNA decay in the cytoplasm are coupled processes. Genes Dev. 22, 2022–2027 10.1101/gad.473608 - DOI - PMC - PubMed

Publication types

MeSH terms

LinkOut - more resources