. 2020 Jun 9;10(1):9274.
doi: 10.1038/s41598-020-66445-4.

Prevalence and characterization of severe asthma in Hungary

Affiliations

Prevalence and characterization of severe asthma in Hungary

Zsuzsanna Csoma et al. Sci Rep. .

Abstract

Background: Severe asthma (SA) database was established in Hungary to estimate the prevalence of SA and to define and analyze clinical phenotypes of the patients.

Methods: SA questionnaires were sent out to 143 public pulmonary dispensaries specialized for diagnosing and caring pulmonary patients. Data of 520 SA patients were evaluated.

Results: The prevalence of SA within the asthmatic population in Hungary was 0.89%. The mean age of patients were 56.4 ± 13.4 years, SA were more frequent in females (64%), the prevalence of allergy was 56.6%, 72.1% of patients had persistent airflow limitation (FEV1 < 80%), 37.9% severe airway obstruction (FEV1 ≤ 60%), 33.6% required systemic corticosteroid maintenance therapy, 21.5% had salicylate intolerance and 43.2% rhinosinusitis. A Bayesian dependency network was calculated which revealed several interdependencies between the characteristics. E.g. there was a strong association between salicylate intolerance and rhinosinusitis, more patients received regular systemic corticosteroid treatment who had salicylate intolerance and the proportion of salicylate intolerance was significantly higher in females.

Conclusion: The prevalence of SA was determined in Hungary which was lower than in other studies. Using a Bayesian-based network analysis several interdependencies were revealed between patient characteristics.


Conflict of interest statement

The authors declare no competing interests.

Figures

Figure 1
Figure 1
Proportion of severe asthma patients with allergy and allergic/non-allergic severe asthmatics with systemic corticosteroid dependence. The areas of the ellipses in the Venn diagram represent the percentage of the investigated patient groups and the placement of them shows the relationship and the overlap of these data sets. 1. Total asthma population (n = 520). 2. Proportion of patients with allergy: 56.6%. 3. Proportion of patients with systemic corticosteroid dependence: 33.6% from which 58.0% is allergic and 42.0% non-allergic).
Figure 2
Figure 2
Bayesian dependency network of 10 characteristics in 520 severe asthmatic patients. An edge between two nodes (i.e. characteristics) represents direct casual relevance, and its width is proportional to the probability of the corresponding nodes being directly relevant to each other (i.e. taking into account both possible edge directions assuming an underlying Bayesian network). Those connections are depicted where the a posteriori values between characteristics are larger than 0.15. The exact values can also be seen in Table 2. Positive (+) sign on an edge means that the direction of the relation is positive, e.g. patients with higher “best FEV1” have higher chance of having better “worst FEV1” value. Negative (−) sign indicates that the direction of the relation is opposite, “A” indicates adult, “M” male. E.g. “A-“ on the edge between “Disease onset” and “Allergy” means that allergy associates with childhood onset and not with adult onset. These relations can be seen in Fig. 3 and Table 3.
Figure 3
Figure 3
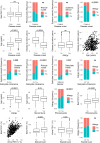
Pairwise relations of some characteristics. Only those relations are shown where the a posteriori probability of direct casual relevance is higher than 0.15 and there is an edge between them in Fig. 2. The a posteriori probability values are shown in Table 2. The relevance revealed by BN-BMLA were confirmed with conventional statistics. Comparisons of means and proportions were carried out by Medcalc online calculator. P values indicating significant differences (p < 0.05) are shown for each comparison, ns means non-significant. Values and significant results are also shown in Table 3.

References

    1. Chastek B, et al. Economic burden of illness among patients with severe asthma in a managed care setting. J. Manag. Care Spec. Pharm. 2016;22:848–861. - PMC - PubMed
    1. Tough SC, et al. Features that distinguish those who die from asthma from community controls with asthma. J. Asthma. 1998;35:657–665. doi: 10.3109/02770909809048968. - DOI - PubMed
    1. Kupczyk M, Wenzel S. US and European severe asthma cohorts: What can they teach us about severe asthma? Journal of Internal Medicine. 2012;272:121–132. doi: 10.1111/j.1365-2796.2012.02558.x. - DOI - PubMed
    1. Anderson GP. Endotyping asthma: new insights into key pathogenic mechanisms in a complex, heterogeneous disease. The Lancet. 2008;372:1107–1119. doi: 10.1016/S0140-6736(08)61452-X. - DOI - PubMed
    1. ENFUMOSA Study Group. The ENFUMOSA cross-sectional European multicentre study of the clinical phenotype of chronic severe asthma. European Network for Understanding Mechanisms of Severe Asthma. Eur. Respir. J. 2003;22:470–7. - PubMed

Publication types