

The impacts of ocean acidification on marine trace gases and the implications for atmospheric chemistry and climate
- PMID: 32518503
- PMCID: PMC7277135
- DOI: 10.1098/rspa.2019.0769
The impacts of ocean acidification on marine trace gases and the implications for atmospheric chemistry and climate
Abstract
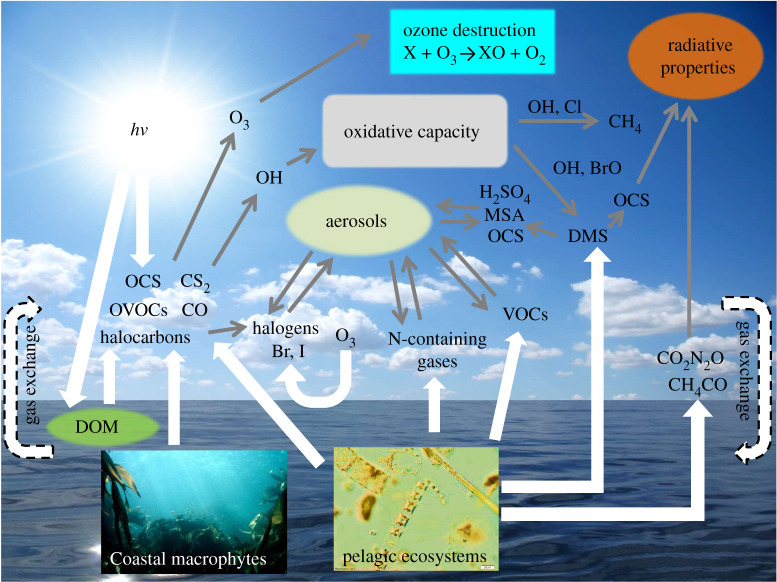
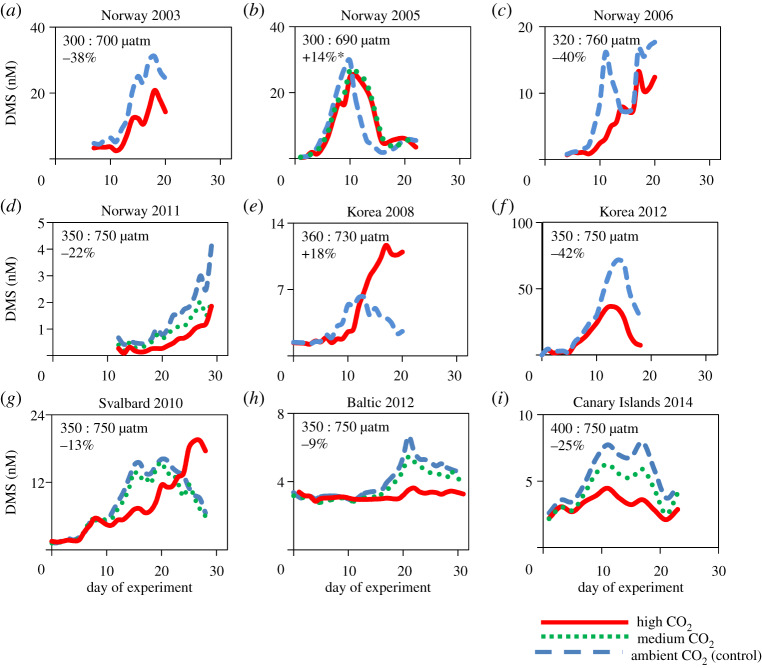
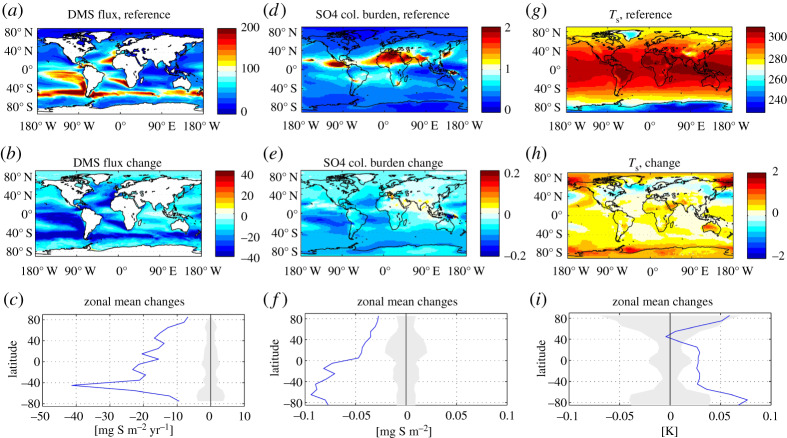
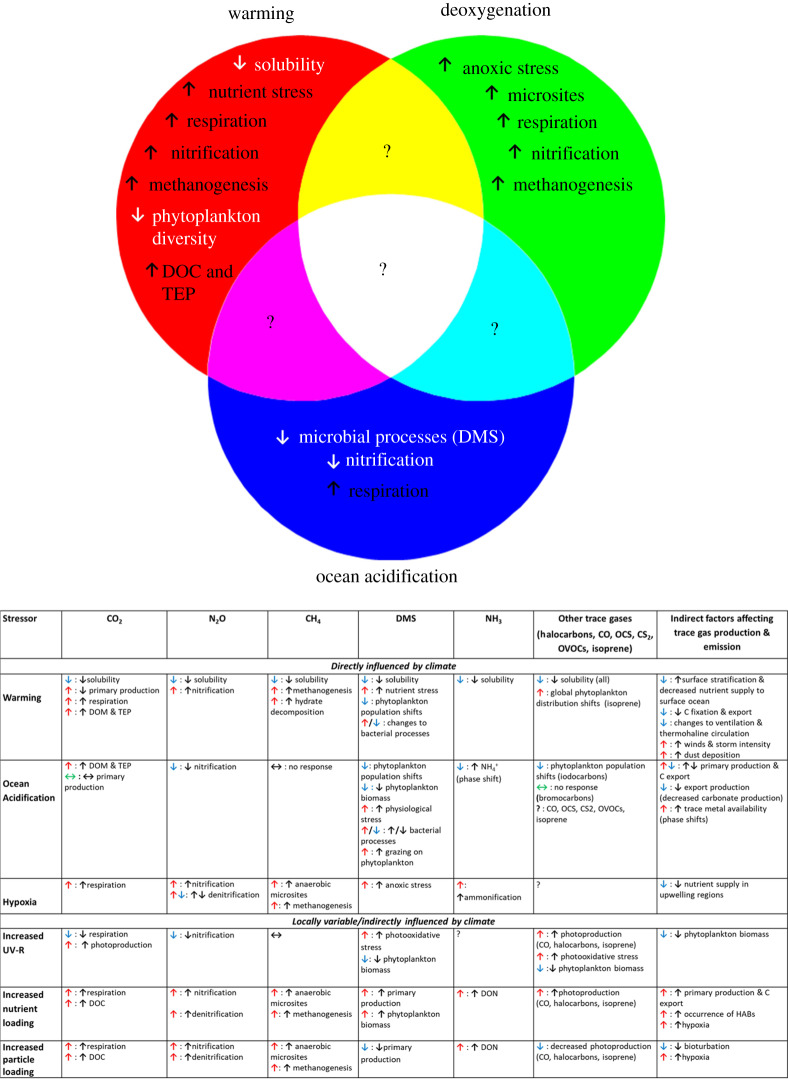
Surface ocean biogeochemistry and photochemistry regulate ocean-atmosphere fluxes of trace gases critical for Earth's atmospheric chemistry and climate. The oceanic processes governing these fluxes are often sensitive to the changes in ocean pH (or pCO2) accompanying ocean acidification (OA), with potential for future climate feedbacks. Here, we review current understanding (from observational, experimental and model studies) on the impact of OA on marine sources of key climate-active trace gases, including dimethyl sulfide (DMS), nitrous oxide (N2O), ammonia and halocarbons. We focus on DMS, for which available information is considerably greater than for other trace gases. We highlight OA-sensitive regions such as polar oceans and upwelling systems, and discuss the combined effect of multiple climate stressors (ocean warming and deoxygenation) on trace gas fluxes. To unravel the biological mechanisms responsible for trace gas production, and to detect adaptation, we propose combining process rate measurements of trace gases with longer term experiments using both model organisms in the laboratory and natural planktonic communities in the field. Future ocean observations of trace gases should be routinely accompanied by measurements of two components of the carbonate system to improve our understanding of how in situ carbonate chemistry influences trace gas production. Together, this will lead to improvements in current process model capabilities and more reliable predictions of future global marine trace gas fluxes.
Keywords: atmospheric chemistry; climate; marine trace gases; ocean acidification.
© 2020 The Authors.
Conflict of interest statement
We declare we have no competing interests.
Figures
References
-
- Ciais P, et al. 2014. Carbon and other biogeochemical cycles. Climate change 2013: the physical science basis. In Contribution of working group I to the fifth assessment report of the intergovernmental panel on climate change, pp. 465–570. Cambridge, UK: Cambridge University Press.
-
- Myhre G, et al. 2013. Climate change 2013: the physical science basis. In Contribution of working group I to the fifth assessment report of the intergovernmental panel on climate change (eds Tignor K, Allen SK, Boschung J, Nauels A, Xia Y, Bex V, Midgley PM). Cambridge, UK: Cambridge University Press.
-
- Fuge R, Johnson CC. 2015. Iodine and human health, the role of environmental geochemistry and diet, a review. Appl. Geochem. 63, 282–302. (10.1016/j.apgeochem.2015.09.013) - DOI
-
- Charlson RJ, Lovelock JE, Andreae MO, Warren SG. 1987. Oceanic phytoplankton, atmospheric sulphur, cloud albedo and climate. Nature 326, 655–661. (10.1038/326655a0) - DOI
-
- Andreae MO, Crutzen PJ. 1997. Atmospheric aerosols: biogeochemical sources and role in atmospheric chemistry. Science 276, 1052–1058. (10.1126/science.276.5315.1052) - DOI
Publication types
Associated data
LinkOut - more resources
Full Text Sources