

Randomized Clinical Trial on the Effect of Bardoxolone Methyl on GFR in Diabetic Kidney Disease Patients (TSUBAKI Study)
- PMID: 32518870
- PMCID: PMC7271944
- DOI: 10.1016/j.ekir.2020.03.030
Randomized Clinical Trial on the Effect of Bardoxolone Methyl on GFR in Diabetic Kidney Disease Patients (TSUBAKI Study)
Abstract
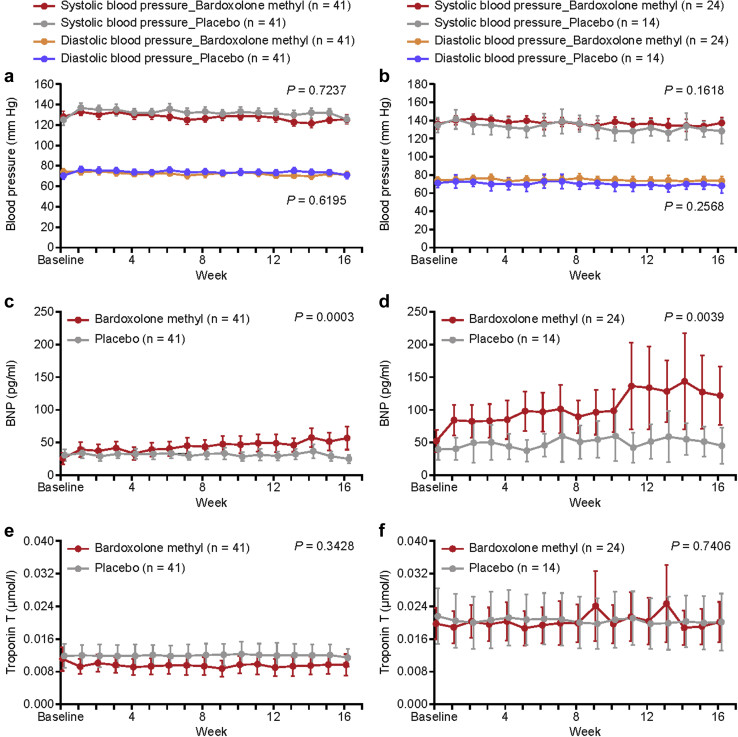
Introduction: Bardoxolone methyl significantly increases estimated glomerular filtration rate (eGFR) in patients with chronic kidney disease (CKD). However, the phase 3 study, Bardoxolone Methyl Evaluation in Patients with Chronic Kidney Disease and Type 2 Diabetes Mellitus: the Occurrence of Renal Events (BEACON), was terminated prematurely because bardoxolone methyl increased the risk for early-onset fluid overload in patients with identifiable risk factors for heart failure (elevated baseline B-type natriuretic peptide levels >200 pg/ml and prior history of hospitalization for heart failure). The Phase 2 Study of Bardoxolone Methyl in Patients with Chronic Kidney Disease and Type 2 Diabetes (TSUBAKI) study aimed to determine if patients without risk factors can mitigate the risk for fluid overload and whether changes in eGFR with bardoxolone methyl reflect true increases in GFR.
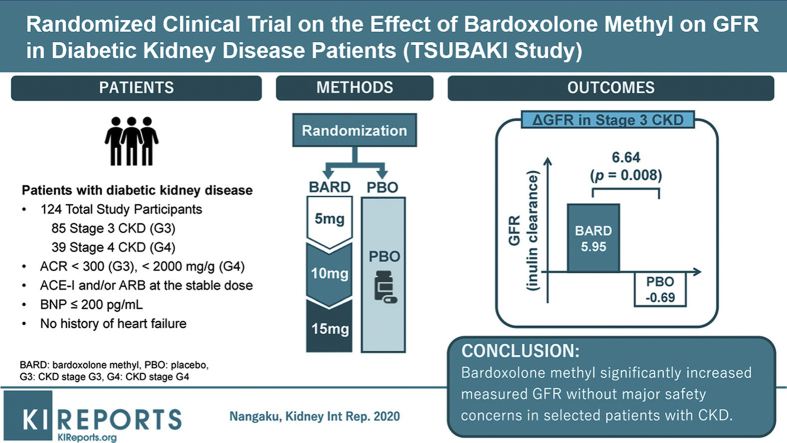
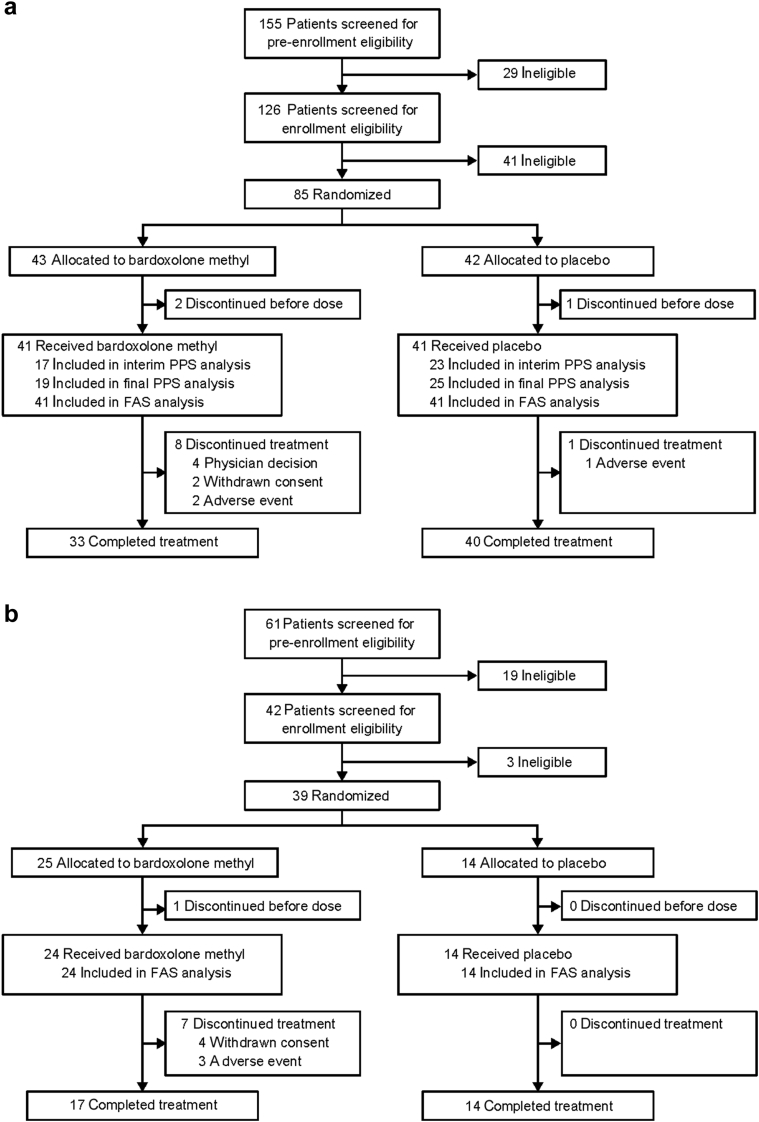
Methods: This phase 2, randomized, multicenter, double-blind, placebo-controlled study enrolled patients with type 2 diabetes and stage 3-4 CKD. Patients were randomized 1:1 to bardoxolone methyl (n = 41) or placebo (n = 41) (cohort G3), or 2:1 to bardoxolone methyl (n = 24) or placebo (n = 14) (cohort G4), administered orally once daily for 16 weeks using a dose-titration scheme. The primary efficacy endpoint was change from baseline in GFR measured by inulin clearance at week 16 in the cohort G3.
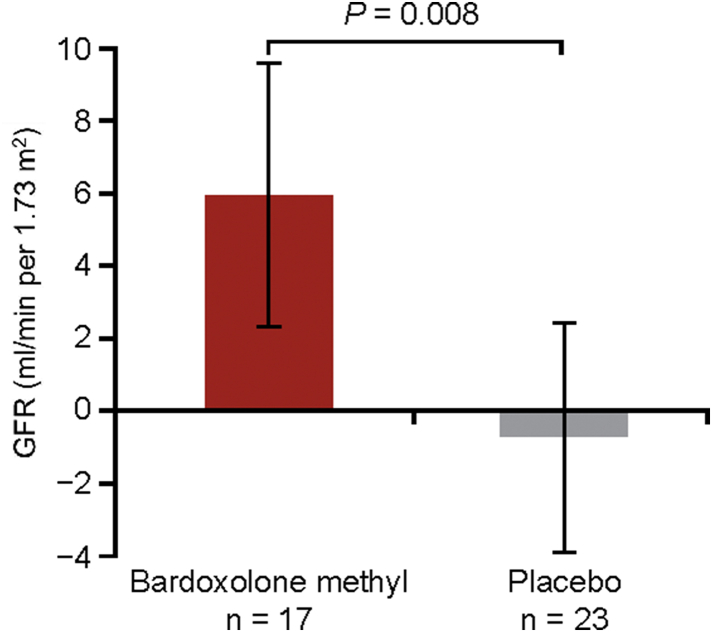
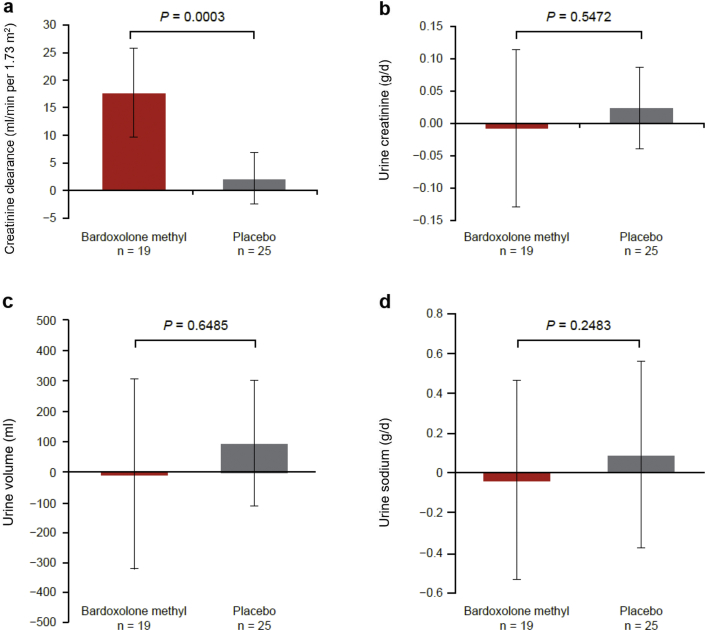
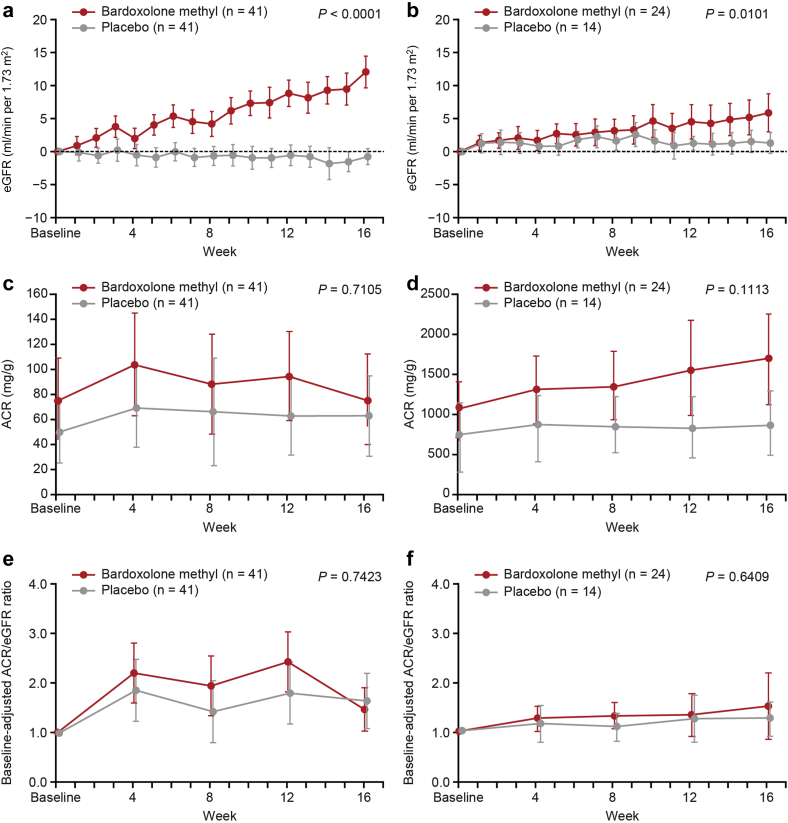
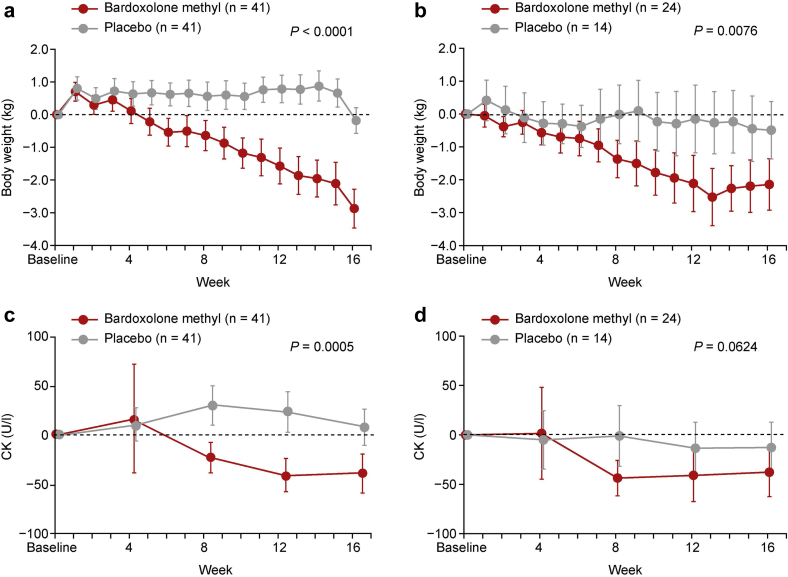
Results: A total of 40 patients were evaluated for the prespecified primary efficacy analysis. Mean change (95% confidence interval [CI]) from baseline in GFR was 5.95 (2.29 to 9.60) and -0.69 (-3.83 to 2.45) ml/min per 1.73 m2 for patients randomized to bardoxolone methyl and placebo, respectively, with a significant intergroup difference of 6.64 ml/min per 1.73 m2 (P = 0.008). Increases in the albumin/creatinine ratio were observed in the bardoxolone methyl group vs the placebo group. The most common adverse events (≥15% in either group) were viral upper respiratory tract infection, increased alanine aminotransferase, increased aspartate aminotransferase, increased γ-glutamyltransferase, and constipation. Peripheral edema was reported by 4 patients receiving bardoxolone methyl and by 1 patient receiving placebo; all events were mild and self-limiting. No patient died or experienced heart failure. The study discontinuation rate was higher in the bardoxolone methyl group (cohort G3, n = 8; cohort G4, n = 7) than the placebo group (cohort G3, n = 1; cohort G4, n = 0).
Conclusion: Bardoxolone methyl significantly increased measured GFR, and further investigation is ongoing to evaluate whether it provides clinical benefit without major safety concerns in selected patients with CKD.
Keywords: bardoxolone methyl; chronic kidney disease; diabetic kidney disease; glomerular filtration rate; heart failure; inulin clearance.
© 2020 International Society of Nephrology. Published by Elsevier Inc.
Figures
References
-
- Imai E., Horio M., Watanabe T. Prevalence of chronic kidney disease in the Japanese general population. Clin Exp Nephrol. 2009;13:621–630. - PubMed
-
- Yates M.S., Tauchi M., Katsuoka F. Pharmacodynamic characterization of chemopreventive triterpenoids as exceptionally potent inducers of Nrf2-regulated genes. Mol Cancer Ther. 2007;6:154–162. - PubMed
LinkOut - more resources
Full Text Sources
Other Literature Sources
Research Materials
Miscellaneous
