

Effect of dairy consumption and its fat content on glycemic control and cardiovascular disease risk factors in patients with type 2 diabetes: a randomized controlled study
- PMID: 32520346
- PMCID: PMC7398769
- DOI: 10.1093/ajcn/nqaa138
Effect of dairy consumption and its fat content on glycemic control and cardiovascular disease risk factors in patients with type 2 diabetes: a randomized controlled study
Abstract
Background: Dietary Guidelines for Americans recommend the consumption of 3 servings/d of low-fat/nonfat dairy. The effects of higher dairy consumption and its fat content are unknown in patients with type 2 diabetes.
Objective: Evaluate the impact of higher consumption of high- compared with low-fat dairy on glycated hemoglobin (HbA1c), body weight, and cardiovascular disease risk factors in patients with type 2 diabetes.
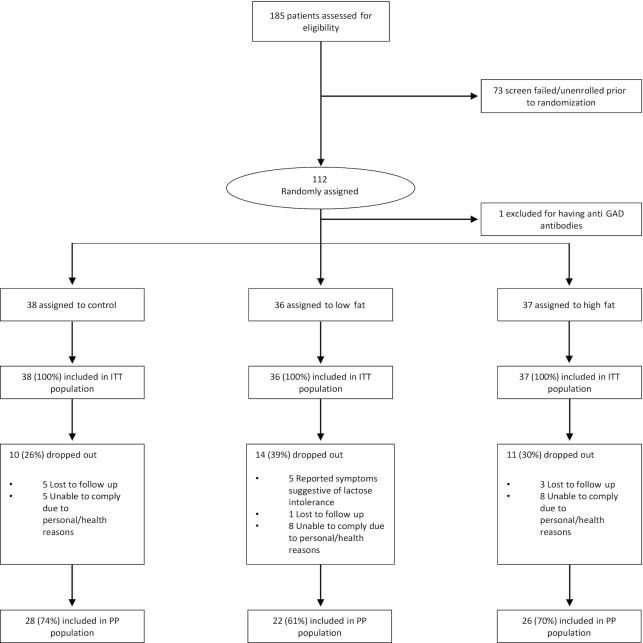
Methods: We enrolled 111 subjects with type 2 diabetes (aged 58.5 ± 8.9 y, 47% females, diabetes duration 13.2 ± 8.3 y, HbA1c 8.09 ± 0.96%) who consumed <3 servings of dairy/d. We randomly assigned them into 3 groups: control group maintained baseline dairy intake, low-fat (LF) group incorporated ≥3 servings/d of LF dairy, and the high-fat (HF) group incorporated ≥3 servings/d of HF dairy. We evaluated HbA1c, body weight, BMI, body composition parameters, blood pressure (BP), lipid parameters, homeostatic model assessment of insulin resistance (HOMA-IR), and total energy and macronutrient intake at baseline, and after 12 and 24 wk.
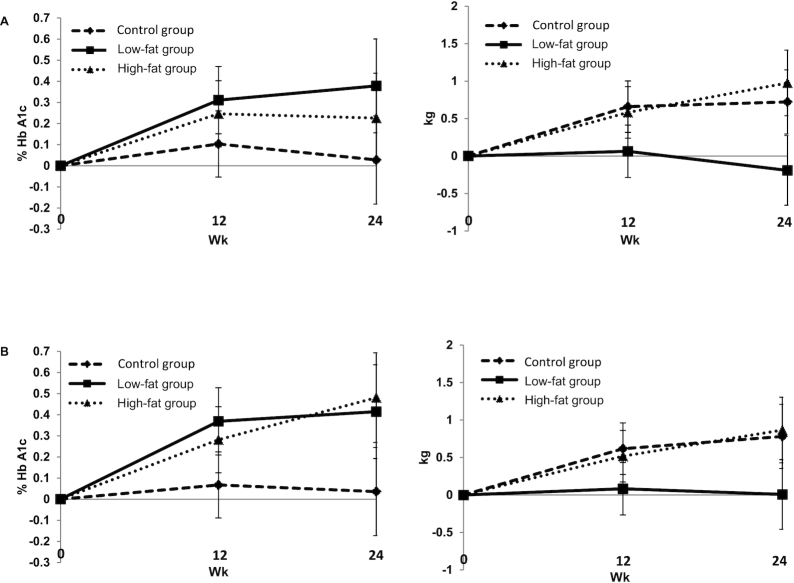
Results: At 24 wk, percent energy from saturated fat increased from baseline in the HF group by 3.6%, (95% CI: 2.2, 5.1) and decreased in the LF group by -1.9% (95% CI: -3.3, -0.4). The LF group increased their percent energy from protein by 4.5% (95% CI: 2.6, 6.4), whereas the HF group decreased their percent energy from carbohydrates by -3.4% (95% CI: -0.2, -6.7). There were no differences in the mean changes in HbA1c, body weight, BMI, body composition or lipid parameters, or BP between the 3 groups at 24 wk.
Conclusion: In patients with type 2 diabetes, increased dairy consumption to ≥3 servings/d compared with <3 servings/d, irrespective of its fat content, while maintaining energy intake has no effect on HbA1c, body weight, body composition, lipid profile, or BP. This trial was registered at clinicaltrials.gov as NCT02895867.
Keywords: HbA1c; body weight; dairy; high-fat; low-fat; type 2 diabetes.
Copyright © The Author(s) on behalf of the American Society for Nutrition 2020.
Figures
References
-
- US Department of Health and Human Services and US Department of Agriculture [Internet]. 2015–2020 Dietary Guidelines for Americans. 8th Edition Washington, DC: 2015. Available from: https://health.gov/our-work/food-and-nutrition/2015-2020-dietary-guideli....
-
- Mitri J, Yusof B-NM, Maryniuk M, Schrager C, Hamdy O, Salsberg V. Dairy intake and type 2 diabetes risk factors: a narrative review. Diabetes Metab Syndr. 2019;13(5):2879–87. - PubMed
-
- Gijsbers L, Ding EL, Malik VS, De Goede J, Geleijnse JM, Soedamah-Muthu SS. Consumption of dairy foods and diabetes incidence: a dose-response meta-analysis of observational studies. Am J Clin Nutr. 2016;103(4):1111–24. - PubMed
Publication types
MeSH terms
Substances
Associated data
Grants and funding
LinkOut - more resources
Full Text Sources
Medical
Research Materials
Miscellaneous
