. 2020 Jun 10;18(6):e3000687.
doi: 10.1371/journal.pbio.3000687. eCollection 2020 Jun.

IRE1α regulates macrophage polarization, PD-L1 expression, and tumor survival

Affiliations

IRE1α regulates macrophage polarization, PD-L1 expression, and tumor survival

Alyssa Batista et al. PLoS Biol. .

Abstract

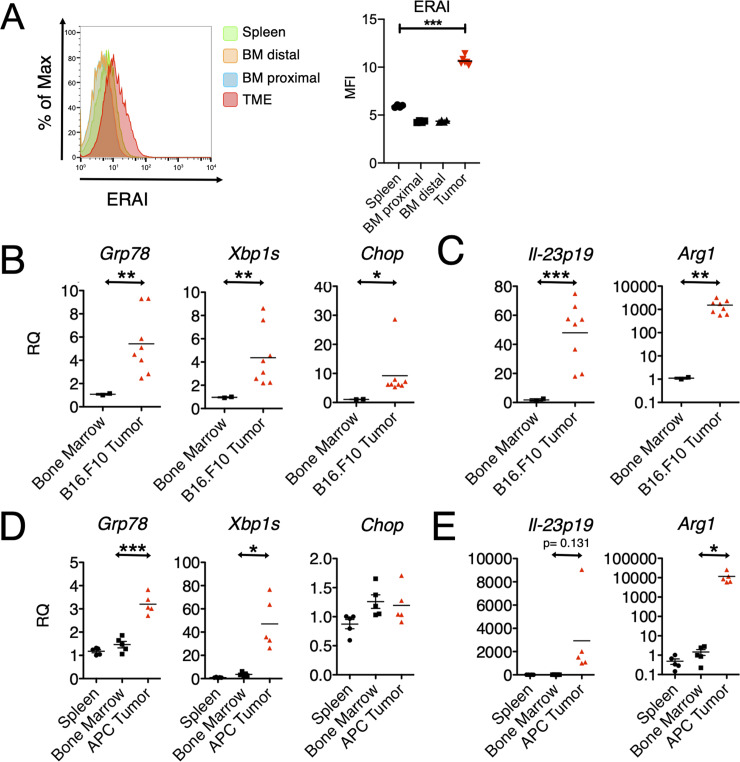
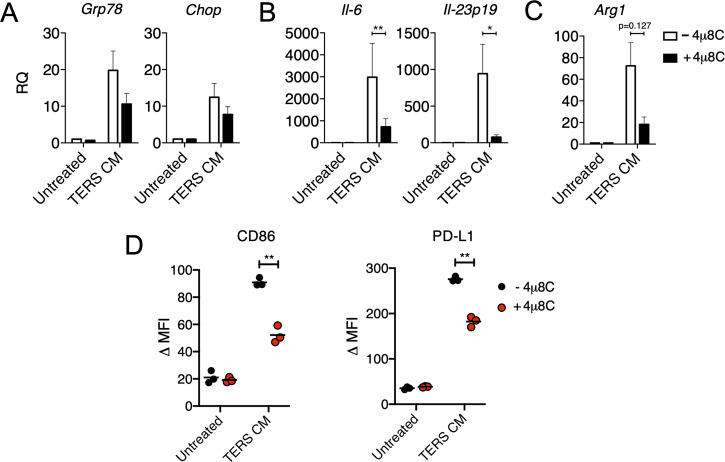
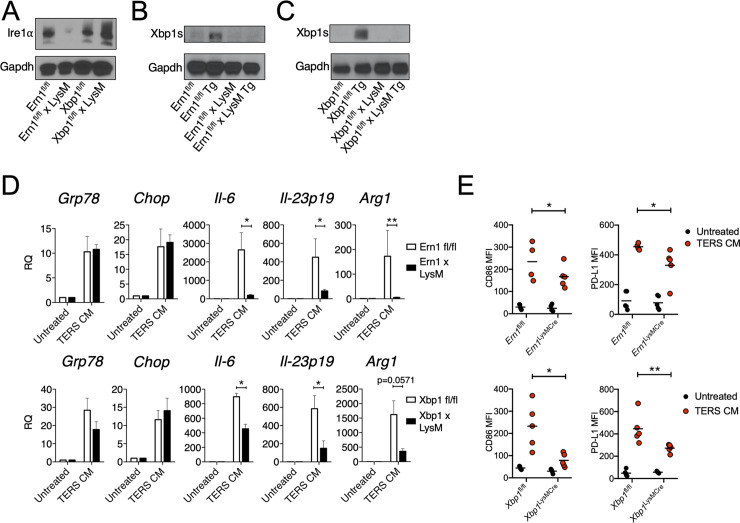
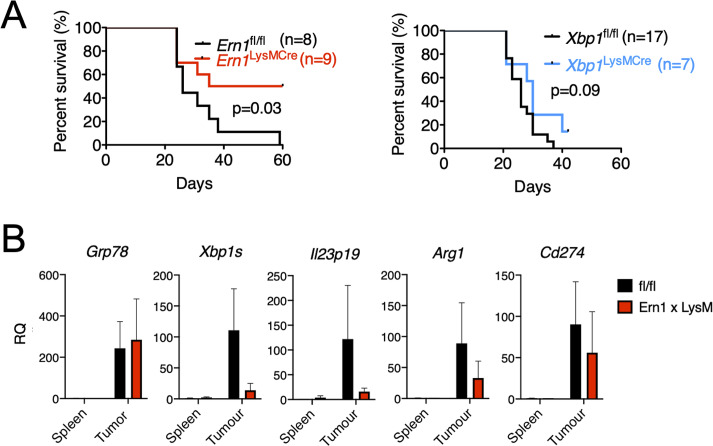
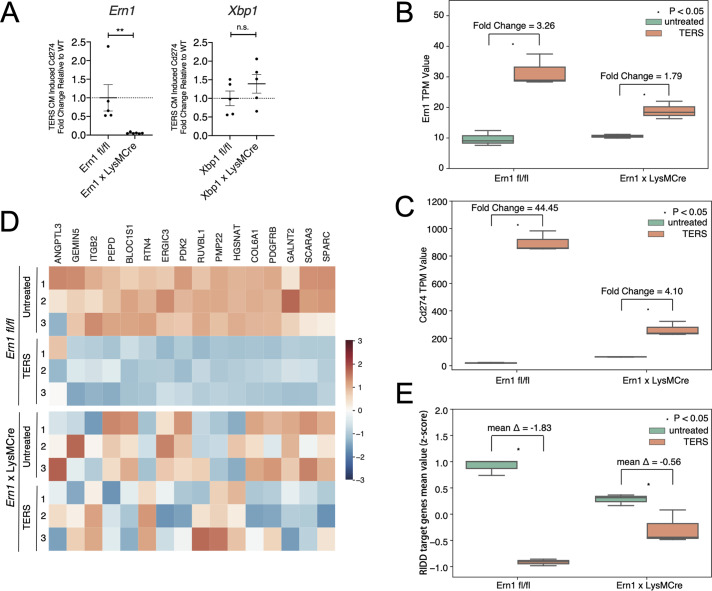
In the tumor microenvironment, local immune dysregulation is driven in part by macrophages and dendritic cells that are polarized to a mixed proinflammatory/immune-suppressive phenotype. The unfolded protein response (UPR) is emerging as the possible origin of these events. Here we report that the inositol-requiring enzyme 1 (IRE1α) branch of the UPR is directly involved in the polarization of macrophages in vitro and in vivo, including the up-regulation of interleukin 6 (IL-6), IL-23, Arginase1, as well as surface expression of CD86 and programmed death ligand 1 (PD-L1). Macrophages in which the IRE1α/X-box binding protein 1 (Xbp1) axis is blocked pharmacologically or deleted genetically have significantly reduced polarization and CD86 and PD-L1 expression, which was induced independent of IFNγ signaling, suggesting a novel mechanism in PD-L1 regulation in macrophages. Mice with IRE1α- but not Xbp1-deficient macrophages showed greater survival than controls when implanted with B16.F10 melanoma cells. Remarkably, we found a significant association between the IRE1α gene signature and CD274 gene expression in tumor-infiltrating macrophages in humans. RNA sequencing (RNASeq) analysis showed that bone marrow-derived macrophages with IRE1α deletion lose the integrity of the gene connectivity characteristic of regulated IRE1α-dependent decay (RIDD) and the ability to activate CD274 gene expression. Thus, the IRE1α/Xbp1 axis drives the polarization of macrophages in the tumor microenvironment initiating a complex immune dysregulation leading to failure of local immune surveillance.


Conflict of interest statement

The authors have declared that no competing interests exist.

Figures

Fig 1
Fig 1. Activation of the UPR and acquisition of the IIS phenotype by tumor-infiltrating CD11b+ cells in vivo.
(A) Flow cytometry histogram and comparative MFI values (n = 4) of ERAI expression in CD11b+ cells resident in specified tissue. (B,C) Gene expression in CD11b+ cells isolated from B16.F10 tumors grown in C57BL/6 mice and respective bone marrow (n ≥ 2 per group). Gene expression was arbitrarily normalized to one bone marrow sample, and values represent RQ fold transcription expression. (D,E) Gene expression in CD11b+ cells isolated from APC adenomas and respective bone marrow and spleen (n ≥ 2 per group). RNA extracted from these cells was analyzed by RT-qPCR using specific primers. Data are included in S1 Data. APC, adenomatous polyposis coli; Arg1, Arginase1; BM, bone marrow; Chop, CCAAT-enhancer-binding protein homologous protein; ERAI, endoplasmic reticulum stress-activated indicator; Grp78, 78-kDa glucose-regulated protein; IIS, proinflammatory/immune-suppressive; IL, interleukin; MFI, mean fluorescent intensity; RQ, relative quantification; RT-qPCR, reverse transcriptase quantitative PCR; TME, tumor microenvironment; UPR, unfolded protein response; Xbp1s, spliced X-box binding protein 1.
Fig 2
Fig 2. Chemical IRE1α inhibition prevents IIS polarization of BMDM in vitro.
BMDM were culture in vitro in TERS CM for 18 hours with or without 4u8C (30 μΜ) and their mRNA subsequently tested by RT-qPCR to detect the expression of (A) UPR genes (Grp78 and Chop), (B) proinflammatory cytokines (Il6 and Il23p19), and (C) immune suppression genes (Arg1) (n = 3–5 per group). RQ was determined by arbitrarily normalizing gene expression to a vehicle CM condition. Data points are expressed as means ± SEM. (D) Flow cytometry analysis of the intracellular expression of Venus protein (ERAI), and CD86 and PD-L1 surface expression in BMDM treated with TERS CM with or without 4u8C (30 μΜ). Data are included in S1 Data. Arg1, Arginase1; BMDM, bone marrow–derived macrophage; Chop, CCAAT-enhancer-binding protein homologous protein; CM, conditioned medium; ERAI, endoplasmic reticulum stress-activated indicator; Grp78, 78-kDa glucose-regulated protein; IIS, proinflammatory/immune-suppressive; Il, interleukin; IRE1α, inositol-requiring enzyme 1; MFI, mean fluorescent intensity; PD-L1, programmed death-ligand 1; RQ, relative quantification; RT-qPCR, reverse transcriptase quantitative PCR; TERS CM, transmissible ER stress CM; UPR, unfolded protein response.
Fig 3
Fig 3. Deficiency in the IRE1α-XBP1 axis in macrophages attenuates the IIS phenotype, PD-L1 expression, and tumor growth.
(A) Western blot analysis of Ern1-CKO BMDM showing lack of Ire1α upon activation (24 hours) by Tg (300 nM). (B) Western blot analysis of Ern1-CKO BMDM showing lack of Xbp1s following activation (24 hours) by Tg (300 nM). (C) Western blot analysis of Xbp1-CKO BMDM showing lack of Xbp1s following activation (24 hours) by Tg (300 nM). (D) RT-qPCR analysis of UPR and IIS genes in wild-type or CKO BMDM untreated or treated with TERS CM. Values represent the mean ± SEM (n = 3–5 per group). (E) IRE1α-XBP1 deficiency reduces CD86 and PD-L1 expression in BMDM. Ern1fl/fl, Xbp1fl/fl, Ern1-CKO, and Xbp1-CKO BMDM were treated (18 hours) with TERS CM and subsequently stained with PE-conjugated antibodies to CD86 and CD274. The MFI for both surface proteins was quantified and plotted against the MFI of the corresponding unstimulated control. Statistical significance was determined using the Mann-Whitney t test. (n = 4–5 mice per group). Data are included in S1 Data. Arg1, Arginase1; BMDM, bone marrow–derived macrophage; Chop, CCAAT-enhancer-binding protein homologous protein; CKO, conditional knock-out; Gapdh, glyceraldehyde 3-phosphate dehydrogenase; Grp78, 78-kDa glucose-regulated protein; IIS, proinflammatory/immune-suppressive; Il, interleukin; IRE1α, inositol-requiring enzyme 1; MFI, mean fluorescent intensity; PD-L1, programmed death ligand 1; PE, phycoerythrin; RQ, relative quantification; RT-qPCR, reverse transcriptase quantitative PCR; TERS CM, transmissible ER stress conditioned medium; Tg, thapsigargin; UPR, unfolded protein response; XBP1, X-box binding protein 1; Xbp1s, spliced Xbp1.
Fig 4
Fig 4. Tumor growth and tumor-infiltrating macrophage analysis in Ern1/Xbp1-CKO mice.
(A) Kaplan-Meier survival curves of Ern1fl/fl, Xbp1fl/fl, Ern1-CKO, and Xbp1-CKO mice injected in the right flank with 3x10e4 B16.ERAI cells/mouse. Tumor measurements were taken every 2 days in two dimensions. Mice were euthanized once tumors reached 20 mm in either dimension. (B) Gene expression in F4/80+ macrophages isolated from B16.F10 tumors implanted in Ern1-CKO or fl/fl mice, and respective spleen controls (n = 2 per group). mRNA was extracted enzymatically using the Zygem RNAgem Tissue PLUS kit. Gene expression was arbitrarily normalized to one spleen sample and values represent RQ fold transcript expression. Data points are expressed as means ± SEM. Data are included in S1 Data. Arg1, Arginase1; CKO, conditional knock-out; ERAI, ER stress-activated indicator; Grp78, 78-kDa glucose-regulated protein; Il, interleukin; PD-L1, programmed death ligand 1;; RQ, relative quantification; Xbp1, X-box binding protein 1; Xbp1s, spliced Xbp1.
Fig 5
Fig 5. RIDD analysis of WT and Ern1-CKO BMDM treated with TERS CM.
(A) Fold change in Cd247 (PD-L1) transcription in Ern1-deficient (left panel) and XBP1-deficient (right panel) BMDMs activated with TERS CM. (B) RNASeq analysis of Ern1 expression in untreated or TERS CM–treated WT or Ern1-CKO BMDM. TERS CM–induced fold changes are indicated in the graph. (C) Heatmap showing the relative expression of 16 RIDD target genes in untreated or TERS CM–treated WT or Ern1-CKO BMDM. (D) RNASeq analysis of Cd274 expression in untreated or TERS CM–treated WT or Ern1-CKO BMDM. TERS CM–induced fold changes are indicated in the graph. (E) Comparison of mean z scores for the 16 RIDD target genes in untreated or TERS CM–treated WT or Ern1-CKO BMDM. RNASeq data have been deposited in BioProject database (accession no. ID PRJNA622650; http://www.ncbi.nlm.nih.gov/bioproject/622650). Data are included in S1 Data. BMDM, bone marrow–derived macrophage; CKO, conditional knock-out; CM, conditioned medium; n.s., nonsignificant; PD-L1, programmed death ligand 1; RIDD, regulated IRE1α-dependent decay; RNASeq, RNA sequencing; TERS CM, transmissible ER stress CM; TPM, transcripts per million; WT, wild type; XBP1, X-box binding protein 1.
Fig 6
Fig 6. OLS linear model prediction of CD274 gene expression in human tumor-associated macrophages.
(A) An illustration of the development of aggregated pathway scores. For both pathways we used filters with different thresholds to filter out genes with less read counts to account for baseline technical artifacts. Then, we z score transformed both the gene matrix for both pathways and aggregated these scores to predict CD274 gene expression. (B) RNASeq data from tumor-associated macrophages isolated from 13 human endometrial or breast cancer samples were analyzed using 11 OLS linear models for each pathway (IRE1α or PERK). Each model was applied using different filters, each representing increasing read count thresholds. In the upper panel, each dot represents the fraction of genes remaining in the model after a given filter was applied. In the lower panel, the p-value for each pathway predicting PD-L1 gene expression is indicated at each read count threshold. Data are included in S1 Data. IRE1α, inositol-requiring enzyme 1; OLS, ordinary least squares; PD-L1, programmed death ligand 1; PERK, PKR-like ER kinase; RNASeq, RNA sequencing.

References

    1. Qian BZ, Pollard JW. Macrophage diversity enhances tumor progression and metastasis. Cell. 2010;141(1):39–51. Epub 2010/04/08. S0092-8674(10)00287-4 [pii] 10.1016/j.cell.2010.03.014 . - DOI - PMC - PubMed
    1. Tlsty TD, Coussens LM. Tumor stroma and regulation of cancer development. Annu Rev Pathol. 2006;1:119–50. Epub 2007/11/28. 10.1146/annurev.pathol.1.110304.100224 . - DOI - PubMed
    1. Sica A, Bronte V. Altered macrophage differentiation and immune dysfunction in tumor development. J Clin Invest. 2007;117(5):1155–66. Epub 2007/05/04. 10.1172/JCI31422 - DOI - PMC - PubMed
    1. Ostrand-Rosenberg S, Sinha P. Myeloid-derived suppressor cells: linking inflammation and cancer. J Immunol. 2009;182(8):4499–506. Epub 2009/04/04. 182/8/4499 [pii] 10.4049/jimmunol.0802740 - DOI - PMC - PubMed
    1. Kaneda MM, Messer KS, Ralainirina N, Li H, Leem C, Gorjestani S, et al. PI3Kgamma is a molecular switch that controls immune suppression. Nature. 2016. 10.1038/nature19834 . - DOI - PMC - PubMed

Publication types

MeSH terms