

The bird's-eye view: A data-driven approach to understanding patient journeys from claims data
- PMID: 32521006
- PMCID: PMC7647282
- DOI: 10.1093/jamia/ocaa052
The bird's-eye view: A data-driven approach to understanding patient journeys from claims data
Abstract
Objective: In preference-sensitive conditions such as back pain, there can be high levels of variability in the trajectory of patient care. We sought to develop a methodology that extracts a realistic and comprehensive understanding of the patient journey using medical and pharmaceutical insurance claims data.
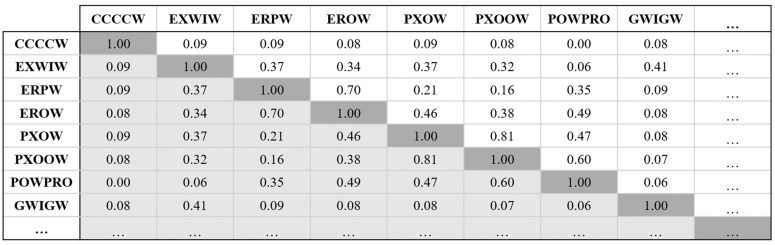
Materials and methods: We processed a sample of 10 000 patient episodes (comprised of 113 215 back pain-related claims) into strings of characters, where each letter corresponds to a distinct encounter with the healthcare system. We customized the Levenshtein edit distance algorithm to evaluate the level of similarity between each pair of episodes based on both their content (types of events) and ordering (sequence of events). We then used clustering to extract the main variations of the patient journey.
Results: The algorithm resulted in 12 comprehensive and clinically distinct patterns (clusters) of patient journeys that represent the main ways patients are diagnosed and treated for back pain. We further characterized demographic and utilization metrics for each cluster and observed clear differentiation between the clusters in terms of both clinical content and patient characteristics.
Discussion: Despite being a complex and often noisy data source, administrative claims provide a unique longitudinal overview of patient care across multiple service providers and locations. This methodology leverages claims to capture a data-driven understanding of how patients traverse the healthcare system.
Conclusions: When tailored to various conditions and patient settings, this methodology can provide accurate overviews of patient journeys and facilitate a shift toward high-quality practice patterns.
Keywords: Claims data; clustering; edit distance; patient journey; sequence alignment.
© The Author(s) 2020. Published by Oxford University Press on behalf of the American Medical Informatics Association. All rights reserved. For permissions, please email: journals.permissions@oup.com.
Figures


References
Publication types
MeSH terms
Substances
LinkOut - more resources
Full Text Sources
Medical
