. 2020 Jun 9;31(10):107737.
doi: 10.1016/j.celrep.2020.107737.

Engineered Illumination Devices for Optogenetic Control of Cellular Signaling Dynamics

Affiliations

Engineered Illumination Devices for Optogenetic Control of Cellular Signaling Dynamics

Nicole A Repina et al. Cell Rep. .

Abstract

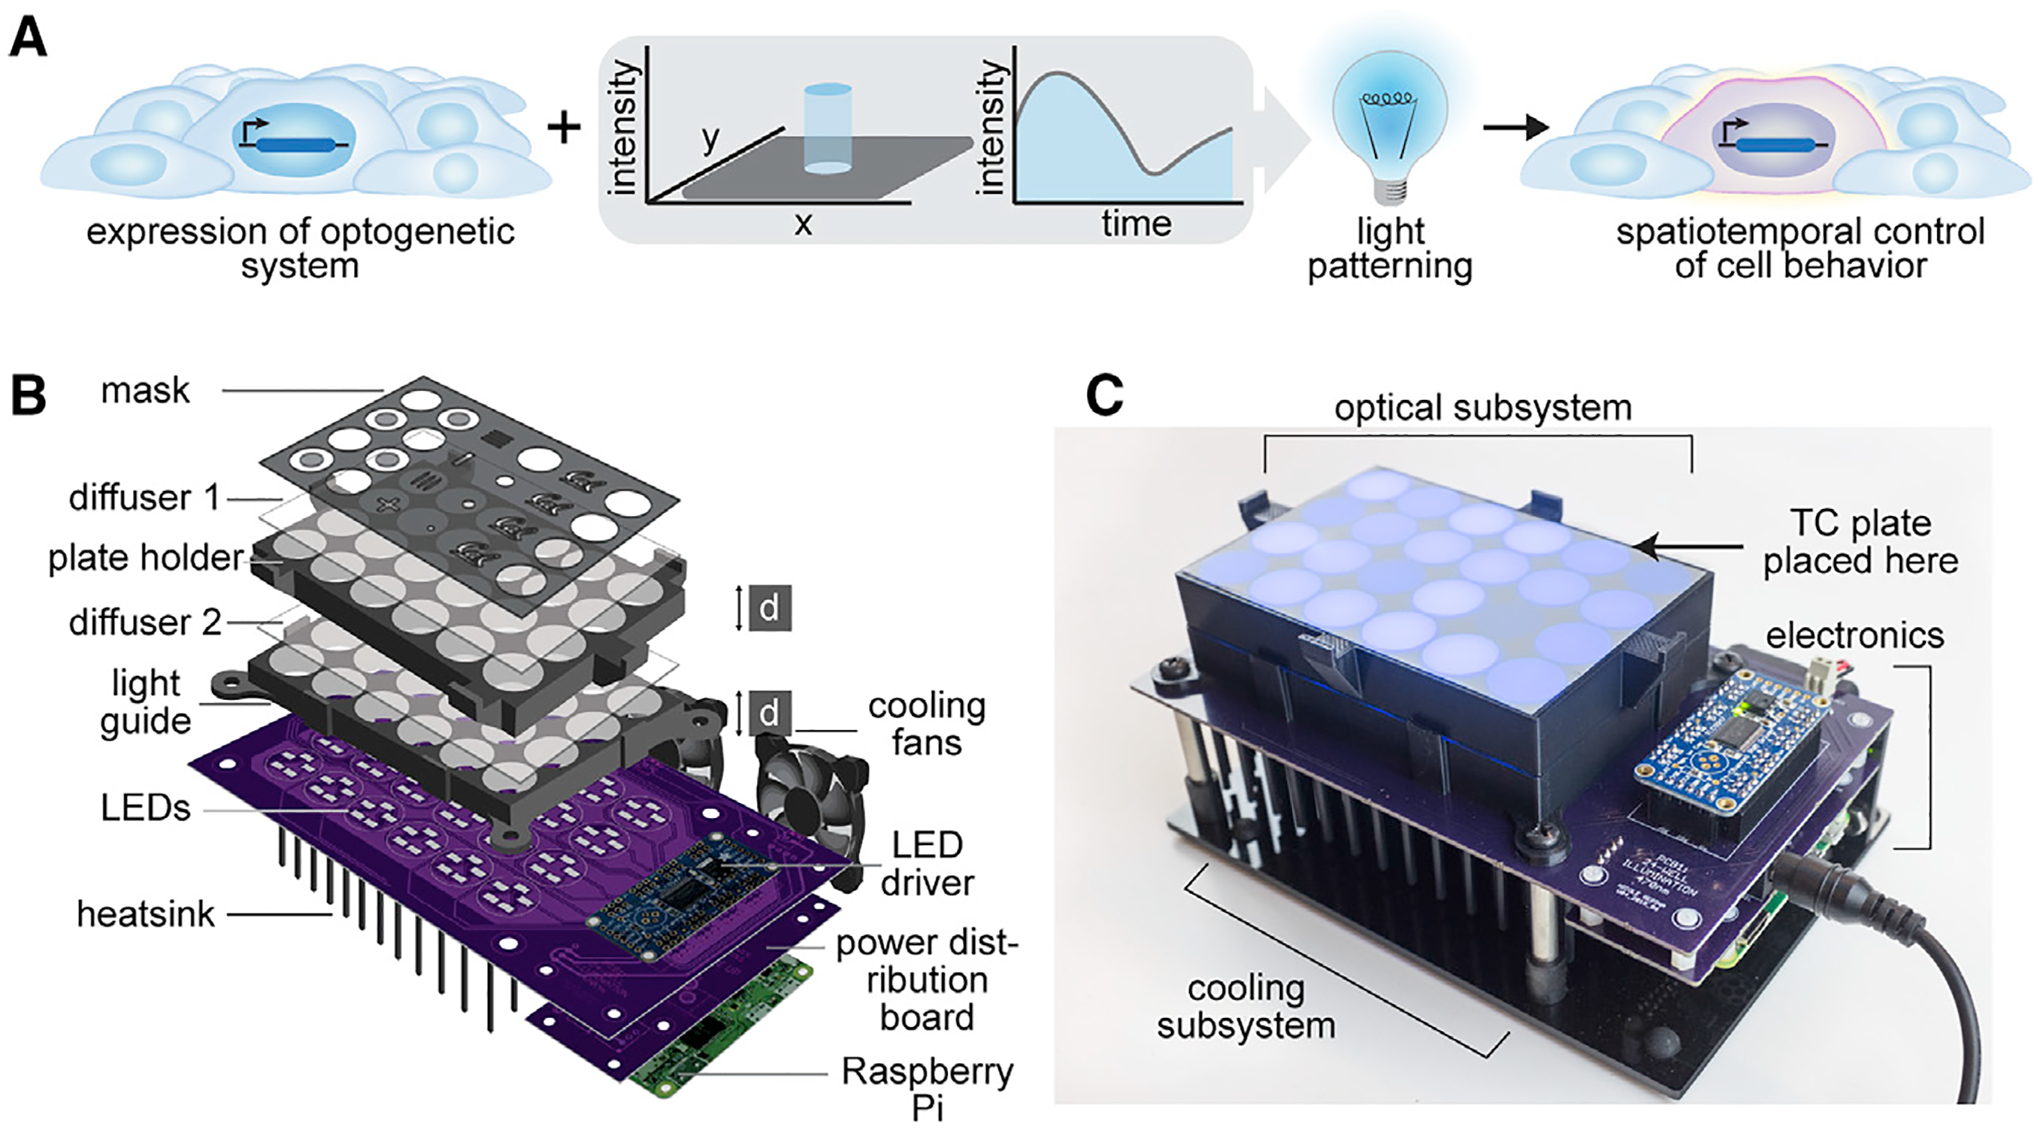
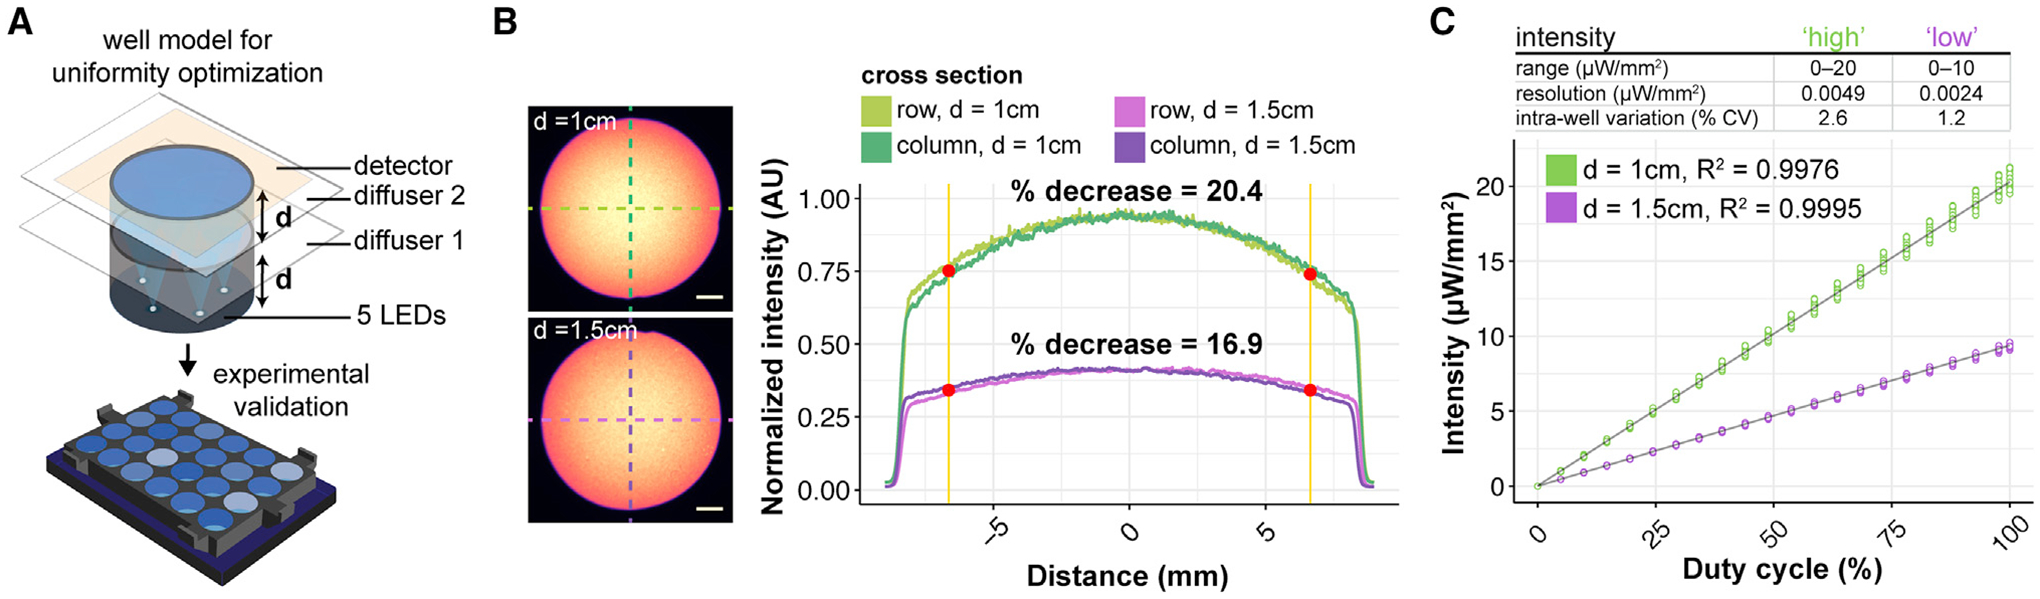
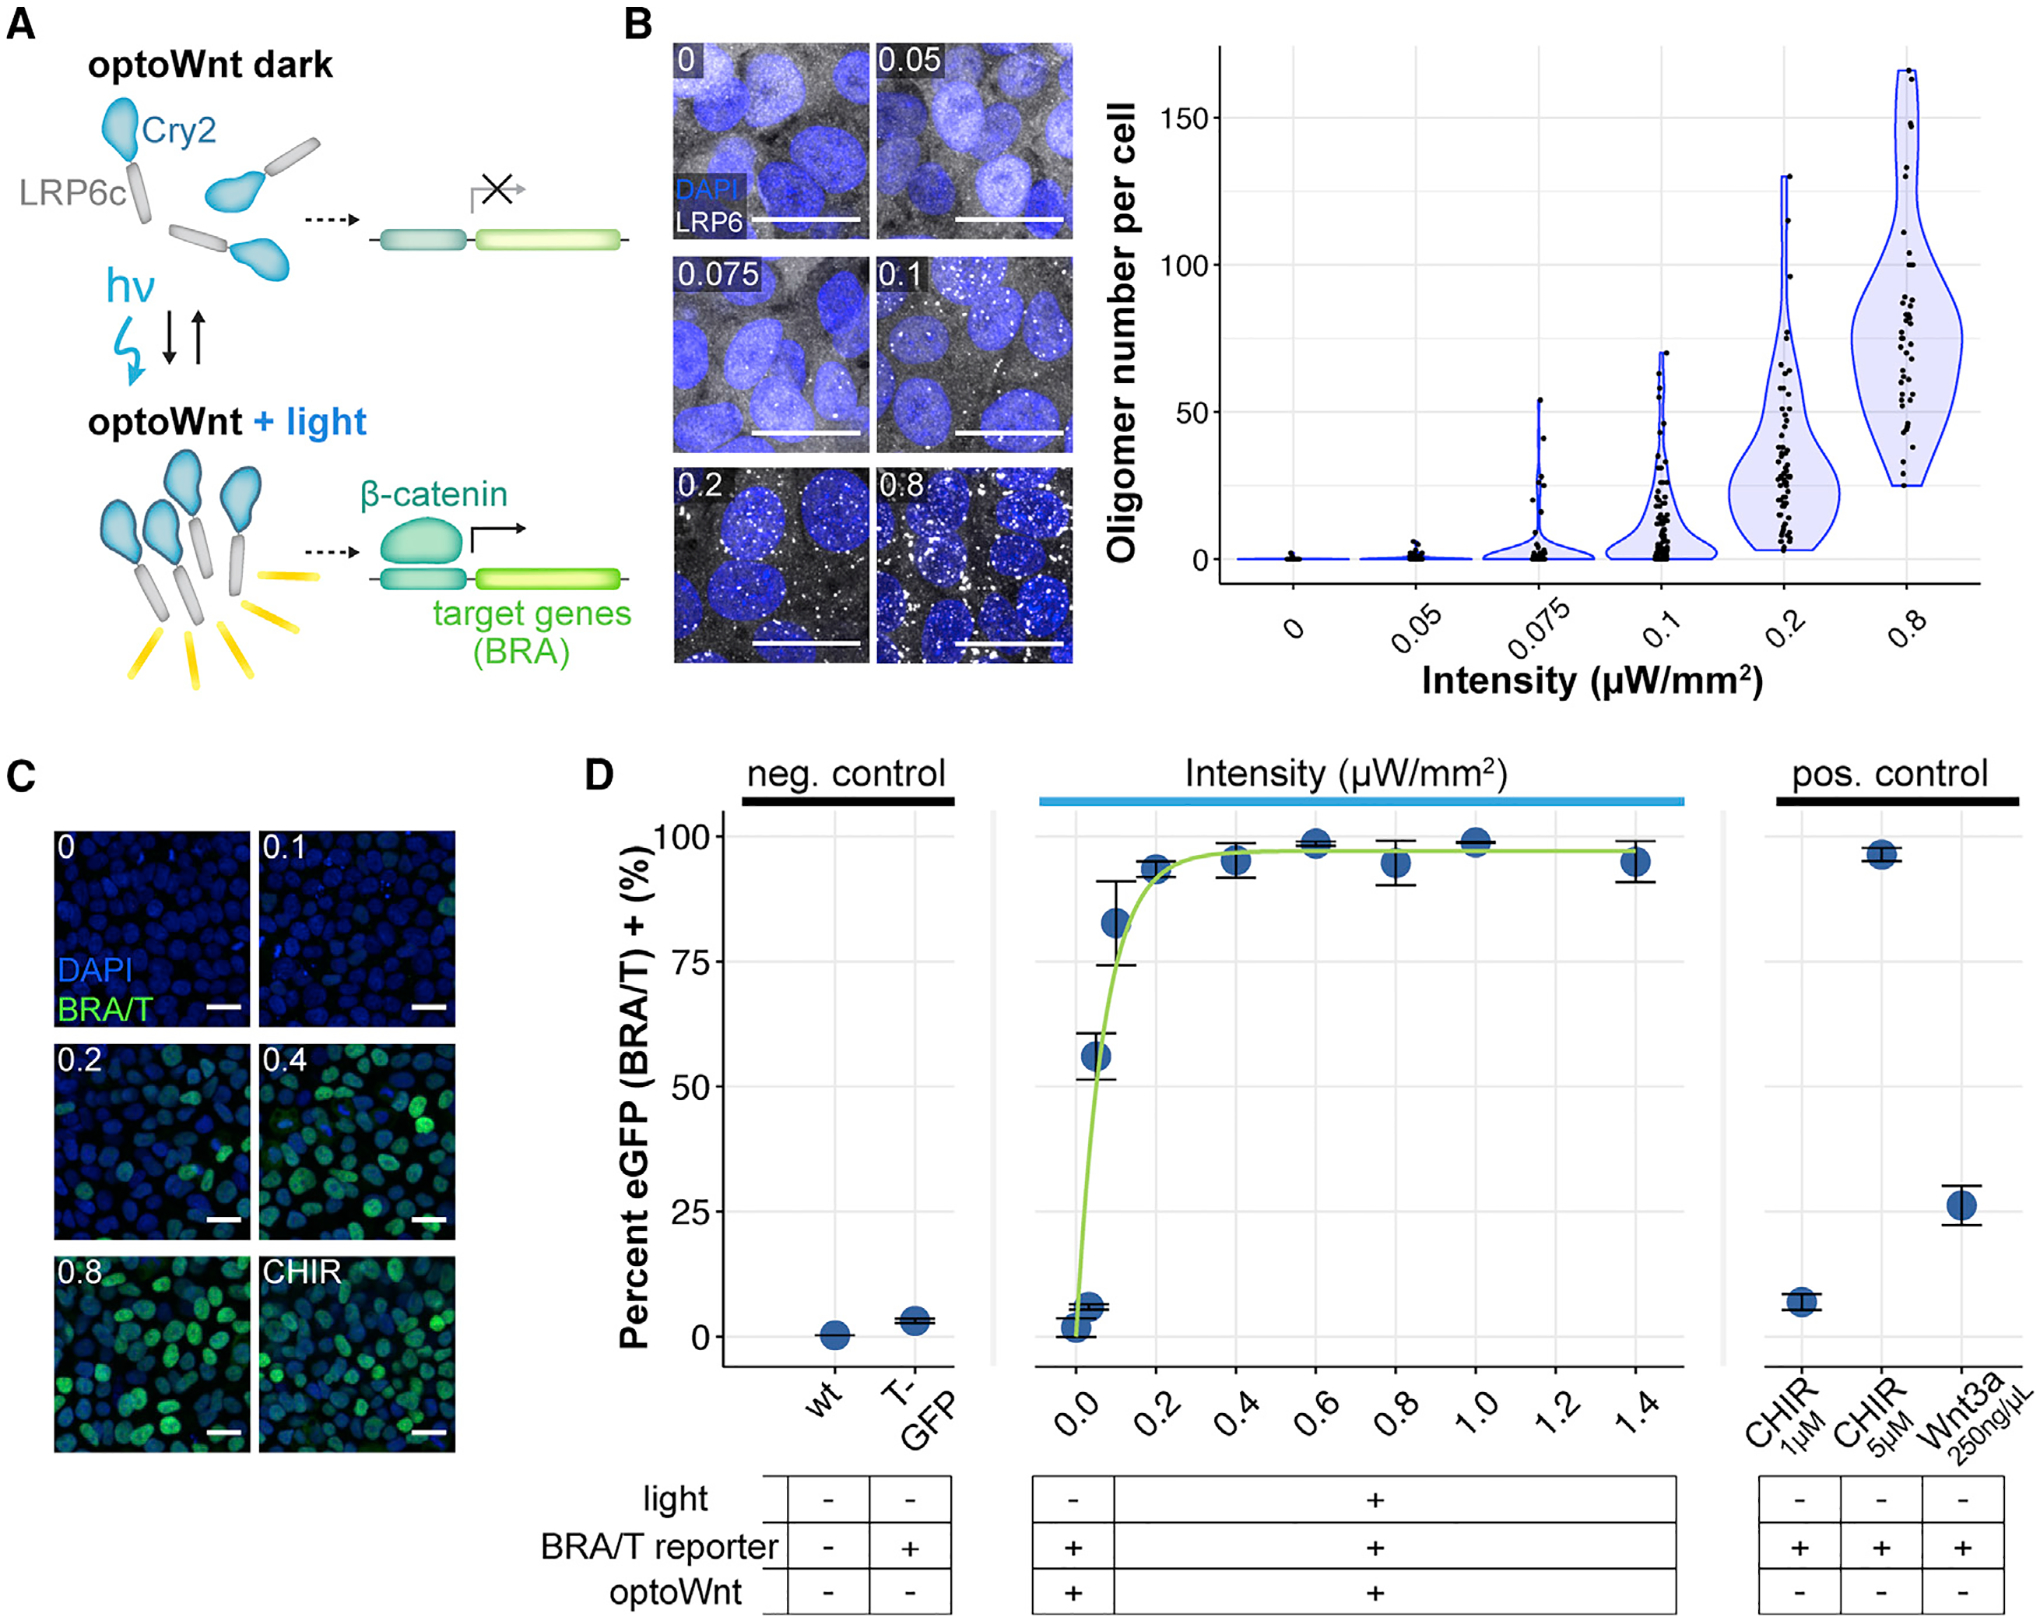
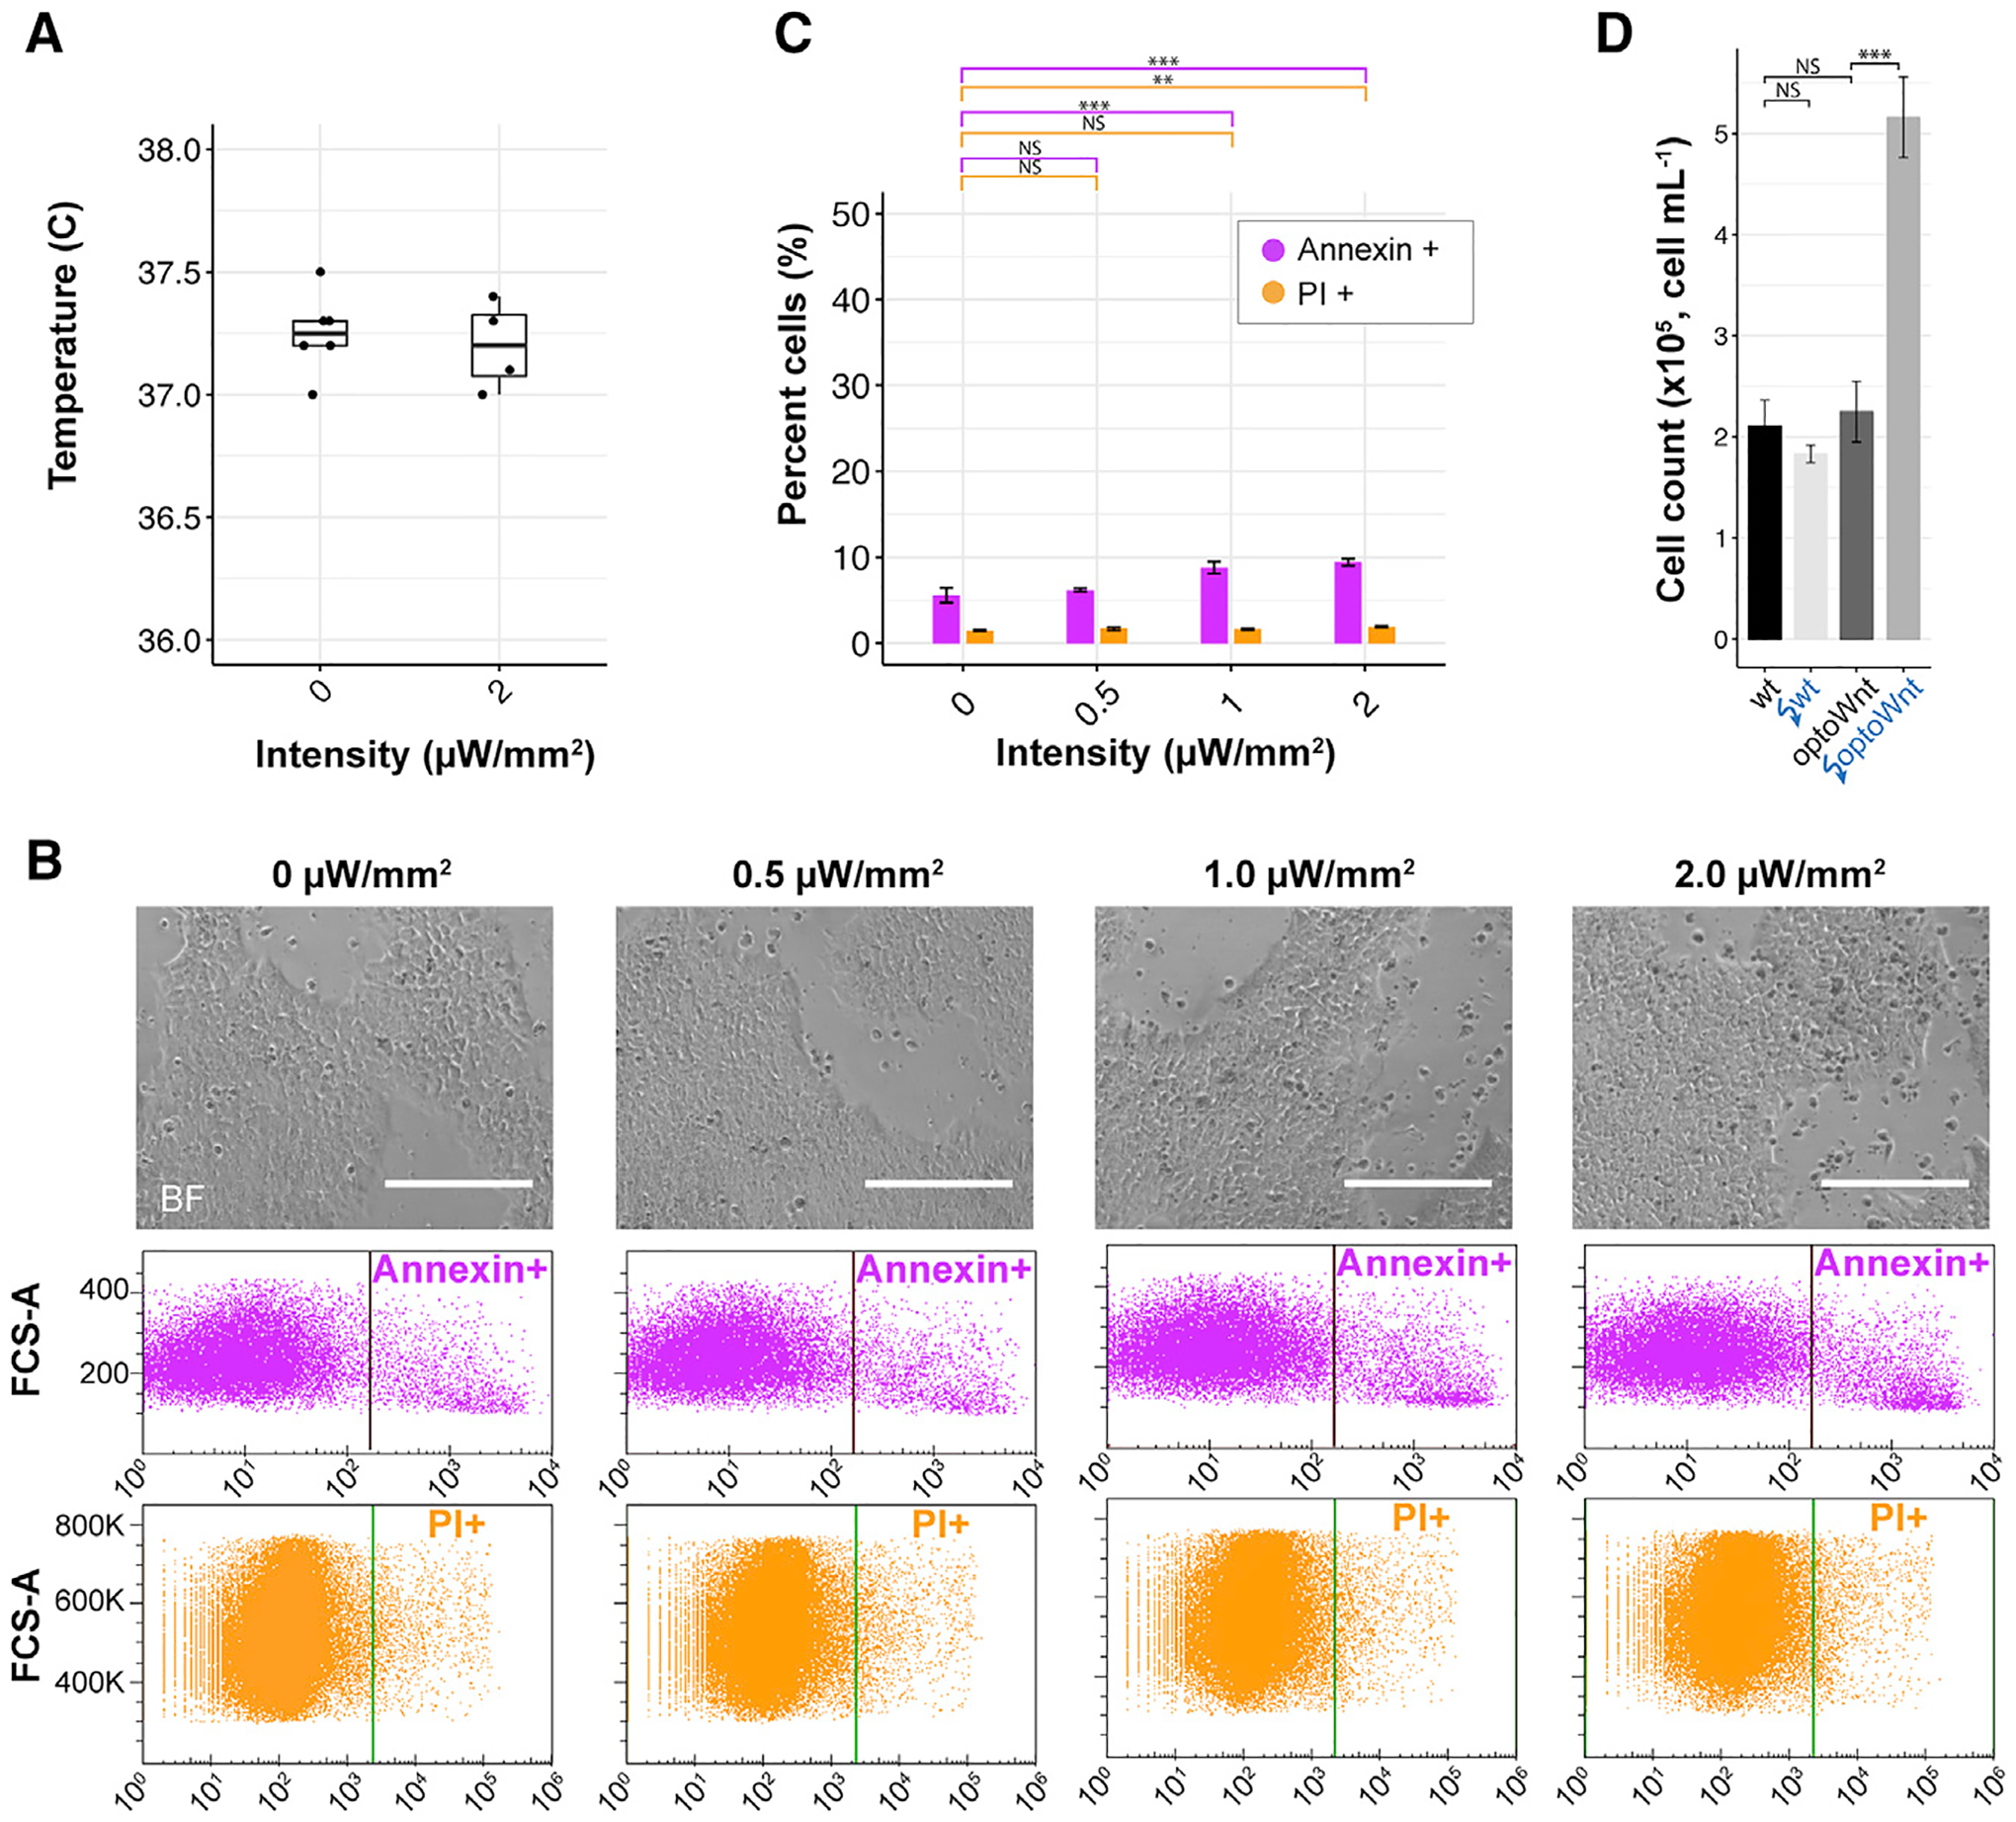
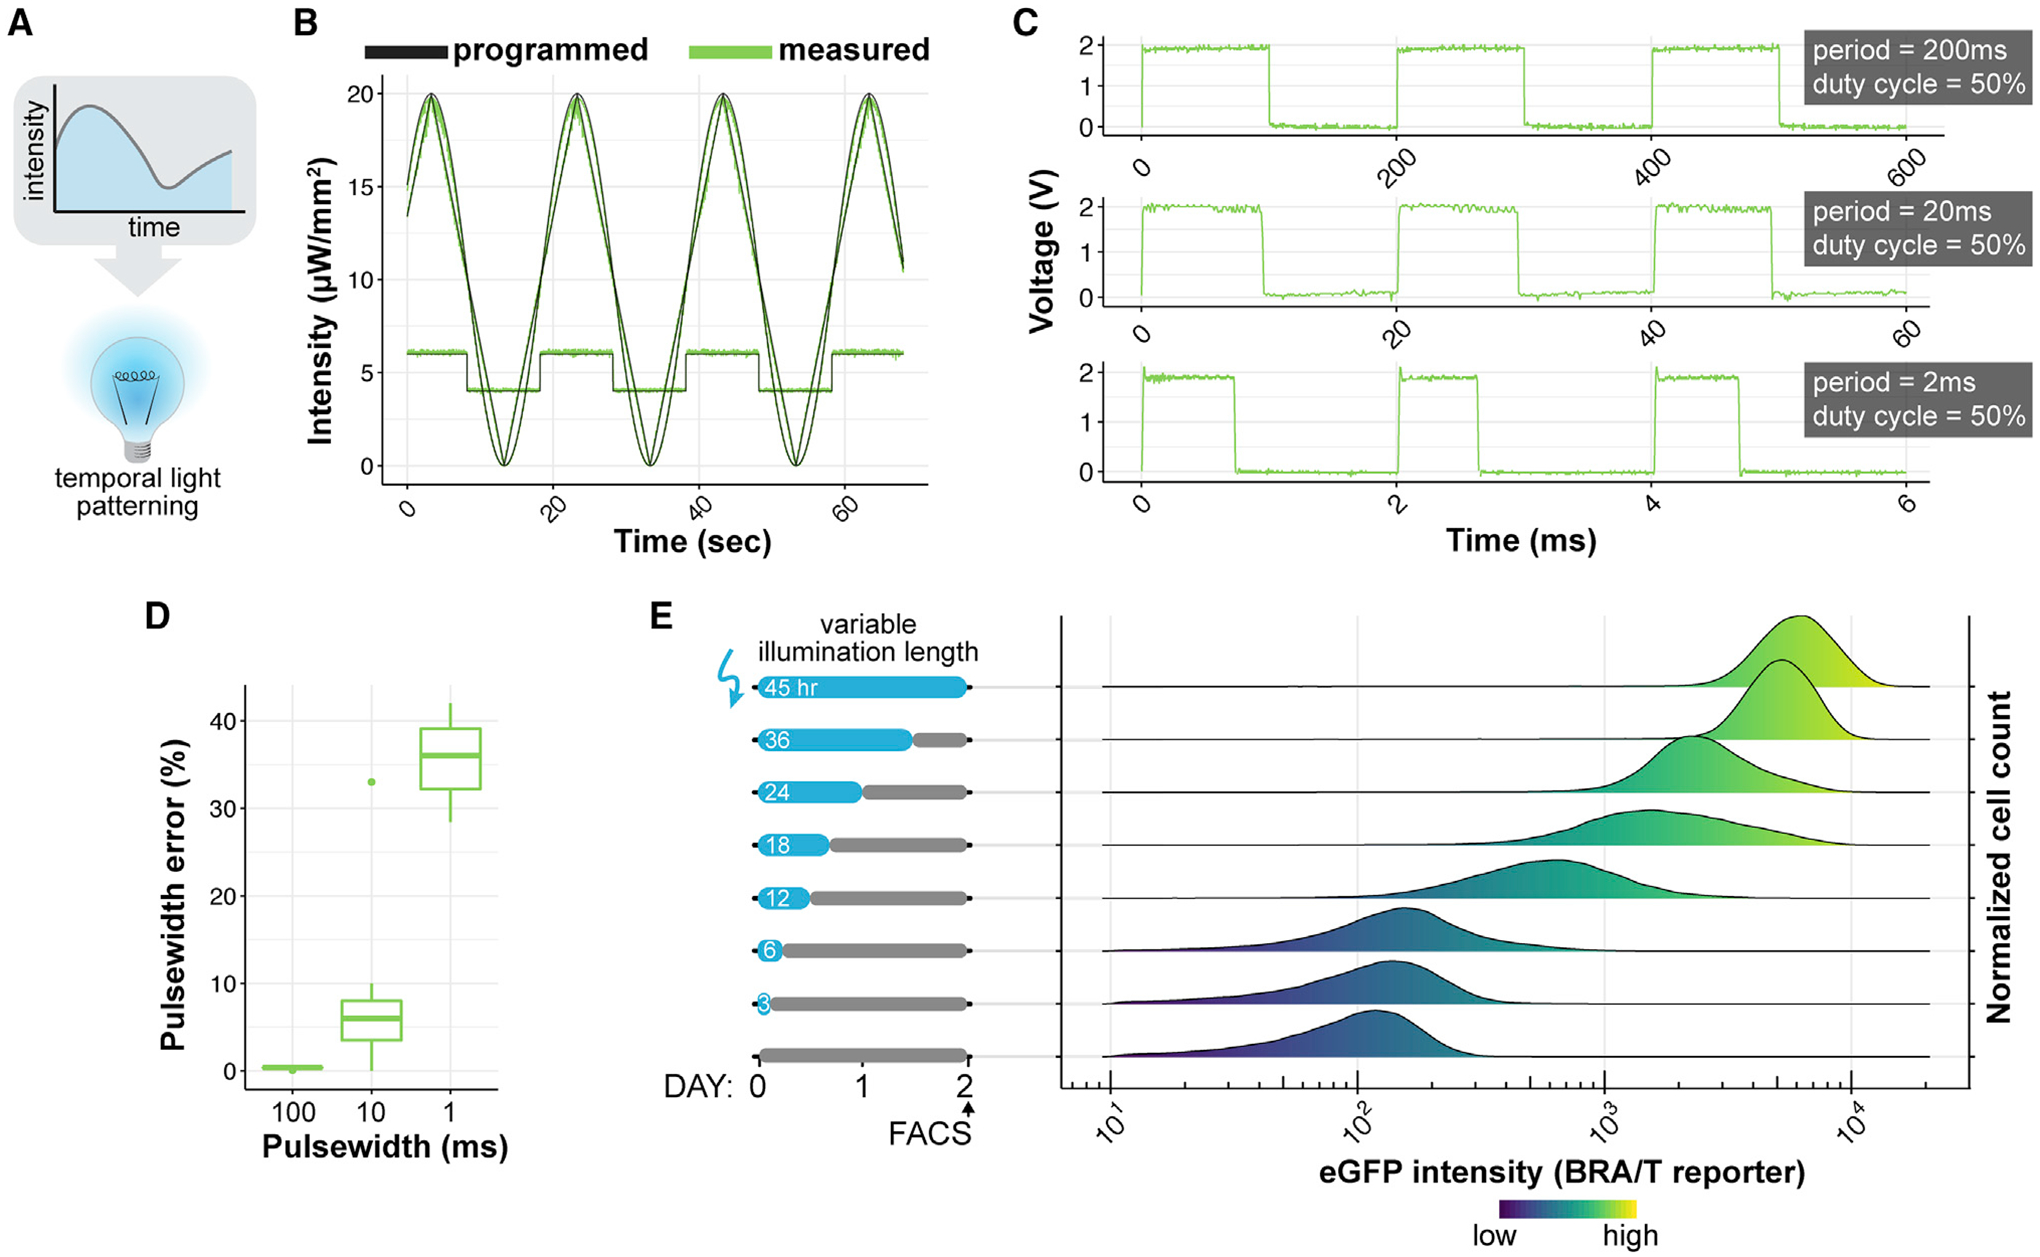
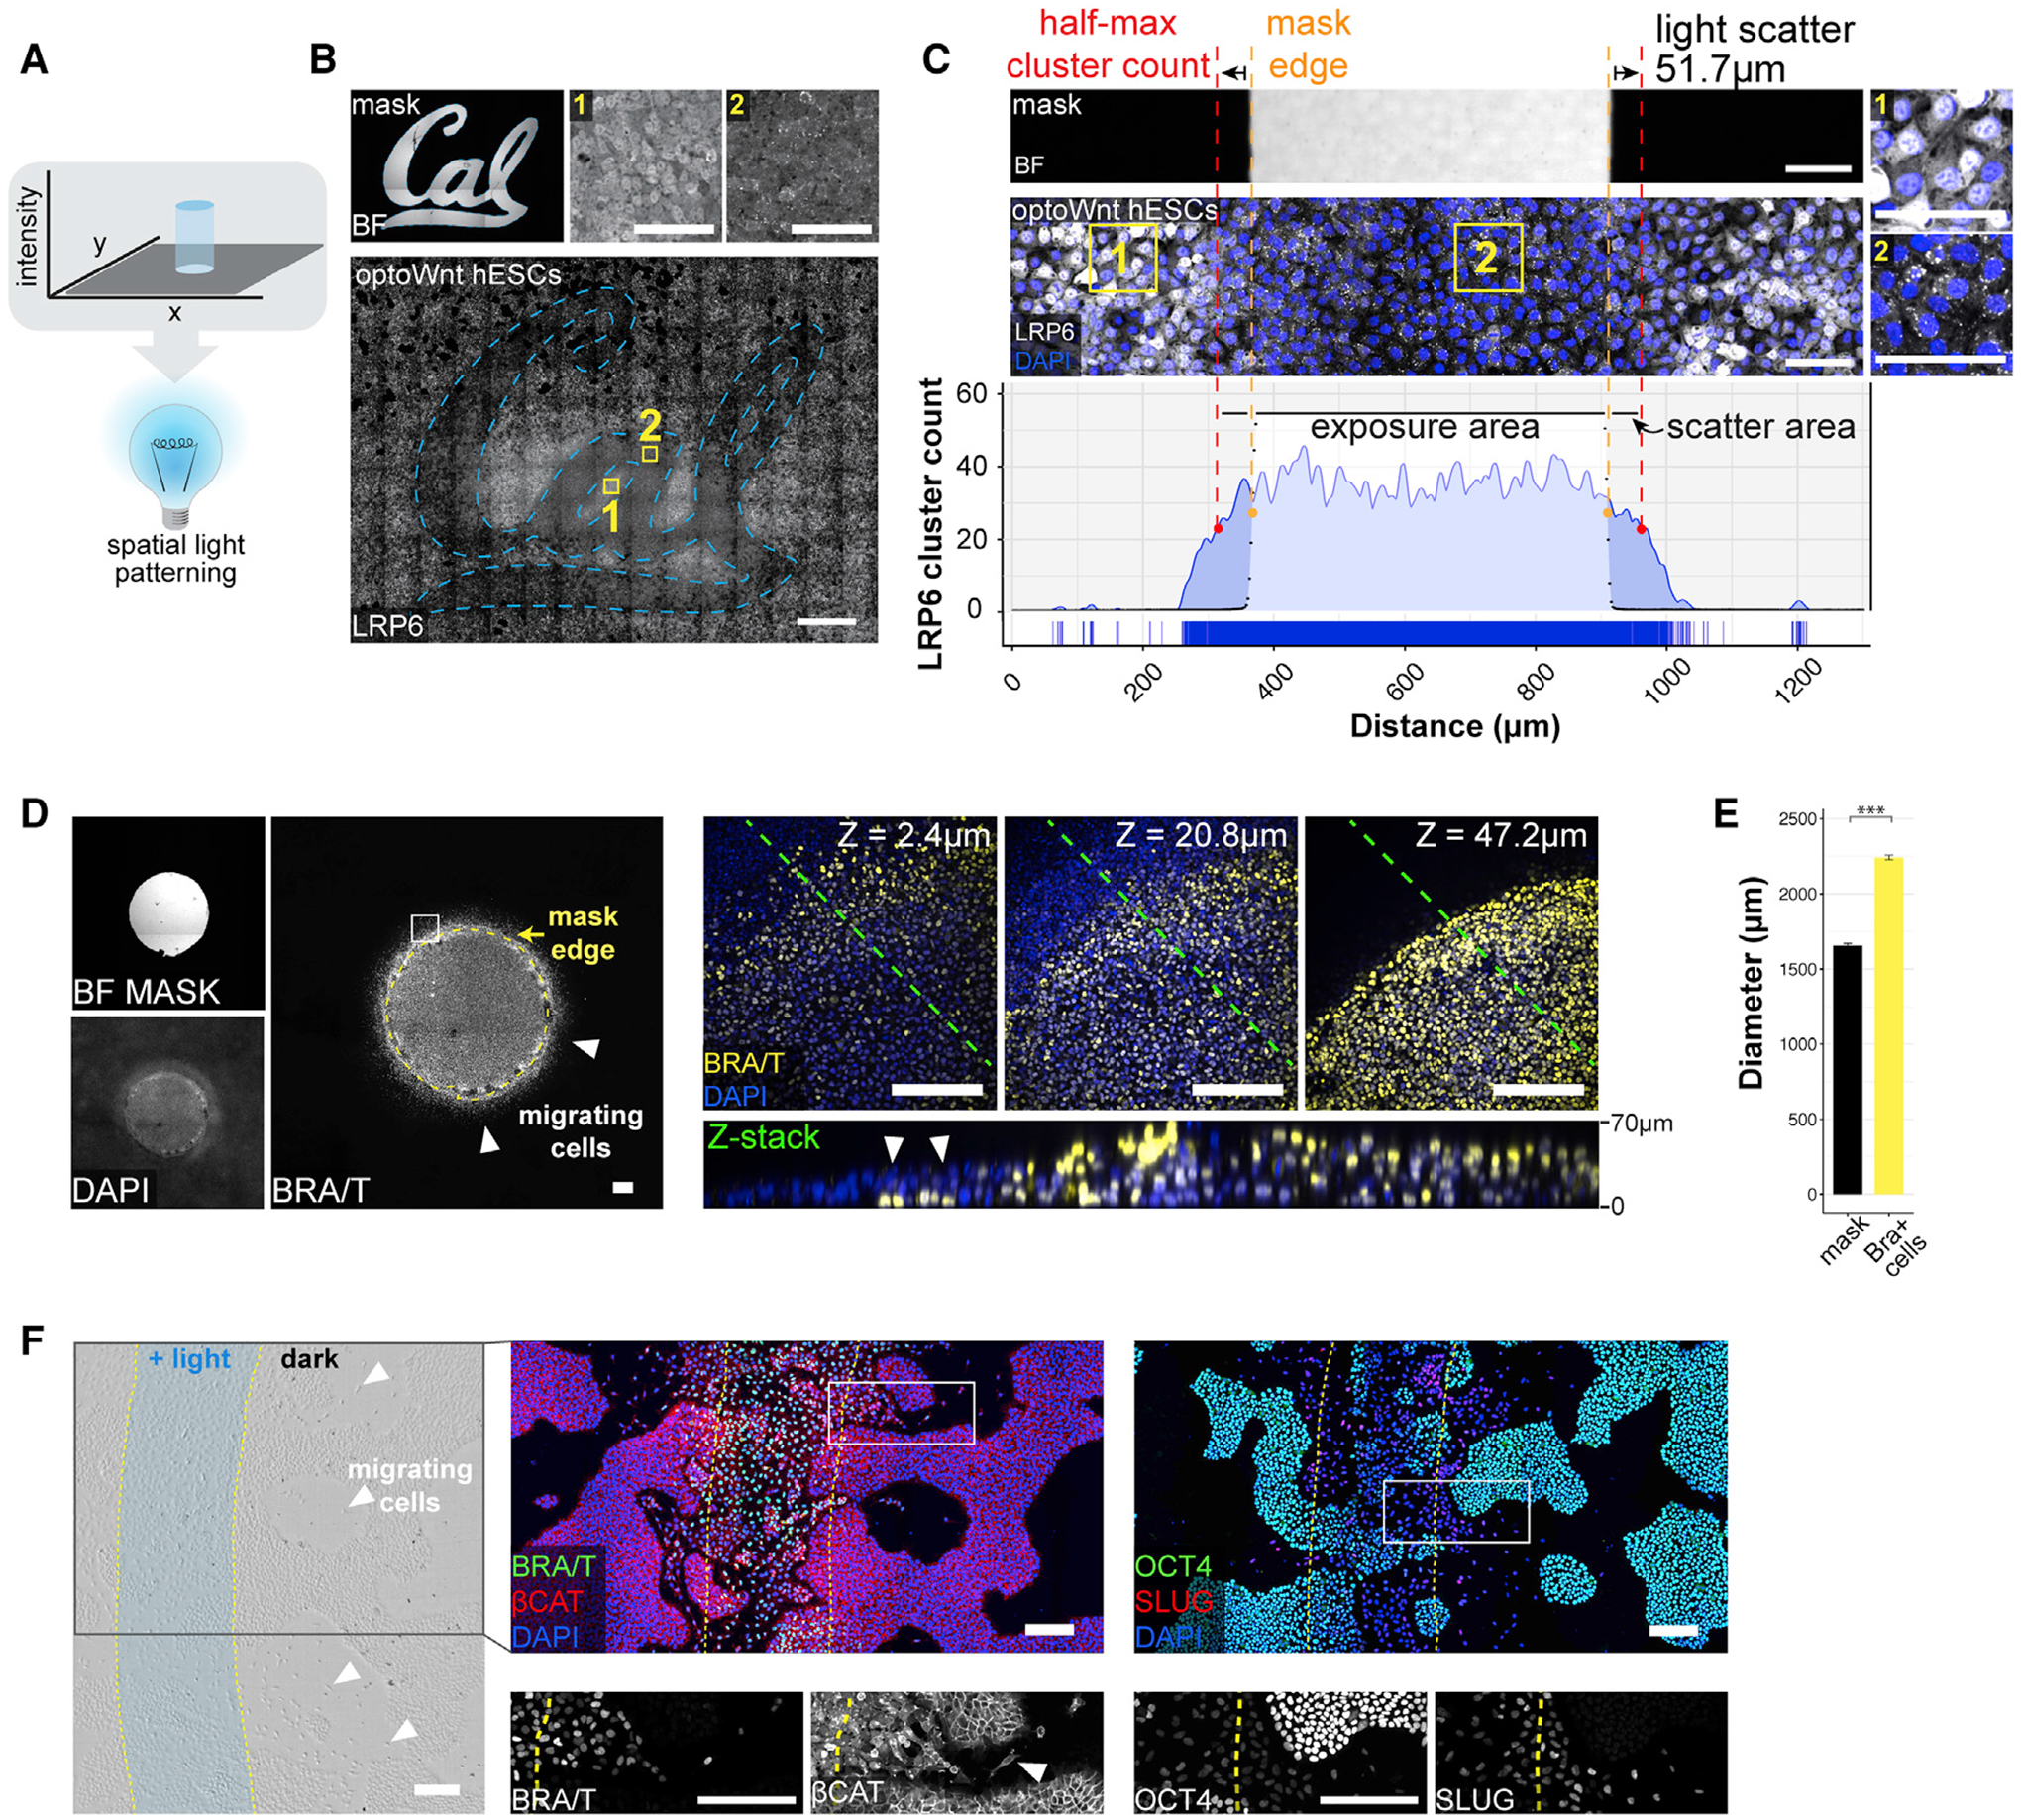
Spatially and temporally varying patterns of morphogen signals during development drive cell fate specification at the proper location and time. However, current in vitro methods typically do not allow for precise, dynamic spatiotemporal control of morphogen signaling and are thus insufficient to readily study how morphogen dynamics affect cell behavior. Here, we show that optogenetic Wnt/β-catenin pathway activation can be controlled at user-defined intensities, temporal sequences, and spatial patterns using engineered illumination devices for optogenetic photostimulation and light activation at variable amplitudes (LAVA). By patterning human embryonic stem cell (hESC) cultures with varying light intensities, LAVA devices enabled dose-responsive control of optoWnt activation and Brachyury expression. Furthermore, time-varying and spatially localized patterns of light revealed tissue patterning that models the embryonic presentation of Wnt signals in vitro. LAVA devices thus provide a low-cost, user-friendly method for high-throughput and spatiotemporal optogenetic control of cell signaling for applications in developmental and cell biology.

Keywords: canonical Wnt; cellular signaling; differentiation; electronics design; human embryonic stem cells; mesendoderm; optogenetics; spatiotemporal dynamics; tissue patterning.


Conflict of interest statement

Declaration of Interests N.A.R., T.M., and D.V.S. are co-inventors on related intellectual property.

Figures

Figure 1.
Figure 1.. Overview of Illumination Device LAVA for Optogenetic Stimulation of hESC Cultures
(A) Schematic of typical optogenetic experiment, in which spatiotemporal precision is conferred through light patterning. (B) Diagram of LAVA illumination device design. LEDs illuminate a TC plate placed on top of the device, with light passing through a series of 2 light guides, 2 optical diffusers, and a die-cut mask. LEDs are programmed through a Raspberry Pi and LED driver and are cooled with a heat sink and cooling fans. (C) Image of assembled 24-well LAVA board, with optical, cooling, and electronics subsystems highlighted. For the 96-well LAVA board, refer to Figure S1.
Figure 2.
Figure 2.. Optical Design for Illumination Uniformity of TC Plate Wells
(A) Schematic of Zemax model used for LAVA optical system optimization. (B) Bright-field images of LAVA wells (left) and graph of intensity line scans along indicated cross-sections (right) characterize the intensity uniformity of the 24-well LAVA device under 2 configurations, in which light guide thickness, d, is either (1) 1 cm (top, green) or (2) 1.5 cm (bottom, purple). The percentage of decrease is calculated between the intensity at the center of the well and the intensity at the highlighted red point, which indicates the location of the well edge of a 24-well culture plate. The graph shows mean normalized intensity over 4 independent wells. Scale bar, 2.5 mm. (C) Measured light intensity in response to the programmed duty cycle of the LED pulse-width modulation signal. The graph shows the measured intensity from each well of a 24-well LAVA device and curve fit to a linear regression model.
Figure 3.
Figure 3.. Optogenetic Induction of BRA Expression Is Light Dose Dependent
(A) Schematic of optoWnt system. In the dark, the Cry2 photosensory domain is diffuse. Illumination induces LRP6c oligomerization and the transcription of β-catenin target genes. (B) Immunostaining for LRP6 (left) and quantification of cluster number per hESC in response to increasing light intensity after 1-h illumination. The graph shows individual cell quantification, with each point representing a single cell. Scale bar, 25 μm. (C) Immunostaining for BRA in response to increasing light intensity after 24 h illumination or 3 μM CHIR treatment. Scale bar, 25 μm. (D) Flow cytometry of optoWnt hESCs expressing EGFP reporter for BRA/T treated with varying light intensities or with Wnt pathway agonists (Wnt3a recombinant protein or CHIR). The graph shows the percentage of EGFP+ cells and nonlinear least-squares fit to increasing exponential decay curve. A subset of the data is reproduced from Repina et al. (2019). Graph shows means ± 1 SDs, n = 3 biological replicates.
Figure 4.
Figure 4.. Low Phototoxicity during Continuous Optogenetic Stimulation of hESC Cultures
(A) Temperature of media after 24 h of continuous illumination at indicated light intensities. Each point represents the measurement from a single well. (B) Bright-field images (top) of live wild-type hESC cultures illuminated at indicated light intensities after 48 h. Flow cytometry results (bottom) for Annexin V and propidium iodide (PI) stain of hESCs following 48 h of illumination. Positive gating indicated by vertical line. Scale bar, 250 μm. (C) Quantification of Annexin V and PI shows a significant increase in apoptosis and cell death >1 μW/mm2 illumination intensity (pA = 0.0008, pPI = 0.39 at 0 versus 1 μW/mm2; pA = 0.0002, pPI = 0.009 at 0 versus 2 μW/mm2). No difference was observed between 0 and 0.5 μW/mm2 (pA = 0.61, pPI = 0.18). ANOVA followed by Tukey test. The graph shows means ± 1 SDs, n = 3 biological replicates. (D) Endpoint cell count of wild-type and optoWnt hESCs after 48 h of continuous illumination at 0 or 0.8 μW/mm2. The graph shows means ± 1 SDs, n = 3 replicates. ANOVA followed by Tukey test.
Figure 5.
Figure 5.. Characterization of Temporal Control Using LAVA Devices
(A) Schematic of temporal light patterning in optogenetics. (B) LAVA board well intensity as a function of time of various waveforms programmed through LAVA GUI. Programmed values shown in black and measured intensities shown in green. (C) Measured illumination intensity during programmed blink sequences shows signal integrity at various frequencies. The voltage signal is directly measured from the optical power meter output with an oscilloscope and is proportional to illumination intensity. Blinking sequences were programmed through the LAVA GUI at a 50% duty cycle and at indicated pulse width on times. (D) Percentage error in measured pulse width relative to programmed pulse width for blinking sequences shown in (C). (E) OptoWnt hESCs containing an EGFP reporter for endogenous BRA/T activity were illuminated for varying lengths of time and analyzed by flow cytometry at a fixed endpoint. The graph shows histograms of EGFP expression at each illumination condition. Cell count histograms are normalized to total cells per condition (~30,000 cells), n = 3 biological replicates.
Figure 6.
Figure 6.. Spatial Light Patterning with LAVA Devices for Localized OptoWnt Activation
(A) Schematic of spatial light patterning in optogenetic experiments. (B) Stitched bright-field and fluorescence confocal images of optoWnt hESCs illuminated with University of California, Berkeley (Cal) logo photomask. Immunostaining for LRP6 oligomers, with representative image of masked region (1) and illuminated region (2), as shown. Scale bar, 100 μm (top) and 1 mm (bottom). (C) Quantification of light scattering through the bottom of a TC plate shows a ~50-μm spread (full width at half-maximal, red line) of optoWnt oligomers beyond photomask edge (orange line). Bright-field image of a photomask (top), fluorescence image of immunostaining for LRP6 (center), and quantification of LRP6 cluster count (bottom). Insets (1) and (2) show masked and illuminated regions, respectively. Scale bars, 100 μm. (D) Patterned illumination with a 1.5-mm diameter circle of light. BRA immunostaining with photomask overlay shown in the left panel. Confocal z stacks of bottom (closest to coverslip, z = 2.4 μm), center (z = 20.8 μm), and top (z = 47.2 μm) cell layers show BRA+ cells localized beyond the photomask boundary and under the epithelial cell layer (white arrows). The bottom panel shows z slice through the cross-section highlighted with a green line. Scale bars, 100 μm. (E) Quantification of BRA+ cell localization beyond the photomask edge. The mean diameter of the circular photomask pattern was quantified using the bright-field image channel, and the mean diameter of the BRA+ cell pattern was quantified through immunostaining, as shown in (D). The graph shows mean measured diameters ± 1 SDs, n = 3 biological replicates. Student’s t test (2-tailed). Scale bars, 200 μm. (F) Patterned illumination with stripe of light, 500 μm in width. Bright-field image (left panel) with overlay of light pattern shows cells with mesenchymal morphology localized beyond the region of illumination (white arrows). Immunostaining for BRA and β-CAT (center panel), and OCT4 and SLUG (right panel). Overlay of light pattern is highlighted in yellow, and magnification (white box) shown below. Scale bars, 200 μm.

References

    1. Acker L, Pino EN, Boyden ES, and Desimone R (2016). FEF inactivation with improved optogenetic methods. Proc. Natl. Acad. Sci. USA 113, E7297–E7306. - PMC - PubMed
    1. Allen BD, Singer AC, and Boyden ES (2015). Principles of designing interpretable optogenetic behavior experiments. Learn. Mem 22, 232–238. - PMC - PubMed
    1. Arnold SJ, and Robertson EJ (2009). Making a commitment: cell lineage allocation and axis patterning in the early mouse embryo. Nat. Rev. Mol. Cell Biol 10, 91–103. - PubMed
    1. Arnold SJ, Stappert J, Bauer A, Kispert A, Herrmann BG, and Kemler R (2000). Brachyury is a target gene of the Wnt/β-catenin signaling pathway. Mech. Dev 91, 249–258. - PubMed
    1. Aulehla A, Wehrle C, Brand-Saberi B, Kemler R, Gossler A, Kanzler B, and Herrmann BG (2003). Wnt3a plays a major role in the segmentation clock controlling somitogenesis. Dev. Cell 4, 395–406. - PubMed

Publication types