. 2020 Jun 9;31(10):107748.
doi: 10.1016/j.celrep.2020.107748.

Chromatin Priming Renders T Cell Tolerance-Associated Genes Sensitive to Activation below the Signaling Threshold for Immune Response Genes

Affiliations

Chromatin Priming Renders T Cell Tolerance-Associated Genes Sensitive to Activation below the Signaling Threshold for Immune Response Genes

Sarah L Bevington et al. Cell Rep. .

Abstract

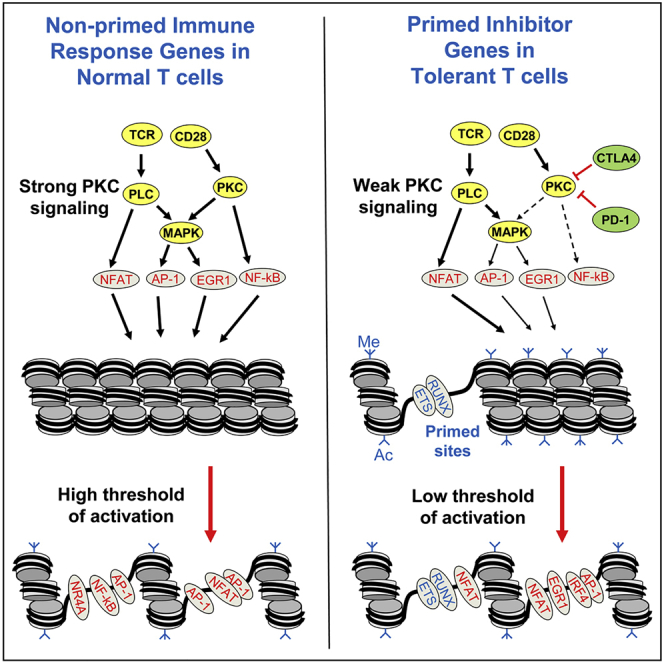
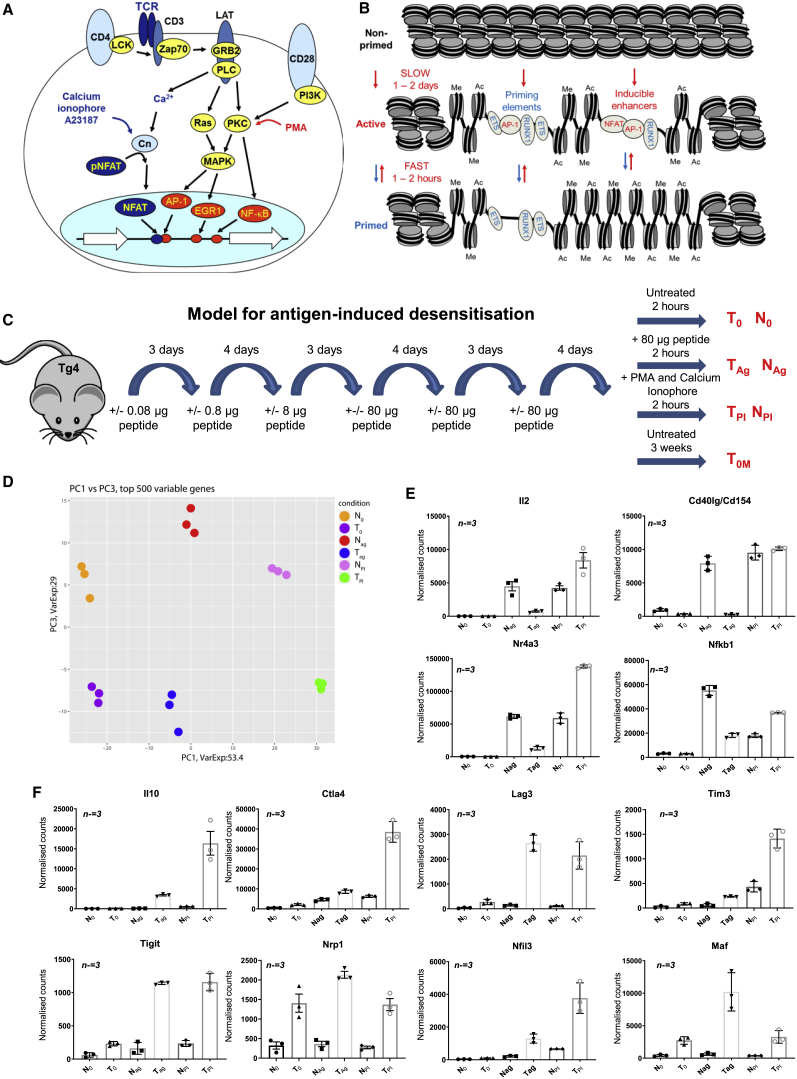
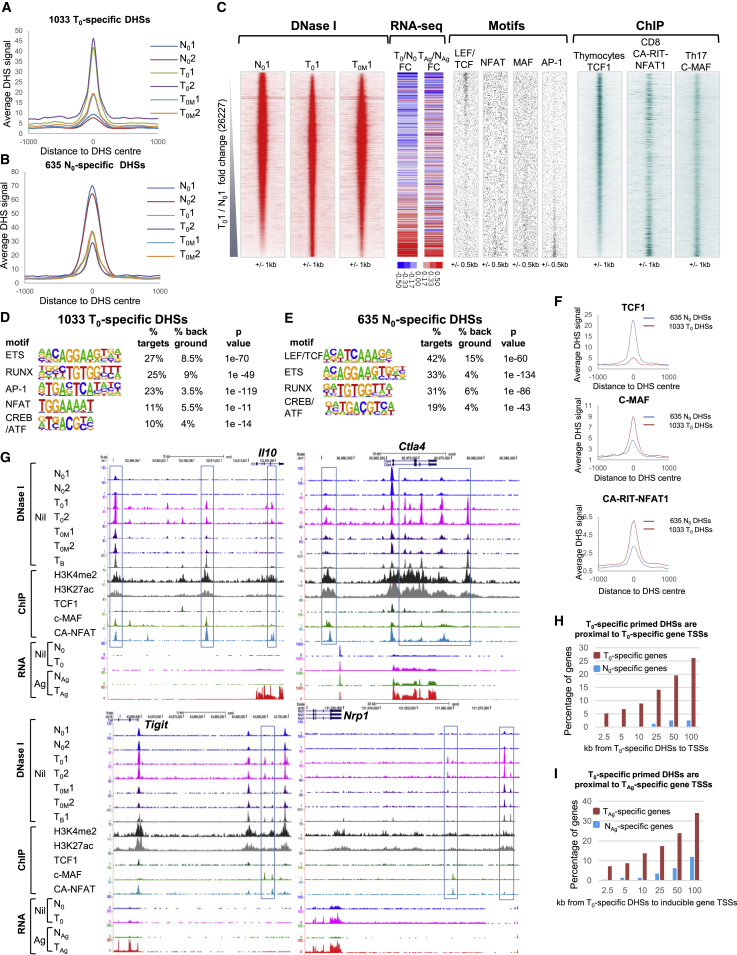
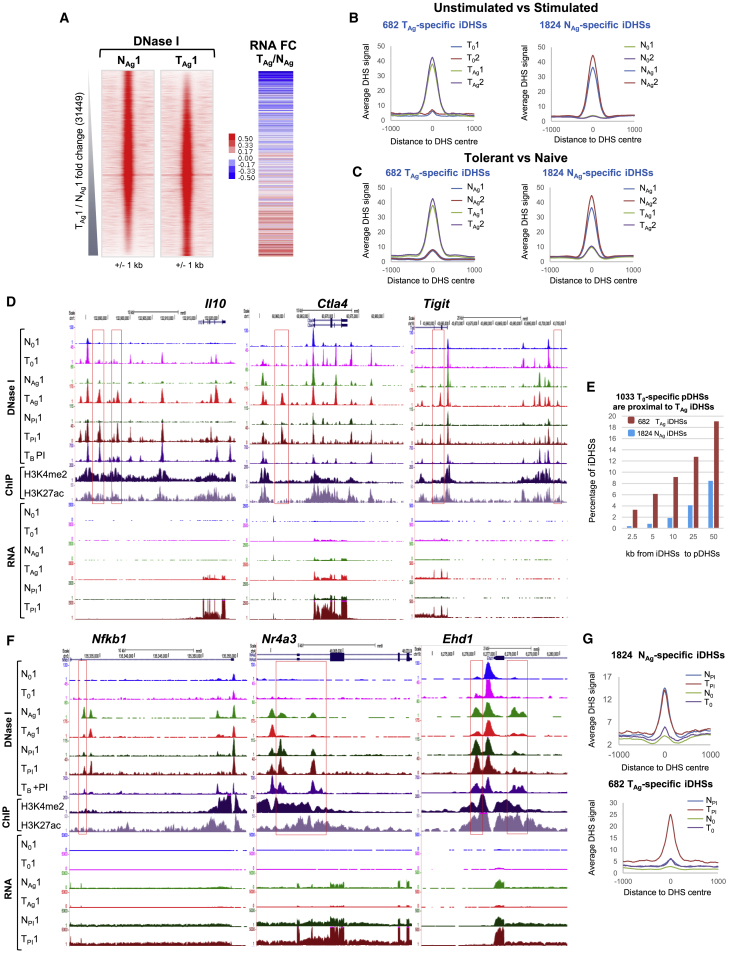
Immunological homeostasis in T cells is maintained by a tightly regulated signaling and transcriptional network. Full engagement of effector T cells occurs only when signaling exceeds a critical threshold that enables induction of immune response genes carrying an epigenetic memory of prior activation. Here we investigate the underlying mechanisms causing the suppression of normal immune responses when T cells are rendered anergic by tolerance induction. By performing an integrated analysis of signaling, epigenetic modifications, and gene expression, we demonstrate that immunological tolerance is established when both signaling to and chromatin priming of immune response genes are weakened. In parallel, chromatin priming of immune-repressive genes becomes boosted, rendering them sensitive to low levels of signaling below the threshold needed to activate immune response genes. Our study reveals how repeated exposure to antigens causes an altered epigenetic state leading to T cell anergy and tolerance, representing a basis for treating auto-immune diseases.

Keywords: CTLA4; Cbl-b; IL-10; T cell; chromatin; epigenetic; gene regulation; signaling; tolerance; transcription factor.


Conflict of interest statement

Declaration of Interests The authors declare no competing interests.

Figures

None
Graphical abstract
Figure 1
Figure 1
Gene Expression Analyses Comparing Tolerized T Cells with Naive T Cells (A) Model of the activation of immune response genes by TCR and CD28 signaling to inducible TFs. Calcium ionophore A23187 and PMA act on the same signaling pathways downstream of PLC. (B) The transcription factors activated by signaling (NFAT, AP-1) induce chromatin remodeling at immune response genes at both priming elements and inducible enhancers. Enhancer activation initiates transcription of their target genes. When signaling ceases, primed DHSs are stably maintained as regions of methylated (me) and acetylated (ac) chromatin by the retention of constitutively expressed transcription factors (ETS, RUNX). (C) Schematic showing the dose escalation protocol used in tolerizing Tg4 mice by subcutaneous injections with MBP Ac1-9-specific TCR. (D) Principle-component analysis of the RNA-seq datasets for the top 500 most variable genes for N0, T0, NAg, TAg, NPI, and TPI. RNA-seq data were taken from three biological replicates. (E and F) Normalized average RNA-seq counts for classical immune response (E) and immune-modulatory genes (F). Error bars represent the standard deviation from three biological replicates.
Figure 2
Figure 2
DNase-Seq Analyses of Open Chromatin in Naive and Tolerized T Cells (A and B) Average DHS signal at the 1,033 T0-specific DHSs (A) and at the 635 N0-enriched DHSs (B) in the replicate N0, T0, and T0M samples. (C) DNase-seq sequence tag density plots showing all 26,227 peaks detected in replicate 1 of T0 and N0 ordered by increasing fold change (FC) of sequence tag count for T0 compared with N0. Alongside is the FC in mRNA level for the closest gene to the DHSs as ranked in the density plots. The FC is shown between T0 and N0 (left), and TAg is compared with NAg (right). The locations of TF consensus binding motifs within the same DHSs are shown alongside for AP-1, NFAT, MAF, and LEF family proteins. Plotted alongside are published TF binding data from ChIP-seq analyses for TCF1 in thymocytes (Dose et al., 2014), c-MAF in Th17 cells (Ciofani et al., 2012), and ectopic CA-RIT-NFAT1 in CD8 T cells (Martinez et al., 2015). (D and E) HOMER de novo identification of TF motifs enriched in the 1,033 T0-specific DHSs (D) and the 635 N0-specific DHSs (E). (F) Average ChIP signal at the 1,033 T0-specific DHSs and 635 N0-specific DHSs for TCF1, c-MAF, and CA-RIT-NFAT1. (G) UCSC Genome Browser tracks showing DNase-seq data from replicate samples of non-stimulated naive cells (N0), non-stimulated tolerant cells (T0), and tolerant cells 3 weeks after the final dose of peptide (T0M), plus published DNase-seq data for CD4 T blast (TB) cells (Bevington et al., 2016). Published ChIP-seq data are shown for the TFs TCF1, c-MAF, and CA-RIT-NFAT1 and the histone modifications H3K27ac and H3K4me2 in TB cells. Representative RNA-seq data from one of three replicates are also shown for resting and in vivo peptide-stimulated naive and tolerant cells (0 and Ag). (H and I) Bar graphs showing the percentage and proximity of genes that are preferentially induced in T0 or N0 (H) and TAg or NAg (I), which are found within 100 kb of the 1,033 T0-specific DHSs.
Figure 3
Figure 3
DNase-Seq Analyses of In Vivo-Activated Naive and Tolerized T Cells (A) DNase-seq tag density plots showing all peaks detected in replicate 1 of NAg and TAg ranked according to FC of sequence tag count for TAg compared with NAg. Alongside is the FC in mRNA level for the closest gene to the DHSs for TAg compared with NAg. (B and C) Average DHS signal at the 682 TAg-specific iDHSs (left) and at the 1,824 NAg-specific iDHSs (right) for 0 compared with Ag (B) and NAg compared with TAg (C). (D) UCSC genome browser tracks showing DNase-seq and RNA-seq data from resting cells (N0 and T0), antigen-stimulated cells (NAg and TAg), and PI-stimulated cells (NPI and TPI). DNase-seq, H3K27ac ChIP, and H3K4me2 ChIP tracks are shown for CD4 TB PI. (E) Bar graph showing the percentage of iDHSs that are preferentially induced in TAg or NAg that are found within 50 kb of the 1,033 tDHSs. (F) UCSC genome browser tracks as for (D). (G) Average DNase-seq signal for the 1,824 NAg-specific iDHSs and the 682 TAg-specific iDHSs in non-stimulated (N0 and T0) and PI-treated (NPI and TPI) cells.
Figure 4
Figure 4
Analyses of TF Interactions with DHSs in Naive and Tolerized T Cells (A and B) Homer de novo identification of enriched TF motifs in the 1,824 NAg-specific iDHSs (A) and the 682 TAg-specific iDHSs (B). (C) Locations of transcription factor binding motifs (middle) at all DNase I peaks in the Ag-stimulated samples ordered according to the FC in sequence tag density for TAg compared with NAg (left). Aligned on the same axis are published ChIP-seq data for JunB in TB cells (Bevington et al., 2016), IRF4, BATF in CD4 T cells (Li et al., 2012) and constitutively active CA-RIT-NFAT and endogenous PI-induced NFAT in CD8 T cells (Martinez et al., 2015) (right). (D) Venn diagrams depicting the overlaps between the published data for 4,4441 peaks detected in ChIP assays for CA-RIT-NFAT1 and/or endogenous (WT) NFAT1 in PI-stimulated T cells (Martinez et al., 2015) with the 682 TAg-specific iDHSs (upper) or 1,824 NAg-specific iDHSs (lower). (E) Average ChIP-seq signal for WT NFAT1 and CA-RIT-NFAT in PI-stimulated T cells at the 377 NFAT TAg-specific iDHSs (upper) and 666 NFAT-bound NAg-specific iDHSs (lower). (F) HOMER de novo identification of inducible TF motifs within the 377 and 666 sites. (G) Representative example of western blot assays of Fos, FosB, JunB, Jun, JunD, and B2M proteins in T cells.
Figure 5
Figure 5
Footprinting Analyses of TF Occupation in Naive and Tolerized T Cells (A and B) Footprints within (A) NAg- and (B) TAg-specific iDHSs ordered according to the Wellington footprinting occupancy score. (C and D) HOMER de novo identification of TF motifs enriched within footprints in the 1,824 NAg-specific iDHSs (C) and the 682 TAg-specific iDHSs (D). (E) Average profile showing the DNase I cuts around all NF-κB sites in the 1,824 NAg-specific iDHSs in NAg (upper) and 682 TAg-specific iDHSs in TAg (lower). (F and G) Examples of Wellington digital footprinting of DNase-seq data showing protection of an NF-κB site at a NAg-specific iDHS (F) and at a shared iDHS (G). DNase-seq data are shown for NAg and TAg, and ChIP-seq data for NF-κB (Oh et al., 2017). (H) Average profile showing the DNase I cuts around all AP-1/IRF sites in the 1,824 NAg-specific iDHSs in NAg (upper) and 682 TAg-specific iDHSs in TAg (lower). (I) Examples of Wellington digital footprinting of DNase-seq data showing protection of NFAT and composite AP-1/IRF motifs. DNase-seq data are shown for NAg and TAg, and ChIP-seq data for NFAT1 (Martinez et al., 2015), IRF4, and BATF (Li et al., 2012).
Figure 6
Figure 6
Altered Immunological Synapse Morphology and Reduced TCR-Proximal Signaling in Tolerant T Cells T cells were tolerized by either intra-nasal (IN) delivery of peptides (A–E and G) or sub-cutaneous injection of peptides (F). (A–C) Confocal microscopy of Th1-like cells or IN-tolerized T cells coupled with bone marrow APCs presenting cognate peptide for 10 min and imaged by immunofluorescence confocal microscopy following immune-labeling for (A) CD28, (B) PKCθ, or (C) Zap70. (D) Quantification of confocal microscopy images showing mean enrichment of PKCθ and Zap70 at the T cell-APC interface as in (B) and (C). Values were derived from at least three biological replicates. p values were calculated by Mann-Whitney test, error bars are SEM. (E) Western blot analyses of PKCθ T538 phosphorylation in Tg4 Th1 or IN-tolerant T cells following activation with cross-linked anti-CD3/CD28 for the indicated amounts of time. (F) Model depicting TCR and CD28 signaling pathways that can be antagonized when Cbl-b is activated by CTLA4 or PD-1, or bypassed by PMA. (G) TIRF microscopy of Cbl-b and PKCθ enrichment at the T cell immunological synapse in Th1-like cells or tolerized T cells. Scale bars: 10 μM.
Figure 7
Figure 7
A Two-Step Model Accounting for T Cell Tolerance In a normal T cell immune response, efficient co-activation of TCR and CD28 signaling leads to strong activation of inducible TFs and immune response genes. In tolerized T cells, inhibitory receptors activate repressive factors, such as the ubiquitin ligase Cbl-b, which weaken but do not eliminate TCR/CD28 signaling. This reduced level of signaling is sufficient to epigenetically prime and activate inhibitory receptor genes, but not most immune response genes.

References

    1. Anders S., Pyl P.T., Huber W. HTSeq—a Python framework to work with high-throughput sequencing data. Bioinformatics. 2015;31:166–169. - PMC - PubMed
    1. Anderson P.O., Sundstedt A., Yazici Z., Minaee S., O’Neill E.J., Woolf R., Nicolson K., Whitley N., Li L., Li S. IL-2 overcomes the unresponsiveness but fails to reverse the regulatory function of antigen-induced T regulatory cells. J. Immunol. 2005;174:310–319. - PubMed
    1. Anderson A.C., Joller N., Kuchroo V.K. Lag-3, Tim-3, and TIGIT: Co-inhibitory Receptors with Specialized Functions in Immune Regulation. Immunity. 2016;44:989–1004. - PMC - PubMed
    1. Bachmaier K., Krawczyk C., Kozieradzki I., Kong Y.Y., Sasaki T., Oliveira-dos-Santos A., Mariathasan S., Bouchard D., Wakeham A., Itie A. Negative regulation of lymphocyte activation and autoimmunity by the molecular adaptor Cbl-b. Nature. 2000;403:211–216. - PubMed
    1. Bevington S.L., Cauchy P., Piper J., Bertrand E., Lalli N., Jarvis R.C., Gilding L.N., Ott S., Bonifer C., Cockerill P.N. Inducible chromatin priming is associated with the establishment of immunological memory in T cells. EMBO J. 2016;35:515–535. - PMC - PubMed

Publication types