. 2020 Jun 9;31(10):107751.
doi: 10.1016/j.celrep.2020.107751.

Unique and Shared Roles for Histone H3K36 Methylation States in Transcription Regulation Functions

Affiliations

Unique and Shared Roles for Histone H3K36 Methylation States in Transcription Regulation Functions

Julia V DiFiore et al. Cell Rep. .

Abstract

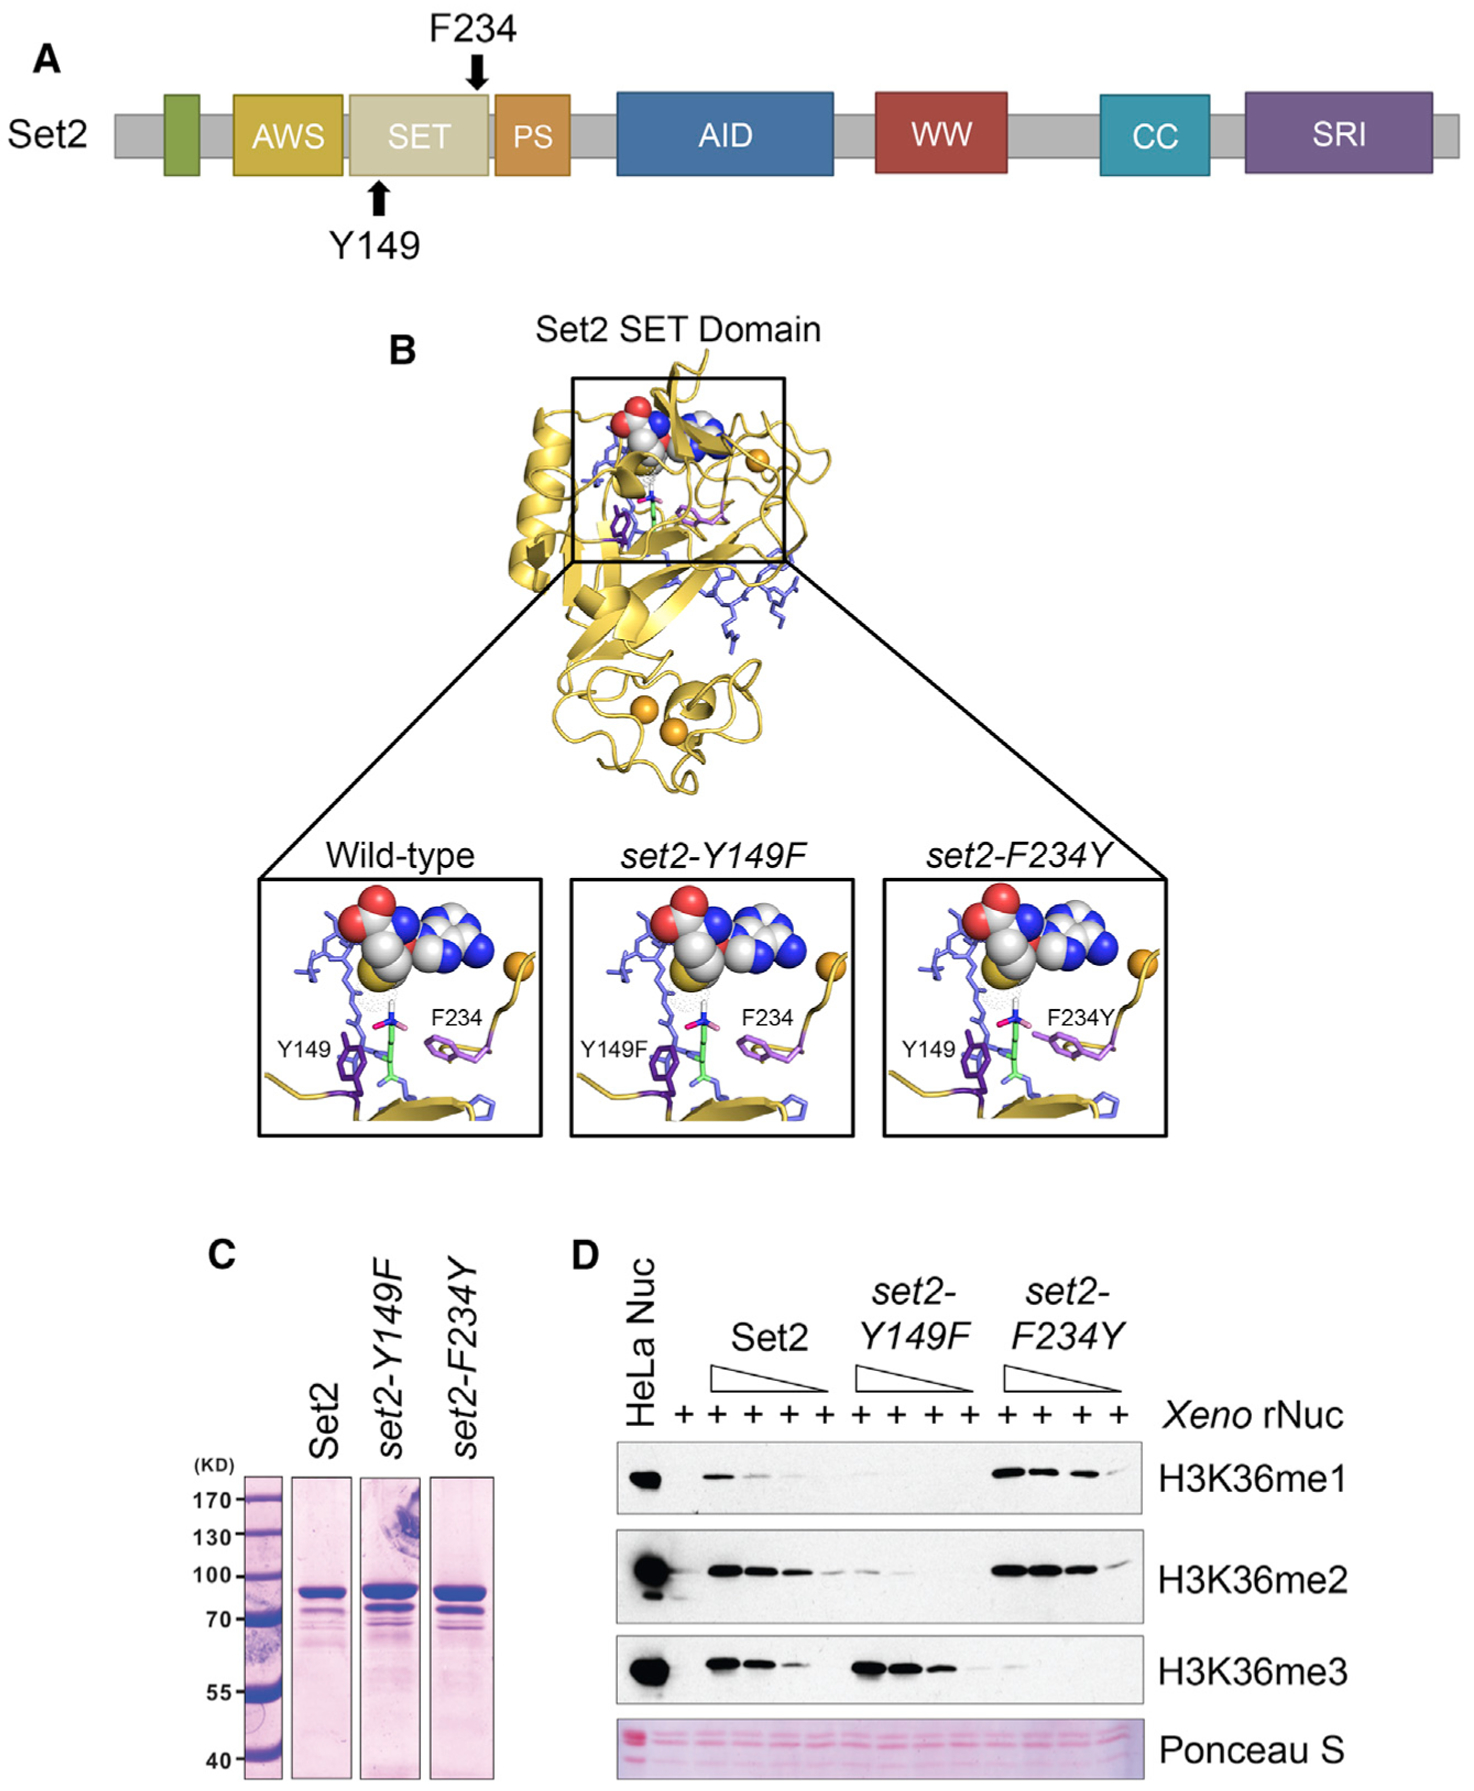
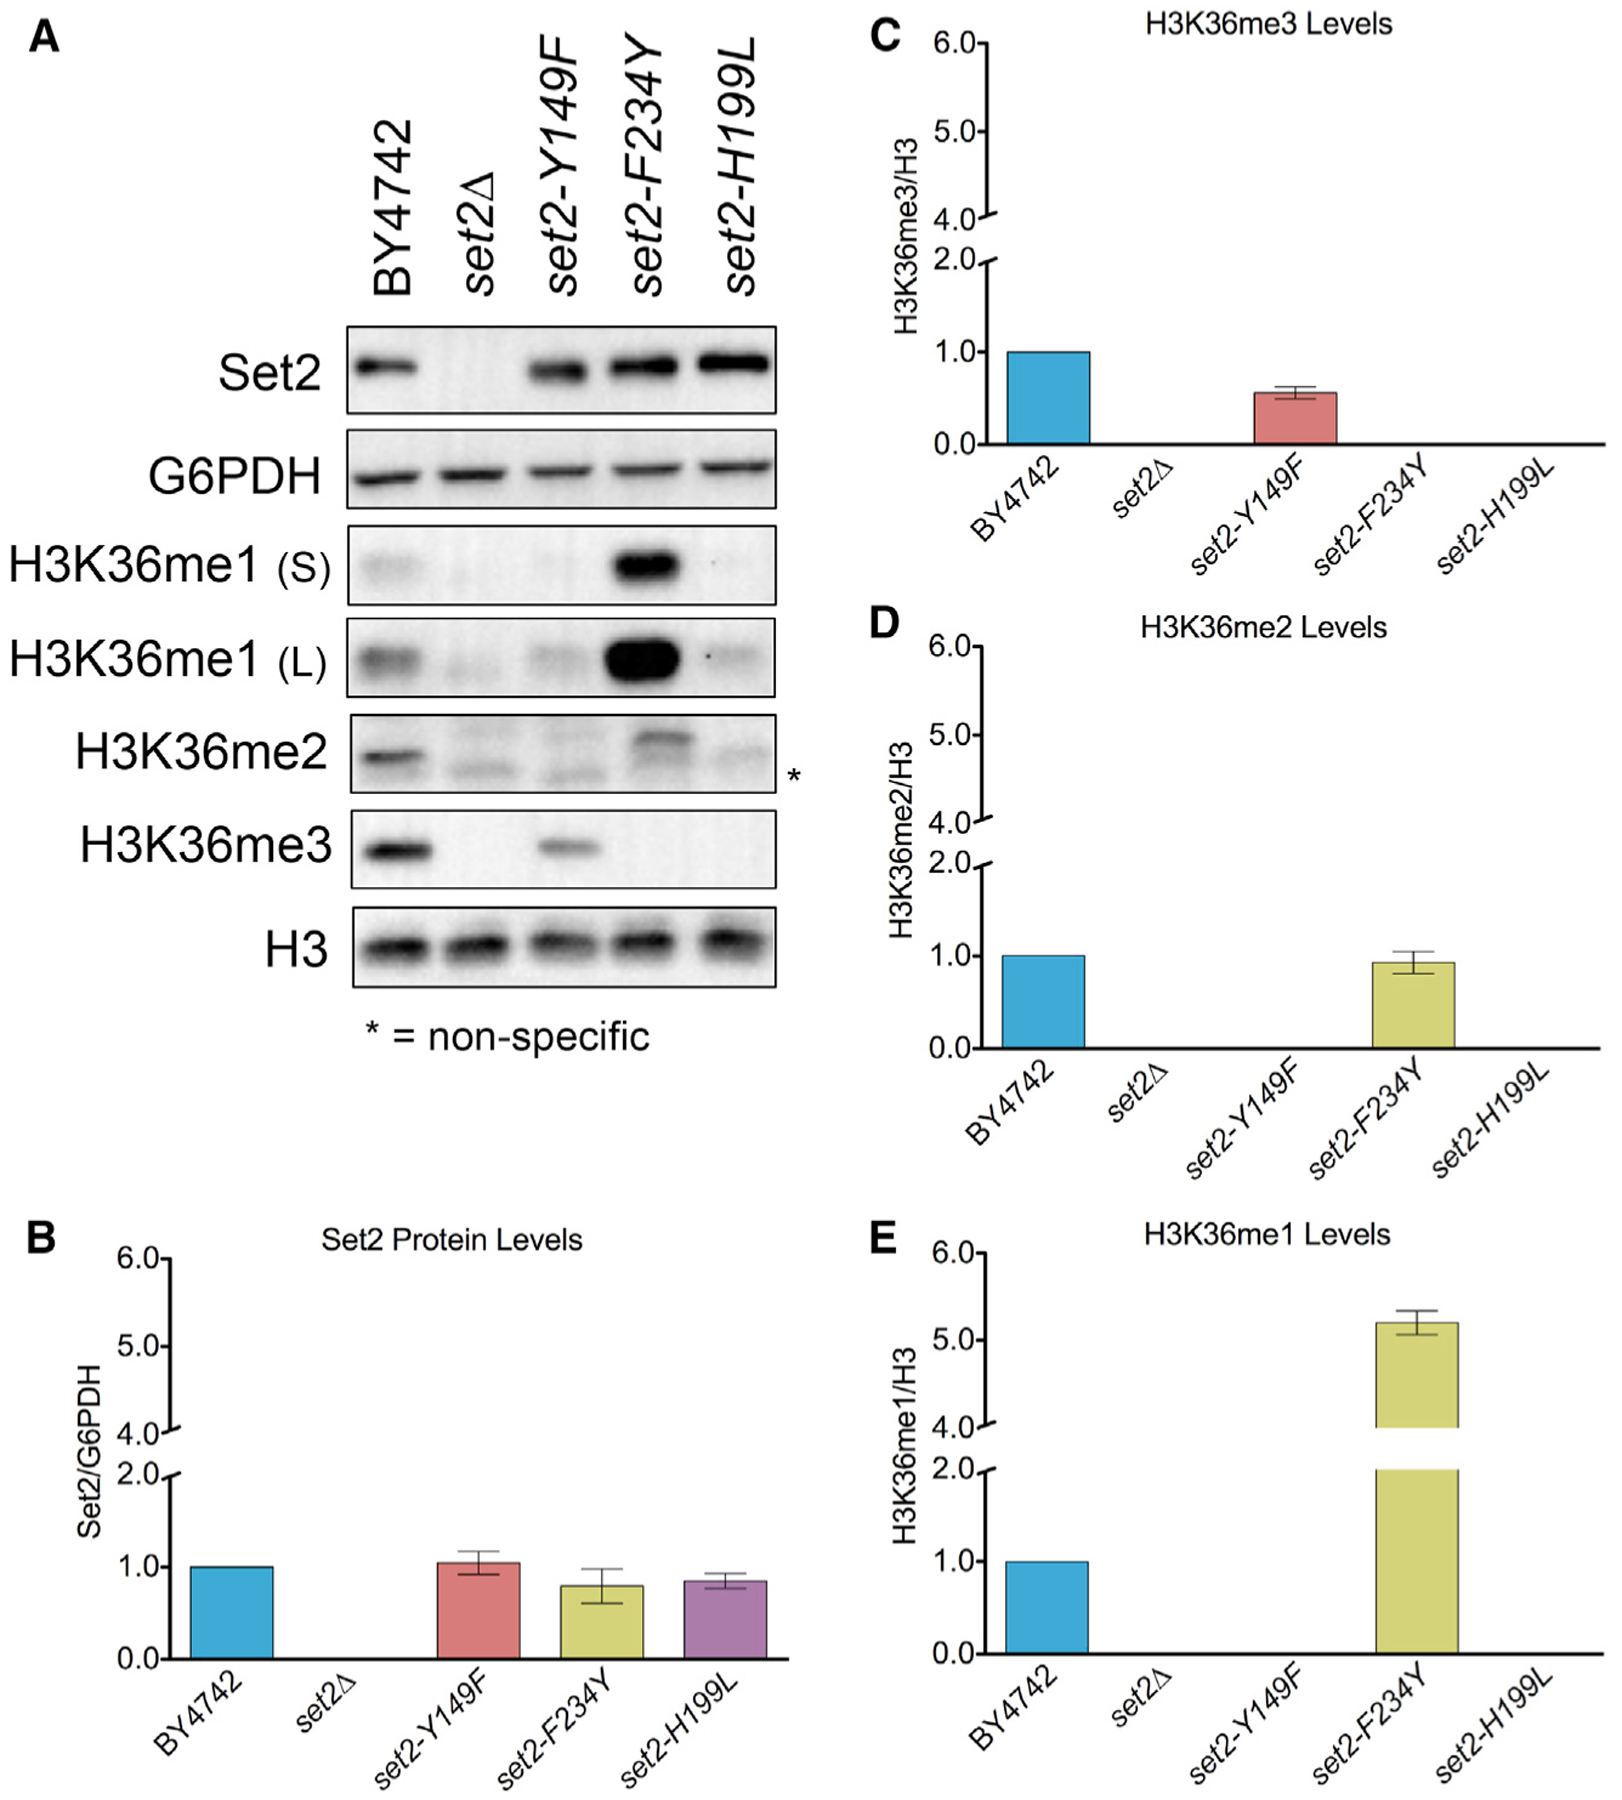
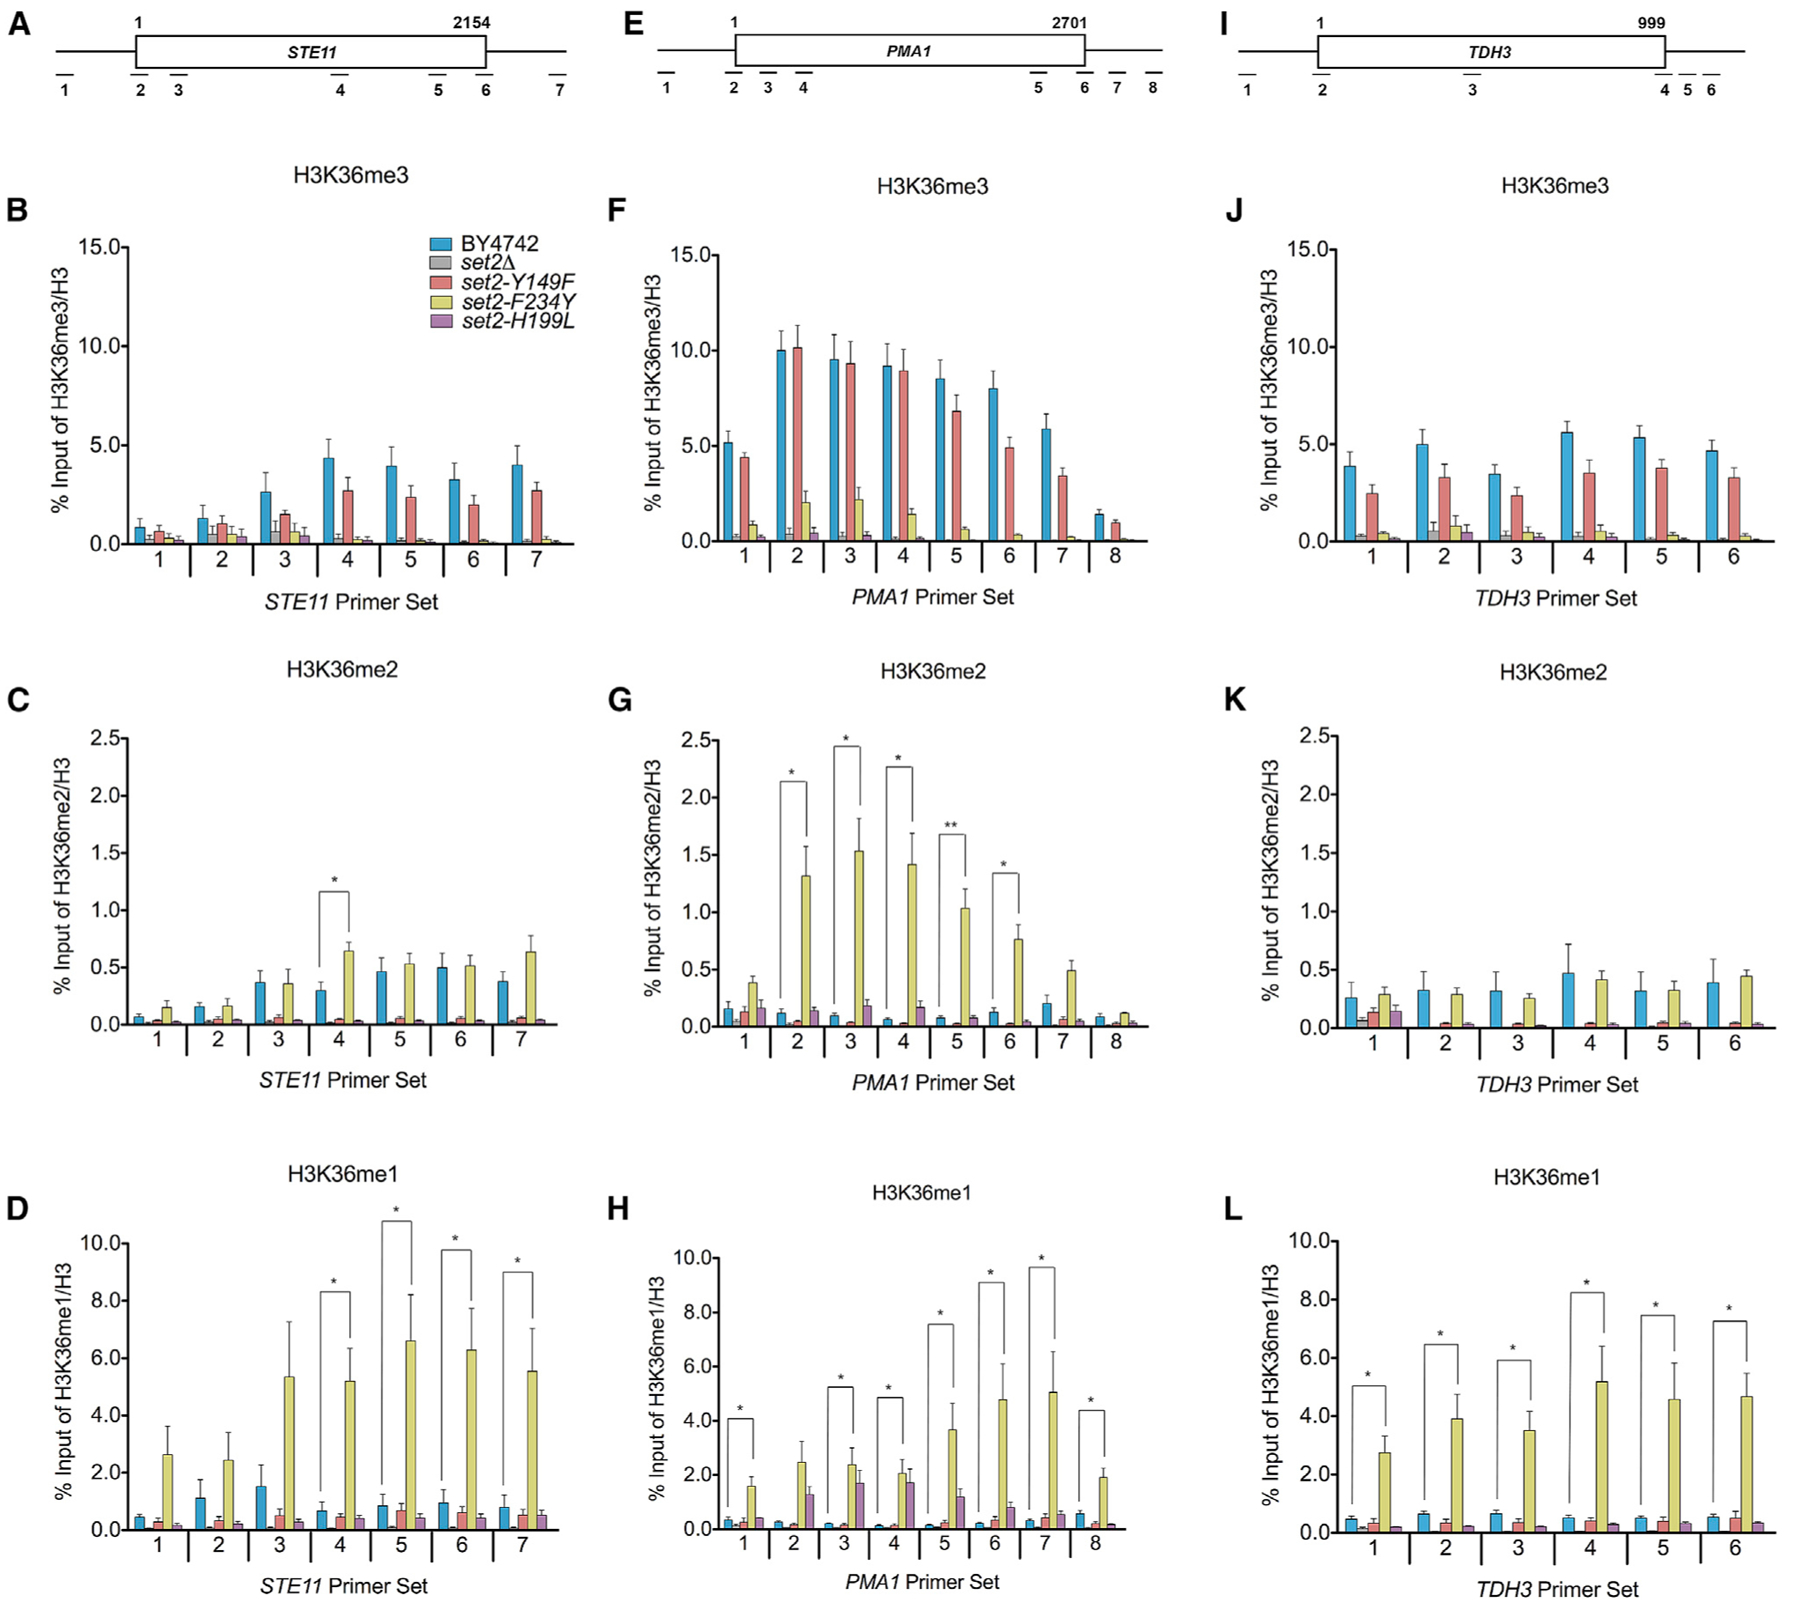
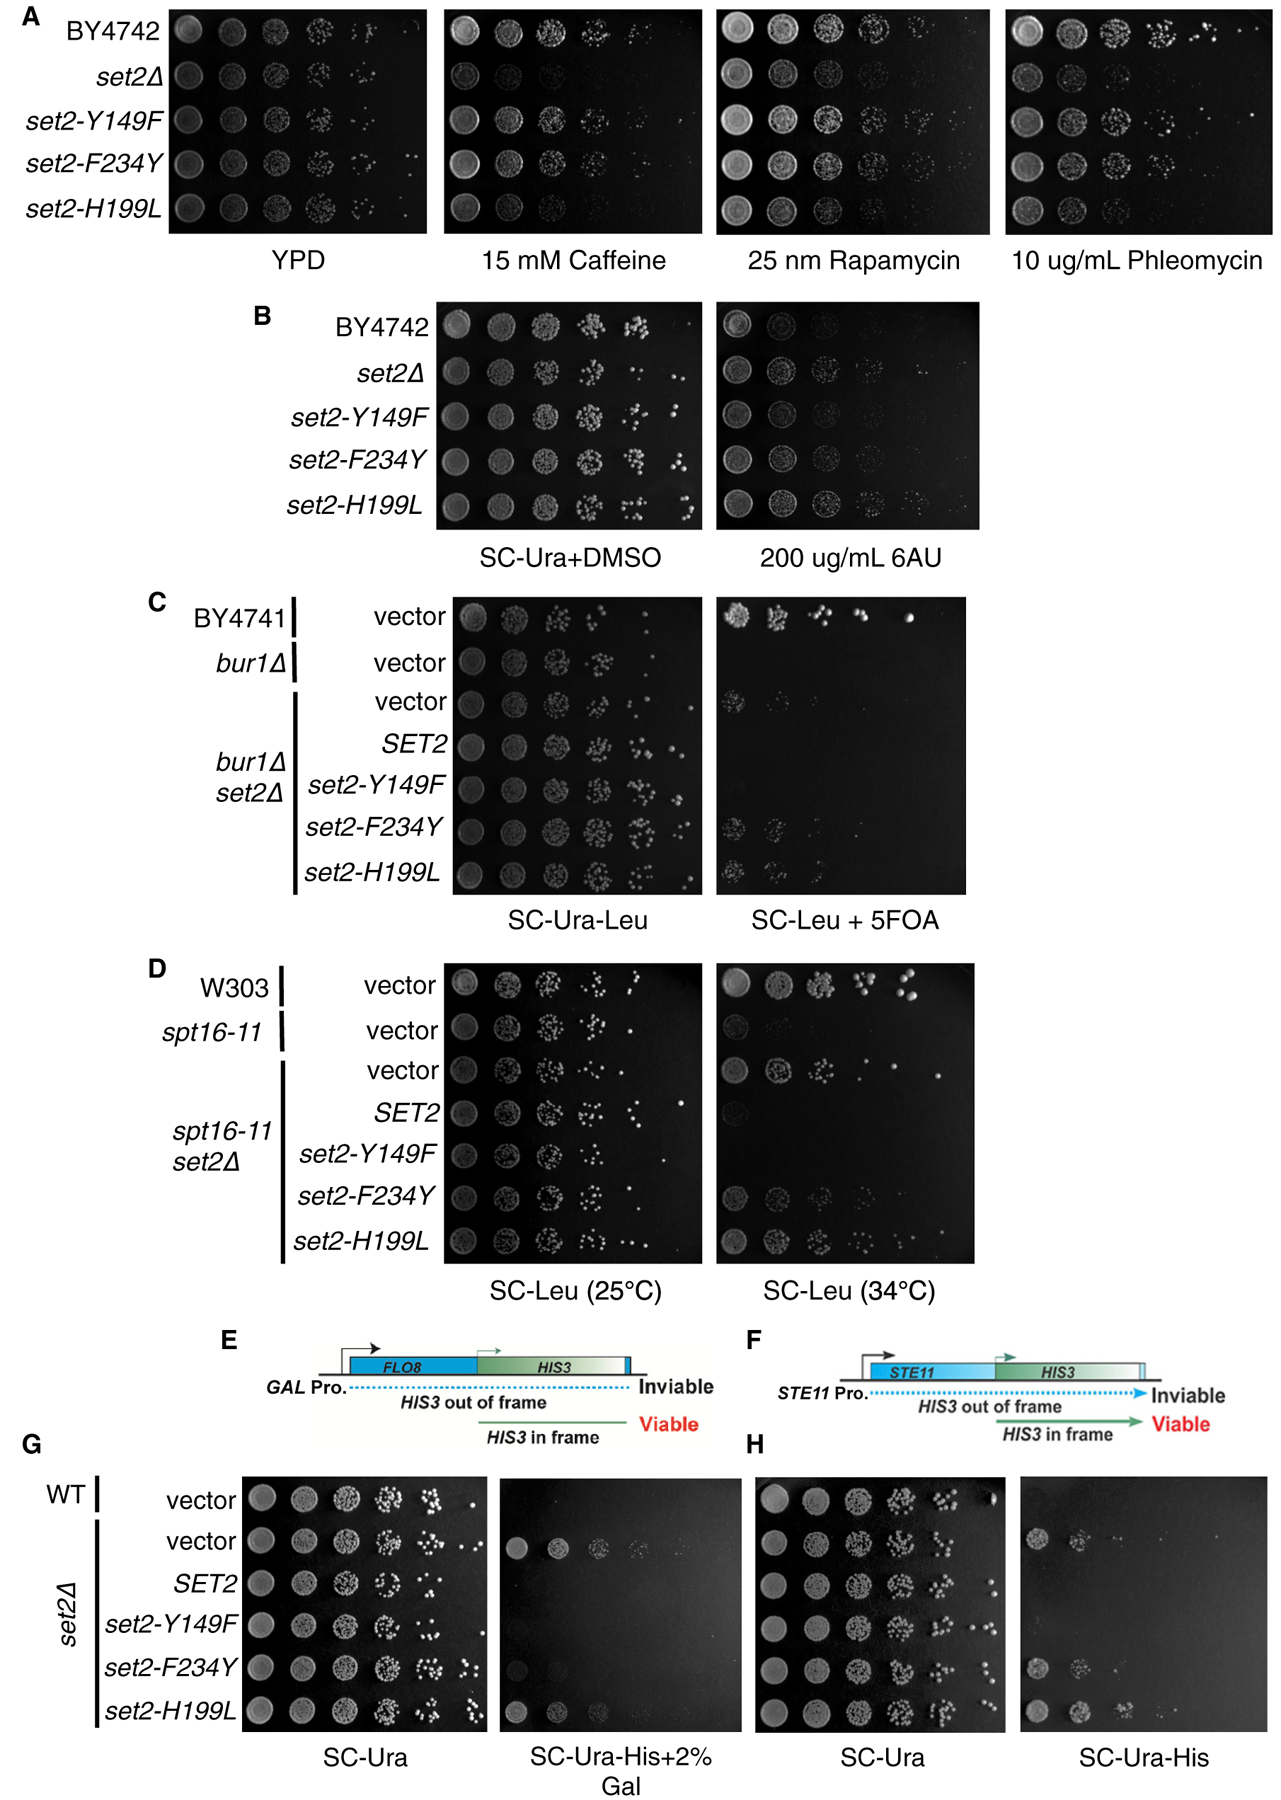
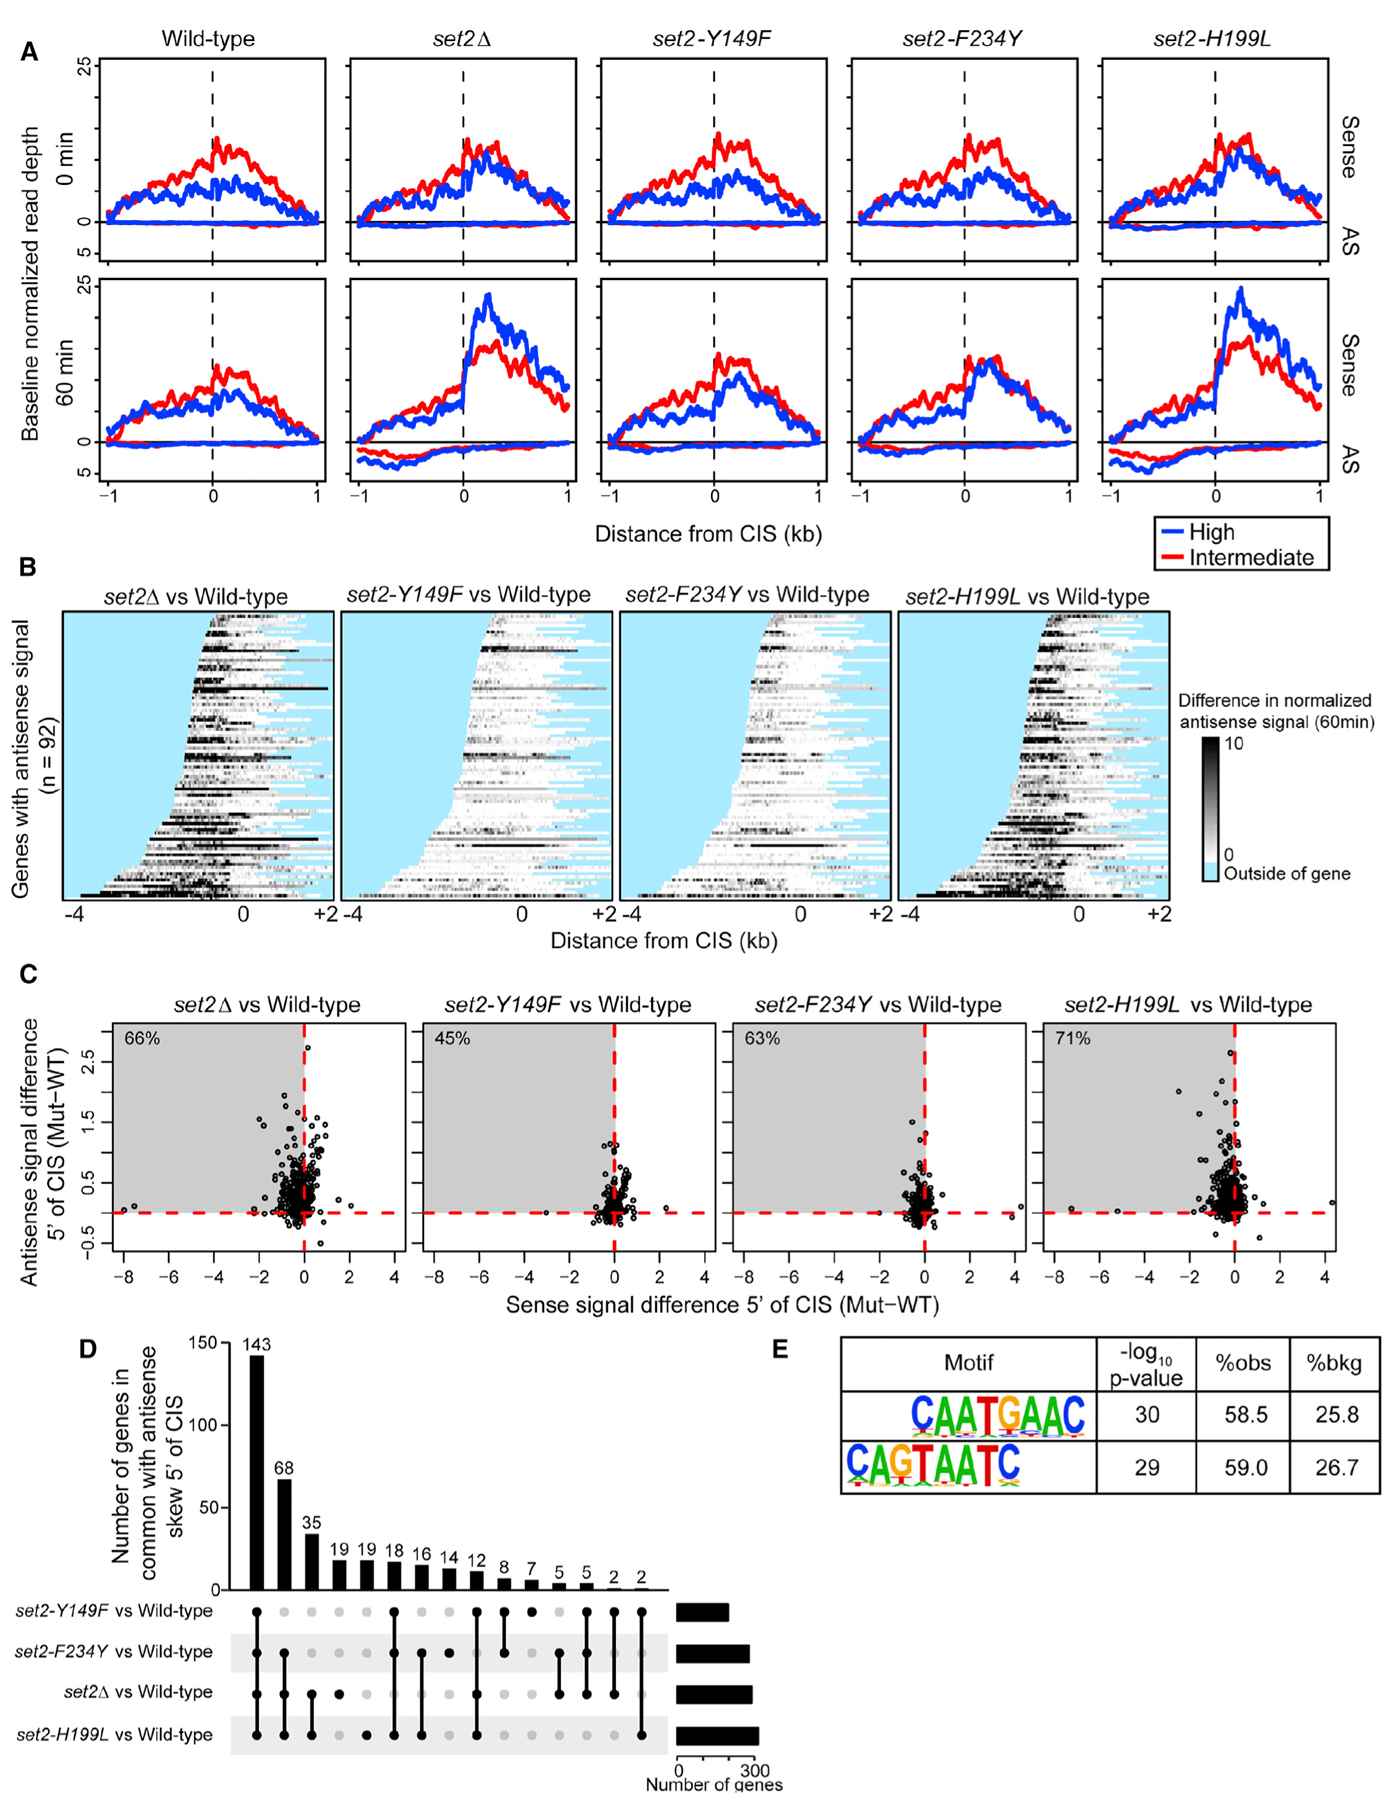
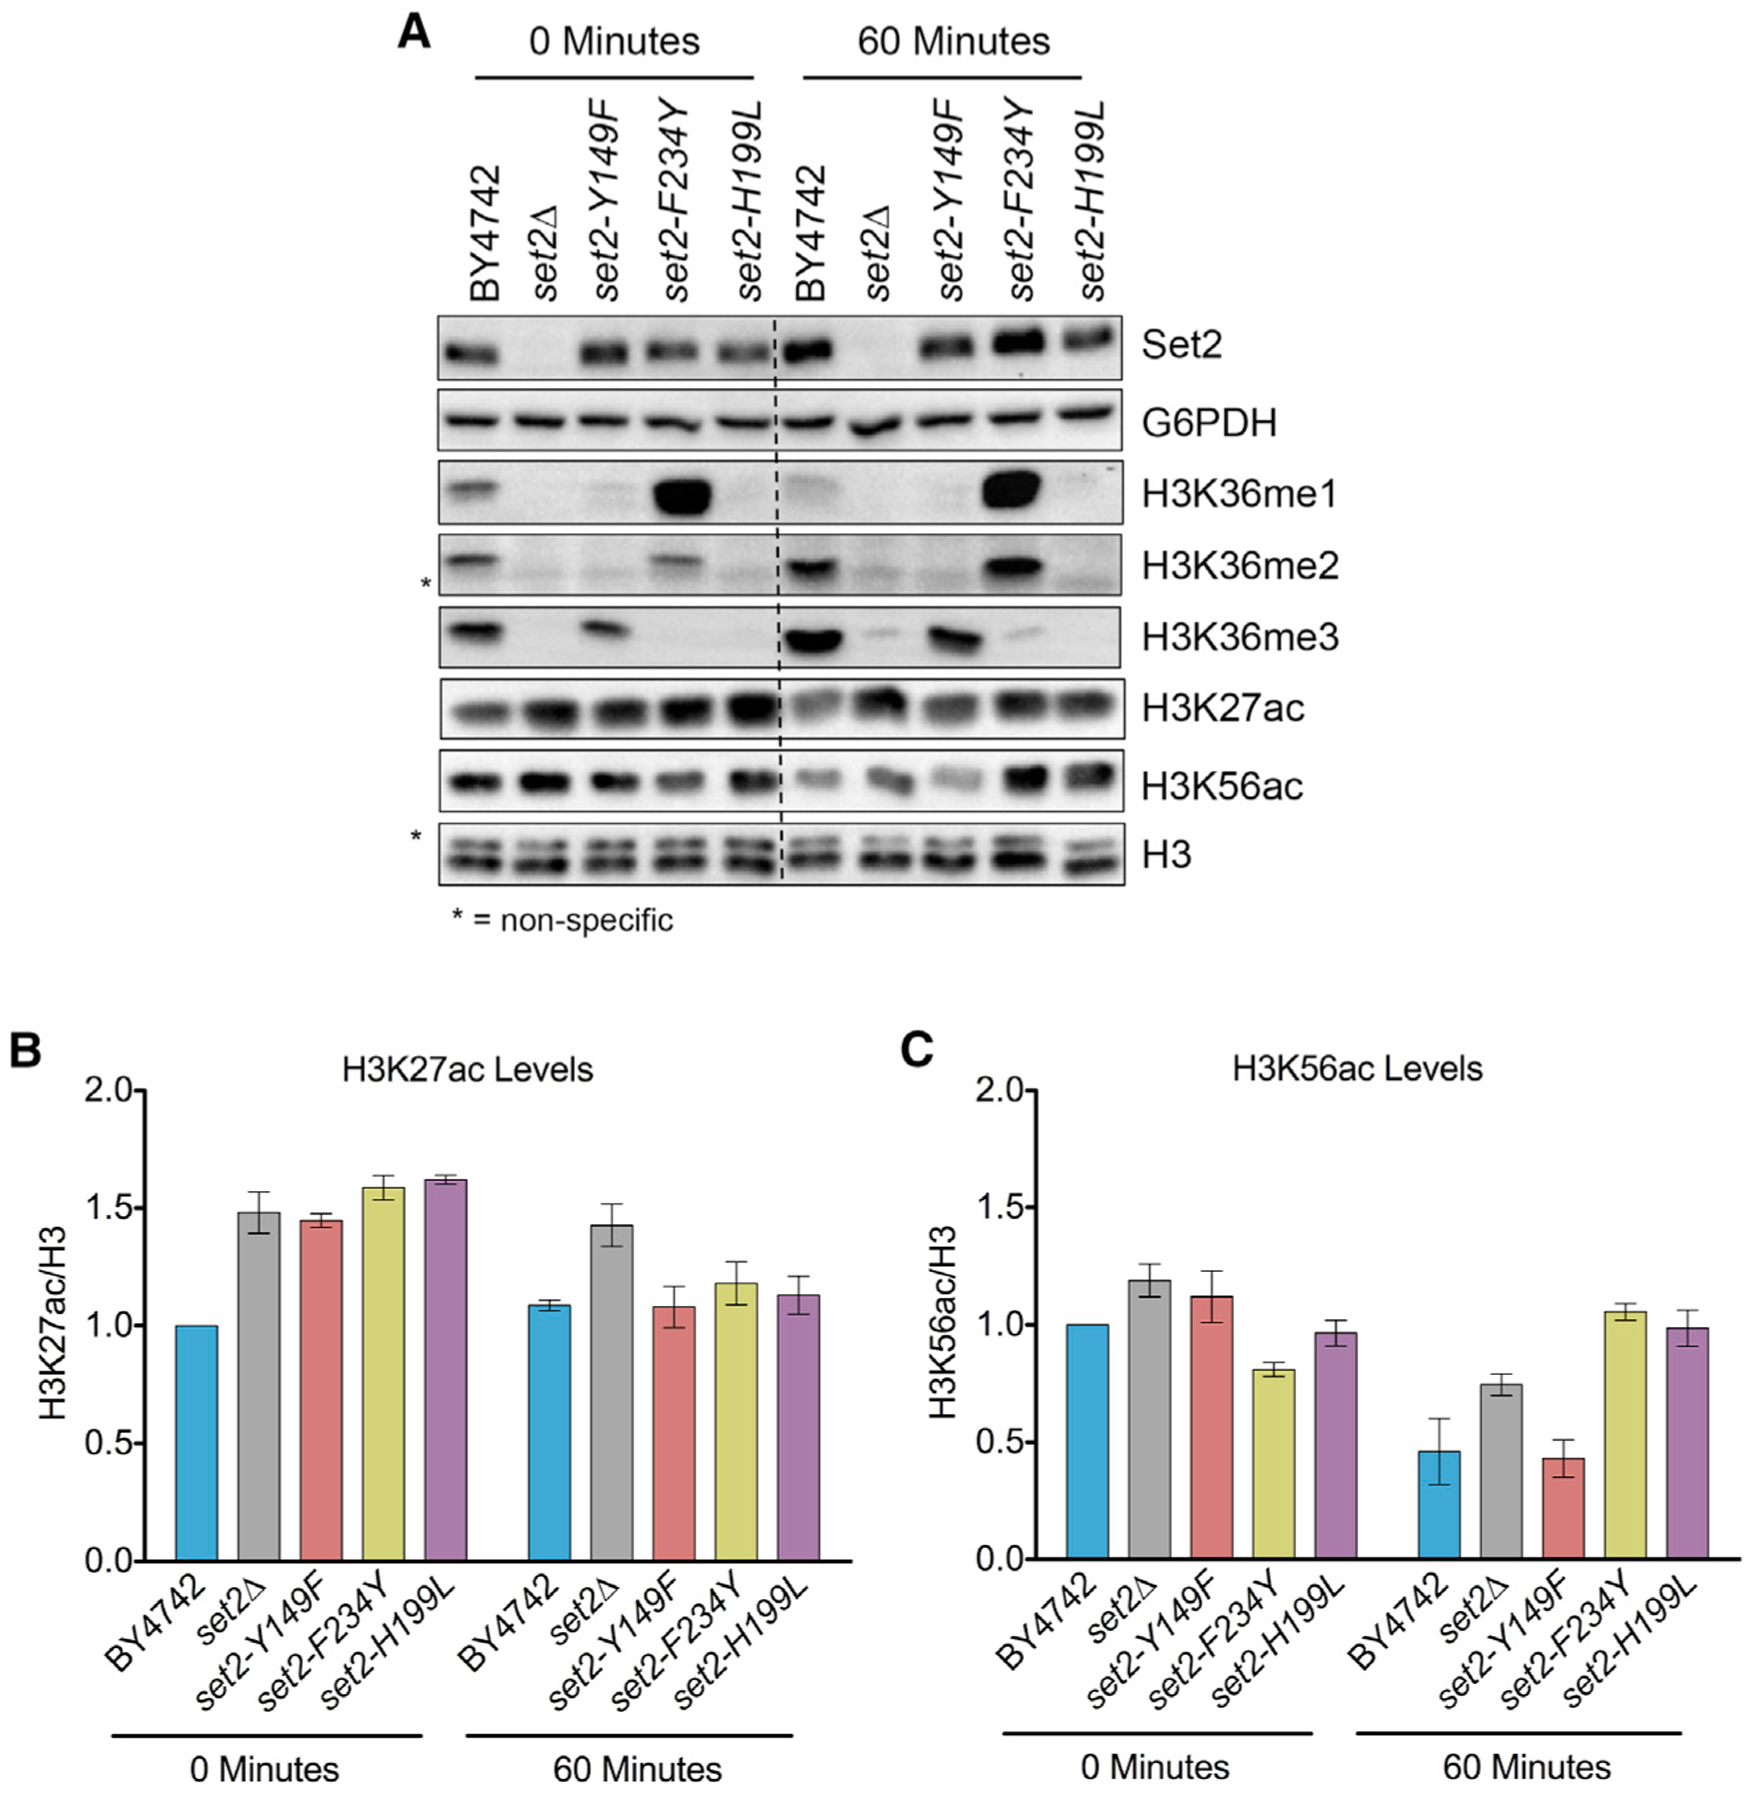
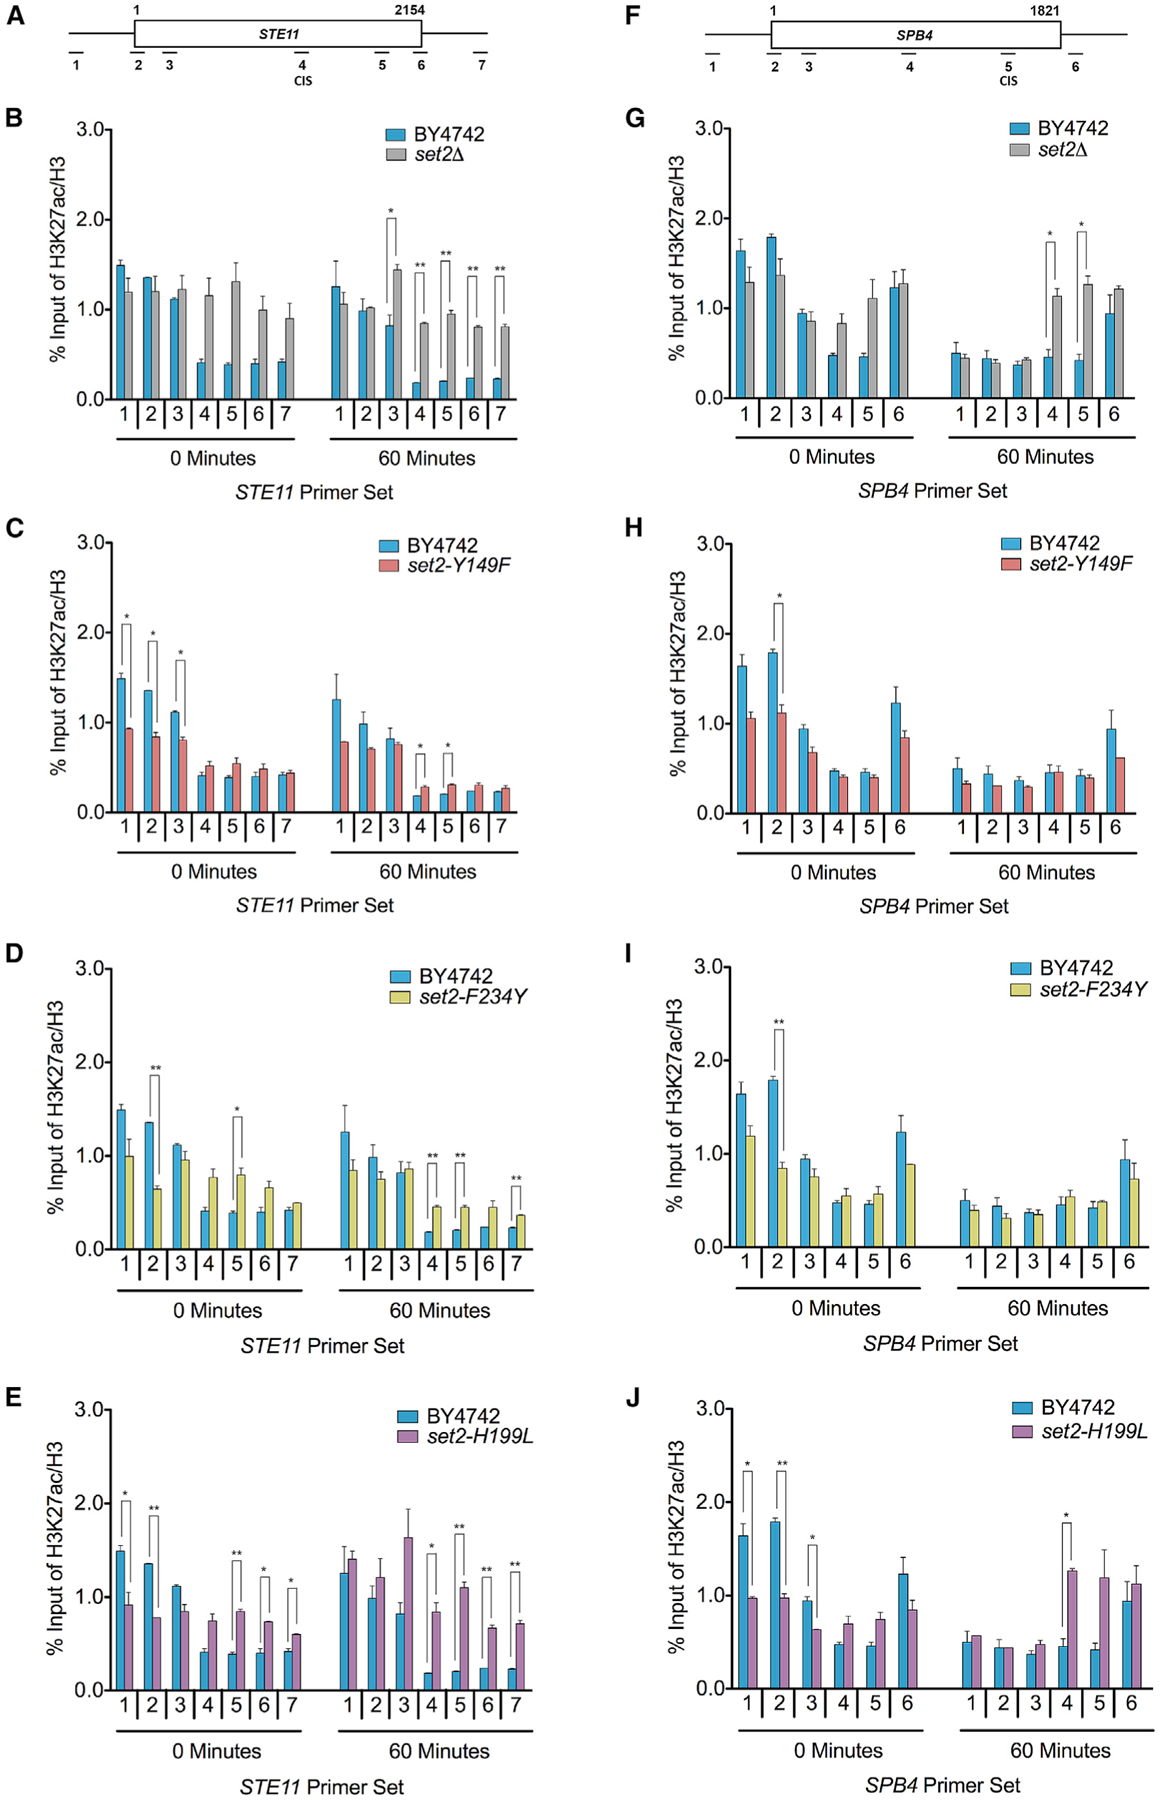
Set2 co-transcriptionally methylates lysine 36 of histone H3 (H3K36), producing mono-, di-, and trimethylation (H3K36me1/2/3). These modifications recruit or repel chromatin effector proteins important for transcriptional fidelity, mRNA splicing, and DNA repair. However, it was not known whether the different methylation states of H3K36 have distinct biological functions. Here, we use engineered forms of Set2 that produce different lysine methylation states to identify unique and shared functions for H3K36 modifications. Although H3K36me1/2 and H3K36me3 are functionally redundant in many SET2 deletion phenotypes, we found that H3K36me3 has a unique function related to Bur1 kinase activity and FACT (facilitates chromatin transcription) complex function. Further, during nutrient stress, either H3K36me1/2 or H3K36me3 represses high levels of histone acetylation and cryptic transcription that arises from within genes. Our findings uncover the potential for the regulation of diverse chromatin functions by different H3K36 methylation states.

Keywords: H3K36 methylation; RNA Polymerase II; Set2; chromatin; cryptic transcription; epigenetics; histone; nutrient stress; transcriptional regulation.


Conflict of interest statement

Declaration of Interests B.D.S. acknowledges he is a co-founder and scientific advisory board member of EpiCypher, Inc.

Figures

Figure 1.
Figure 1.. Phe/Tyr Switch in Set2 Separates H3K36 Methylation States in vitro
(A) Domain map of Set2 with the Y149 and F234 residues of the Phe/Tyr switch highlighted. The catalytic region of Set2 is composed of the associated with SET (AWS), catalytic SET domain, and post-SET (PS). The autoinhibitory domain (AID) regulates catalytic activity. The C-terminus of Set2 has protein-protein interaction domains, like the coiled-coiled (CC), WW, and Set2-Rpb1 (SRI) protein-protein interaction domain. (B) Model of Set2 SET domain (yellow) bound to H3 peptide (slate) and SAM (yellow, white, blue, and red spheres) with locations of the F234 (light purple) and Y149 (dark purple) that form the Phe/Tyr switch highlighted. H3K36 is green with methylation shown in white, light pink, and dark pink. Orange spheres are zinc ions necessary for catalysis. (C) Coomassie staining of recombinant Set2 and Phe/Tyr switch mutant proteins. Lanes not shown are other purified proteins not used in the following experiments. (D) Western blots of in vitro histone methyltransferase (HMT) assays using the indicated antibodies. In vitro HMT assays were performed with an equal amount of recombinant Set2 and Phe/Tyr switch mutant proteins from insect cells, recombinant Xenopus nucleosomes, and co-factor SAM. HeLa LONs (long oligonucleosomes) were used as a positive control for western blotting.
Figure 2.
Figure 2.. Phe/Tyr Switch Mutations in Set2 are Tools to Separate H3K36 Methylation States In Vivo
(A) Western blots of yeast strains probed with Set2 and different H3K36me antibodies. S, short exposure; L, long exposure. G6PDH and H3 served as loading controls. (B) Quantification of Set2 normalized to G6PDH in the indicated strains. Data for mutants were normalized relative to BY4742. (C–E) Quantification of H3K36me3 (C), H3K36me2 (D), and H3K36me1 (E) normalized to H3 in the indicated strains. H3K36me1 was quantified using the short exposure western blot. Measurement for all mutants was normalized BY4742. Each bar graph is representative of mean ± SEM of two or more independent biological replicates with a representative replicate shown in (A).
Figure 3.
Figure 3.. Distinct Methylated Forms of H3K36 Are Deposited within or near Transcribed Regions of Genes
(A) Schematic of STE11 with amplicons indicated below. (B–D) ChIP analysis of H3K36me3, H3K36me2, and H3K36me1 across STE11 in the indicated strains. The legend in (B) is representative for all the data presented in the figure. (E) Schematic of PMA1 with amplicons indicated below. (F–H) ChIP analysis of H3K36me3, H3K36me2, and H3K36me1 across PMA1 in the indicated strains. (I) Schematic of TDH3 with amplicons indicated below. (J–L) ChIP analysis of H3K36me3, H3K36me2, and H3K36me1 across TDH3 in the indicated strains. Data represented as mean ± SEM of three independent biological replicates. Student’s t test was used to obtain p values. Asterisks indicate significance (*p < 0.05; **p < 0.01); non-significant comparisons not shown. All qPCR primers are listed in Table S3.
Figure 4.
Figure 4.. H3K36me1/2 and H3K36me3 Have Unique Phenotypes in Some Cellular Contexts
(A) Five-fold serial dilutions of BY4742, set2Δ, and set2 mutant strains plated on YPD or YPD containing caffeine (15 mM), rapamycin (25 nM), or phleomycin (10 μg/mL). (B) Five-fold serial dilutions of BY4742, set2Δ, and set2 mutant strains plated on SC-Ura containing DMSO or 200 μg/mL 6-AU. (C) Five-fold serial dilutions of BY4741, bur1Δ, and set2 mutant strains plated on SC-Ura-Leu or SC-Ura-Leu containing 5-fluoorotic (5-FOA). (D) Five-fold serial dilutions of W303, spt16–11, and set2 mutant strains plated on SC-Leu and incubated at 25°C or 34°C. (E) Schematic of FLO8-HIS3 fusion gene reporter to detect cryptic transcription. (F) Schematic of STE11-HIS3 fusion gene reporter to detect cryptic transcription. (G) Five-fold serial dilutions of indicated WT, set2Δ, and set2 mutant strains plated on SC-Ura, SC-Ura-His with 2% galactose, or SC-Ura-His. All spotting assays were repeated three times, and the images shown are representative of the data.
Figure 5.
Figure 5.. Function of H3K36 Methylation States in Cryptic Transcription Regulation
(A) Sense and antisense normalized transcriptional signal (reads per million mapped) across 439 high- (blue) and intermediate- (red) confidence cryptic initiation sites (CISs) defined previously. Signal was averaged across three independent biological replicates and plotted for 0 min (top) and 60 min (bottom) following nutrient deprivation for each genetic model. The minimum value for each line was adjusted to 0 (y axis) to adjust for subtle differences in baseline expression and to focus on the position and range in magnitude of signal (see McDaniel et al., 2017). (B) Heatmap of antisense transcription, plotted as the difference in antisense signal between set2 mutant and WT (mutant-WT) at 60 min following nutrient deprivation. Normalized signal is plotted for 92 genes shown previously to have antisense transcription between the CIS and transcription start site. Darker gray indicates more antisense signal in mutant than in WT. Regions outside of the gene body are masked blue. (C) Scatterplot of sense and antisense signal differences (mutant-WT) in the mean per-base coverage over the gene regions between the CIS and transcription start site, for the 439 high- and intermediate-confidence CISs. Each point represents the CIS of a given gene; points that extend into the upper-left quadrant indicate a decrease in sense transcription (relative to WT) and a concomitant increase in antisense transcription. The percentage of all 439 genes falling in this quadrant is supplied in the top left of each panel. (D) UpSet plot showing overlaps for genes in the upper-left quadrants of (C). In total, 143 genes exhibited this antisense skew relative to WT in all four set2 mutants. (E) Significantly enriched sequence motifs discovered in the 100 bp surrounding the 439 CISs, requiring at least 2-fold enrichment relative to local background sequence.
Figure 6.
Figure 6.. Alteration of Global H3K27ac and H3K56ac in set2 Methylation Mutants
(A) Western blots of indicated strains probed with Set2, H3K36me1, H3K36me2, H3K36me3, H3K27ac, and H3K56ac antibodies. G6PDH and H3 served as loading controls. (B and C) Quantification of H3K27ac (B) and H3K56ac (C) normalized to H3. All measurements are normalized relative to BY4742 at 0 min. Each bar graph is representative of mean ± SEM of two or more independent biological replicates with a representative replicate shown in (A).
Figure 7.
Figure 7.. H3K36me1/2 and H3K36me3 Are Important for Proper H3K27ac Localization
(A) Schematic of STE11 with amplicons indicated below. Predicted CIS located within primer set 4. (B–E) ChIP analysis of H3K27ac across STE11 in the indicated strains and time points. (F) Schematic of SPB4 with amplicons indicated below. Predicted CIS located within primer set 5. (G–J) ChIP analysis of H3K27ac across SPB4 in the indicated strains and time points. Data represented as mean ± SEM of two independent biological replicates. Student’s t test was used to obtain p values. Asterisks indicate significance (*p < 0.05; **p < 0.01); non-significant comparisons are not shown. All qPCR primers are listed in Table S3.

References

    1. Ahn SH, Keogh MC, and Buratowski S (2009). Ctk1 promotes dissociation of basal transcription factors from elongating RNA polymerase II. EMBO J. 28, 205–212. - PMC - PubMed
    1. Basehoar AD, Zanton SJ, and Pugh BF (2004). Identification and distinct regulation of yeast TATA box-containing genes. Cell 116, 699–709. - PubMed
    1. Biswas D, Dutta-Biswas R, Mitra D, Shibata Y, Strahl BD, Formosa T, and Stillman DJ (2006). Opposing roles for Set2 and yFACT in regulating TBP binding at promoters. EMBO J. 25, 4479–4489. - PMC - PubMed
    1. Carrozza MJ, Li B, Florens L, Suganuma T, Swanson SK, Lee KK, Shia WJ, Anderson S, Yates J, Washburn MP, and Workman JL (2005). Histone H3 methylation by Set2 directs deacetylation of coding regions by Rpd3S to suppress spurious intragenic transcription. Cell 123, 581–592. - PubMed
    1. Cheng X, Collins RE, and Zhang X (2005). Structural and sequence motifs of protein (histone) methylation enzymes. Annu. Rev. Biophys. Biomol. Struct 34, 267–294. - PMC - PubMed

Publication types

MeSH terms