. 2020:27:102285.
doi: 10.1016/j.nicl.2020.102285. Epub 2020 Jun 1.

Mapping typical and hypokinetic dysarthric speech production network using a connected speech paradigm in functional MRI

Affiliations

Mapping typical and hypokinetic dysarthric speech production network using a connected speech paradigm in functional MRI

Shalini Narayana et al. Neuroimage Clin. 2020.

Abstract

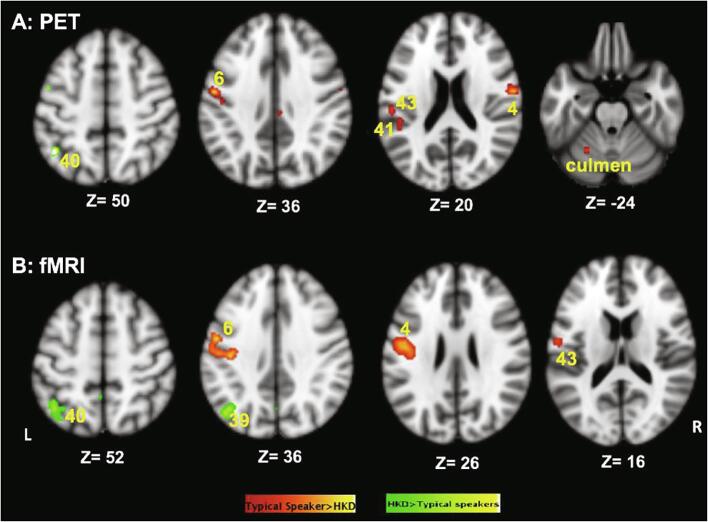
We developed a task paradigm whereby subjects spoke aloud while minimizing head motion during functional MRI (fMRI) in order to better understand the neural circuitry involved in motor speech disorders due to dysfunction of the central nervous system. To validate our overt continuous speech paradigm, we mapped the speech production network (SPN) in typical speakers (n = 19, 10 females) and speakers with hypokinetic dysarthria as a manifestation of Parkinson disease (HKD; n = 21, 8 females) in fMRI. We then compared it with the SPN derived during overt speech production by 15O-water PET in the same group of typical speakers and another HKD cohort (n = 10, 2 females). The fMRI overt connected speech paradigm did not result in excessive motion artifacts and successfully identified the same brain areas demonstrated in the PET studies in the two cohorts. The SPN derived in fMRI demonstrated significant spatial overlap with the corresponding PET derived maps (typical speakers: r = 0.52; speakers with HKD: r = 0.43) and identified the components of the neural circuit of speech production belonging to the feedforward and feedback subsystems. The fMRI study in speakers with HKD identified significantly decreased activity in critical feedforward (bilateral dorsal premotor and motor cortices) and feedback (auditory and somatosensory areas) subsystems replicating previous PET study findings in this cohort. These results demonstrate that the overt connected speech paradigm is feasible during fMRI and can accurately localize the neural substrates of typical and disordered speech production. Our fMRI paradigm should prove useful for study of motor speech and voice disorders, including stuttering, apraxia of speech, dysarthria, and spasmodic dysphonia.

Keywords: Connected speech; Hypokinetic dysarthria; Motor speech disorders; Normal speech; PET; Speech production; Speech production network; fMRI.


Figures

Fig. 1
Fig. 1
Speech motor areas engaged during reading aloud in the cohort of typical speakers identified by PET. The activation map is overlaid on the MNI template and the standard z coordinates are listed below the axial slices. The left hemisphere is on the left side of the image. The Brodmann areas are numbered: 6 - Dorsal premotor cortex, 32 – Cingulate gyrus, 4 - Primary motor cortex (M1-mouth), 43 – Precentral gyrus, 41 – Transverse temporal gyrus, 13 – Insula, 21 and 22 – Superior temporal gyrus, 17 – Cuneus, 18 – Lingual gyrus. In addition, the supplementary motor area (SMA) and the declive and culmen areas of the cerebellum are identified.
Fig. 2
Fig. 2
Speech motor areas engaged during reading aloud in the cohort of speakers with Hypokinetic dysarthria identified by PET. The activation map is overlaid on the MNI template and the standard z coordinates are listed below the axial slices. The left hemisphere is on the left side of the image. The Brodmann areas are numbered: 6 - Dorsal premotor cortex, 4 - Primary motor cortex (M1-mouth), 22 – Superior temporal gyrus, 17 – Cuneus, 18 – Lingual gyrus. In addition, the supplementary motor area (SMA) and the declive and culmen areas of the cerebellum are identified.
Fig. 3
Fig. 3
Activation pattern detected using BOLD fMRI using the overt connected speech paradigm in healthy individuals. The activation map is overlaid on the MNI template and the standard z coordinates are listed below the axial slices. The left hemisphere is on the left side of the image. The Brodmann areas are numbered: 6 - Dorsal premotor cortex, 24 – Cingulate gyrus, 4 - Primary motor cortex (M1-mouth), 43 – Post central gyrus, 41 – Transverse temporal gyrus, 13 – Insula, 21 and 22 – Superior temporal gyrus, 17 – Cuneus, 18 – Lingual gyrus. In addition, the supplementary motor area (SMA) and the declive and culmen areas of the cerebellum are identified.
Fig. 4
Fig. 4
Activation pattern detected using BOLD fMRI using the overt connected speech paradigm in speakers with HKD. The activation map is overlaid on the MNI template and the standard z coordinates are listed below the axial slices. The left hemisphere is on the left side of the image. The Brodmann areas are numbered: 6 - Dorsal premotor cortex, 7 – Precuneus, 4 - Primary motor cortex (M1-mouth), 43 – Post central gyrus, 41 – Transverse temporal gyrus, 13 – Insula, 21 and 22 – Superior temporal gyrus, 17 – Cuneus, 18 – Lingual gyrus. In addition, activation in right inferior frontal gyrus (BA 44), pre-SMA, SMA, and declive and culmen areas of the cerebellum are identified.
Fig. 5
Fig. 5
Speech motor maps in PET and fMRI derived in A. typical speakers and B. Speakers with HKD. The left hemisphere is on the left side of the image. Activation maps in red are from PET and those in green are derived from fMRI. The overlapping activations from the two modalities are shown in yellow. Note significant overlap of activity in the SMA, M1 mouth/larynx, visual cortex and the cerebellum in typical speakers and speakers with HKD. (For interpretation of the references to colour in this figure legend, the reader is referred to the web version of this article.)
Fig. 6
Fig. 6
Speech motor maps in typical speakers and HKD derived by A. PET and B. fMRI. The left hemisphere is on the left side of the image. Activation maps in red are from typical speakers and those in green are in speakers with HKD. The overlapping activations from the two cohorts are shown in yellow. Both PET and fMRI studies found that when compared to typical speakers, speakers with HKD had decreased activity in M1 mouth/larynx and auditory cortex while activity in the visual cortex was of similar extent. (For interpretation of the references to colour in this figure legend, the reader is referred to the web version of this article.)
Fig. 7
Fig. 7
Difference between the speech motor maps of typical speakers and speakers with HKD as derived by A. PET and B. fMRI. The left hemisphere is on the left side of the image. Activation maps in red denote typical speakers > Speakers with HKD and those in green denote Speakers with HKD > typical speakers contrasts. PET imaging found that when compared to typical speakers, speakers with HKD had decreased activity in left dorsal premotor (BA 6), opercular (BA 43), and auditory cortices (BA 41) and right M1 mouth/larynx (BA 4) and greater activity in left inferior parietal lobule (BA 40) during overt speaking. fMRI identified significant reductions in activity in left dorsal premotor (BA 6) and M1 mouth/larynx cortices (BA 4) and operculum (BA 43) and increased activity in left inferior parietal lobule (BA 40) and angular gyrus (BA 39) in speakers with HKD. (For interpretation of the references to colour in this figure legend, the reader is referred to the web version of this article.)

References

    1. Price C.J. The anatomy of language: a review of 100 fMRI studies published in 2009. Ann. N. Y. Acad. Sci. 2010;1191:62–88. - PubMed
    1. Price C.J. A review and synthesis of the first 20years of PET and fMRI studies of heard speech, spoken language and reading. NeuroImage. 2012;62:816–847. - PMC - PubMed
    1. Brown S., Laird A.R., Pfordresher P.Q., Thelen S.M., Turkeltaub P., Liotti M. The somatotopy of speech: Phonation and articulation in the human motor cortex. Brain Cogn. 2009;70:31–41. - PMC - PubMed
    1. Abo M., Kasahara K., Kakuda W., Senoo A. Functional MRI activation in repetition task using block and event-related design. J Appl Res. 2009;9:119–122.
    1. Guenther FH. Neural Control of Speech. The MIT Press; Cambridge MA, London England: 2016.

Publication types