Gill Transcriptome Sequencing and De Novo Annotation of Acanthogobius ommaturus in Response to Salinity Stress
- PMID: 32521805
- PMCID: PMC7349121
- DOI: 10.3390/genes11060631
Gill Transcriptome Sequencing and De Novo Annotation of Acanthogobius ommaturus in Response to Salinity Stress
Abstract
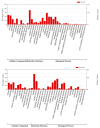
Acanthogobius ommaturus is a euryhaline fish widely distributed in coastal, bay and estuarine areas, showing a strong tolerance to salinity. In order to understand the mechanism of adaptation to salinity stress, RNA-seq was used to compare the transcriptome responses of Acanthogobius ommaturus to the changes of salinity. Four salinity gradients, 0 psu, 15 psu (control), 30 psu and 45 psu were set to conduct the experiment. In total, 131,225 unigenes were obtained from the gill tissue of A. ommaturus using the Illumina HiSeq 2000 platform (San Diego, USA). Compared with the gene expression profile of the control group, 572 differentially expressed genes (DEGs) were screened, with 150 at 0 psu, 170 at 30 psu, and 252 at 45 psu. Additionally, among these DEGs, Gene Ontology (GO) analysis indicated that binding, metabolic processes and cellular processes were significantly enriched. Kyoto Encyclopedia of Genes and Genomes (KEGG) pathways analysis detected 3, 5 and 8 pathways related to signal transduction, metabolism, digestive and endocrine systems at 0 psu, 30 psu and 45 psu, respectively. Based on GO enrichment analysis and manual literature searches, the results of the present study indicated that A. ommaturus mainly responded to energy metabolism, ion transport and signal transduction to resist the damage caused by salinity stress. Eight DEGs were randomly selected for further validation by quantitative real-time PCR (qRT-PCR) and the results were consistent with the RNA-seq data.
Keywords: Acanthogobius ommaturus; RNA-seq; differentially expressed genes (DEGs); salinity stress.
Conflict of interest statement
The authors declare no conflict of interest.
Figures


References
-
- Canovas C.G., Millan A., Velasco J., Vaughan I.P., Ormerod S.J. Contrasting effects of natural and anthropogenic stressors on beta diversity in river organisms. Glob. Ecol. Biogeogr. 2013;22:796–805. doi: 10.1111/geb.12060. - DOI
-
- Du Y., Zhang Y., Shi J. Relationship between sea surface salinity and ocean circulation and climate change. Sci. China Earth Sci. 2019;62:771–782. doi: 10.1007/s11430-018-9276-6. - DOI
-
- Charmantier G., Charmantier-Daures M. Ontogeny of osmoregulation in crustaceans: The embryonic phase. American zoologist. 2001;41:1078–1089. doi: 10.1093/icb/41.5.1078. - DOI
-
- Wang Y., Ye Z., Liu Q., Wang W., Cao L., Shen W. Otolith chemical signatures of spottedtail goby Synechogobius ommaturus in coastal waters of China. Chin. J. Oceanol. Limnol. 2011;29:640–646. doi: 10.1007/s00343-011-0125-4. - DOI
Publication types
MeSH terms
LinkOut - more resources
Full Text Sources

