. 2020 Jun 8;21(11):4101.
doi: 10.3390/ijms21114101.

DHA Modulates Immune Response and Mitochondrial Function of Atlantic Salmon Adipocytes after LPS Treatment

Affiliations

DHA Modulates Immune Response and Mitochondrial Function of Atlantic Salmon Adipocytes after LPS Treatment

Marta Bou et al. Int J Mol Sci. .

Abstract

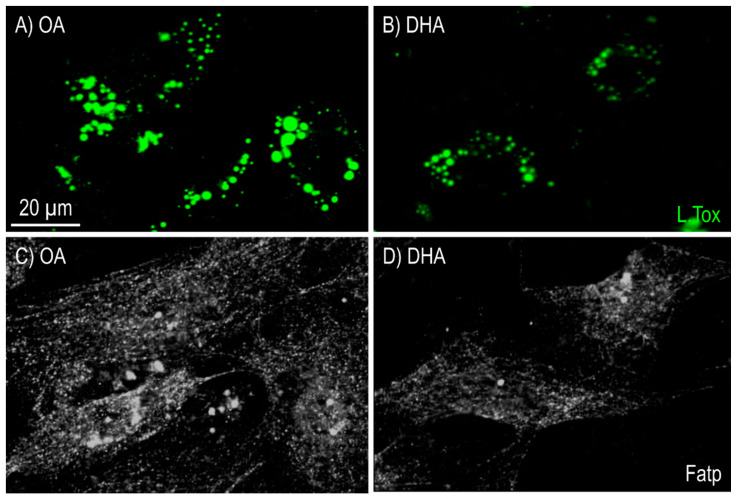
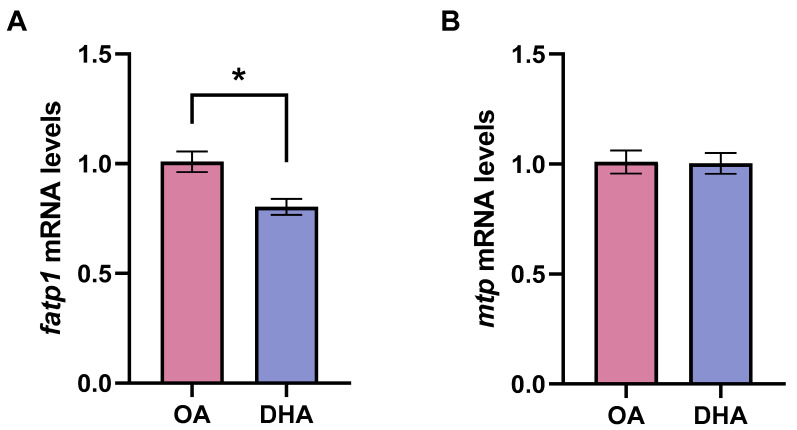
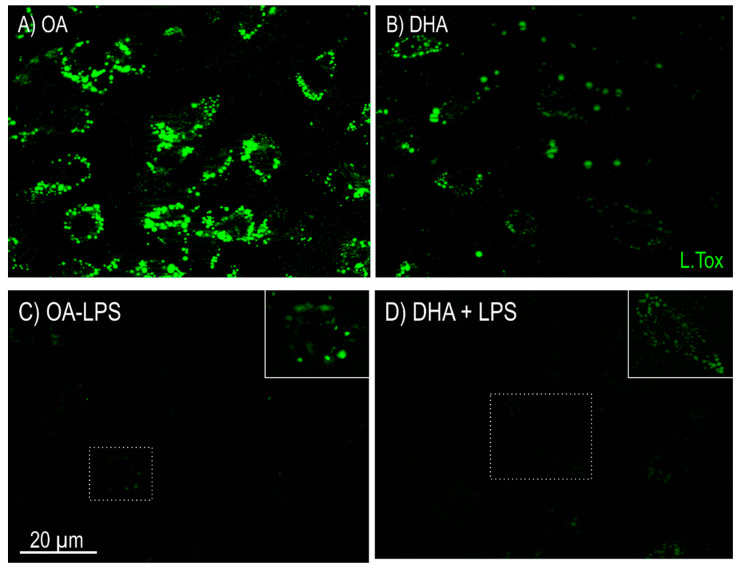
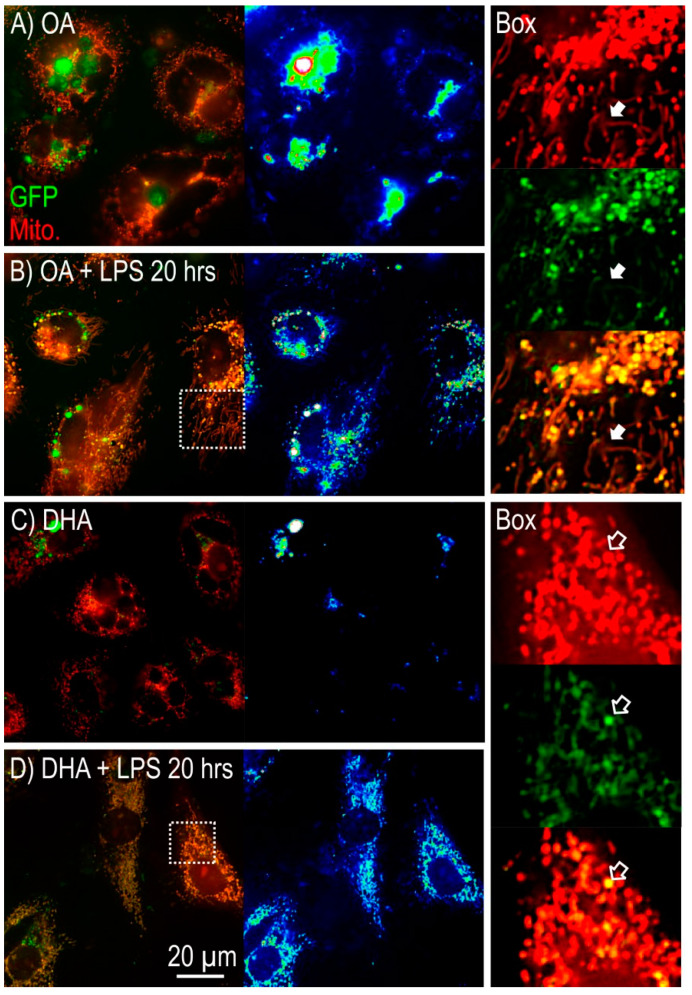
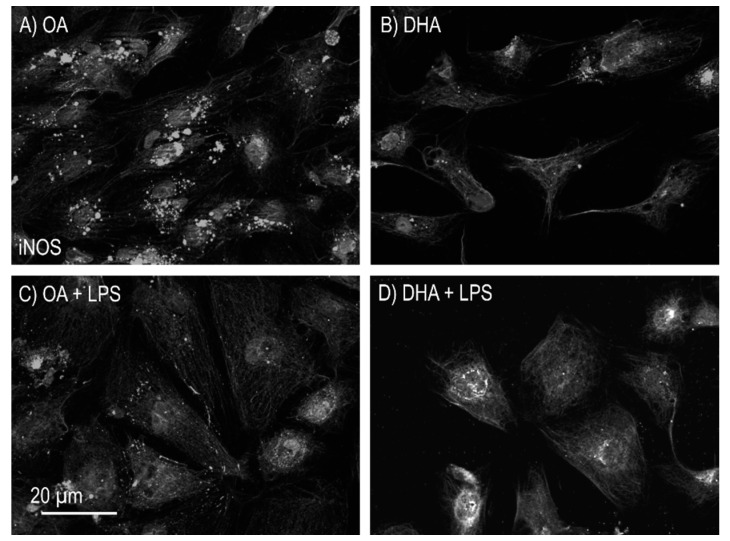
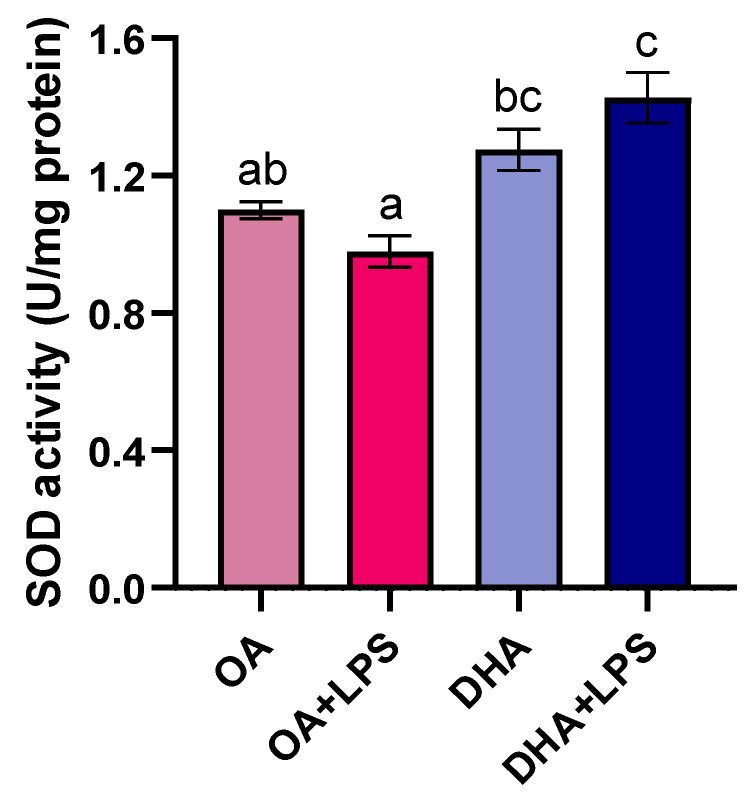
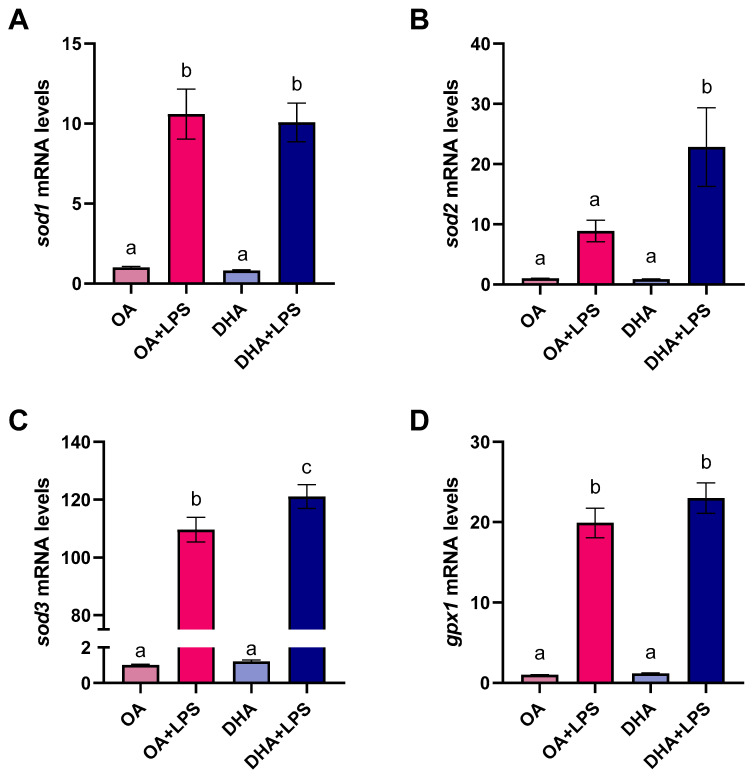
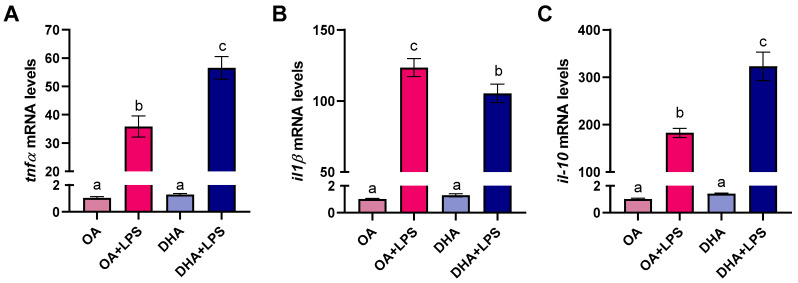
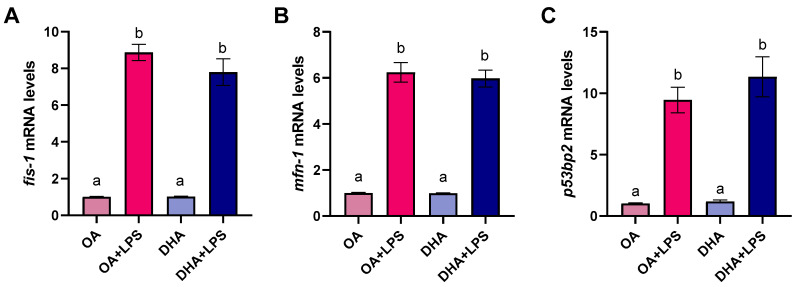
Adipocytes play a central role in overall energy homeostasis and are important contributors to the immune system. Fatty acids (FAs) act as signaling molecules capable to modulate adipocyte metabolism and functions. To identify the effects of two commonly used FAs in Atlantic salmon diets, primary adipocytes were cultured in the presence of oleic (OA) or docosahexaenoic (DHA) acid. DHA decreased adipocyte lipid droplet number and area compared to OA. The increase in lipid load in OA treated adipocytes was paralleled by an increase in iNOS activity and mitochondrial SOD2-GFP activity, which was probably directed to counteract increase in oxidative stress. Under lipopolysaccharide (LPS)-induced inflammation, DHA had a greater anti-inflammatory effect than OA, as evidenced by the higher SOD2 activity and the transcriptional regulation of antioxidant enzymes and pro- and anti-inflammatory markers. In addition, DHA maintained a healthy mitochondrial structure under induced inflammation while OA led to elongated mitochondria with a thin thread like structures in adipocytes exposed to LPS. Overall, DHA possess anti-inflammatory properties and protects Atlantic salmon against oxidative stress and limits lipid deposition. Furthermore, DHA plays a key role in protecting mitochondria shape and function.

Keywords: Salmo salar; adipocytes; antioxidant enzymes; mitochondria; n-3 HUFAs; oxidative stress.


Conflict of interest statement

The authors declare no conflict of interest.

Figures

Figure 1
Figure 1
Imaging of lipid droplets by fluorescence microscopy stained with LipidTOX (green) in mature Atlantic salmon adipocytes in vitro incubated with oleic (OA) (A) or docosahexaenoic acid (DHA) (B) for 6 days. Immunofluorescence detection of fatty acid transport protein 1 (FATP1) level in mature Atlantic salmon adipocytes in vitro incubated with oleic (OA) (C) or docosahexaenoic acid (DHA) (D) for 6 days. 30 images were collected per treatment group (10 images per flask). One representative image for each treatment group is shown in this figure.
Figure 2
Figure 2
Transcript levels of fatty acid transport protein 1 (fatp1) (A) and microsomal triglyceride transfer protein (mtp) (B) in mature adipocytes incubated for 6 days with 100 µM oleic acid (OA) or 100 µM docosahexaenoic acid (DHA). Samples (n = 8) were analyzed with real-time qPCR; data are presented as fold change ± SEM using ef1α as a reference gene and the OA group was set to one (delta-delta method). Asterisks (*) indicate significant differences between conditions (p < 0.05; Student’s t-test).
Figure 3
Figure 3
Imaging of lipid droplets by fluorescence microscopy stained with LipidTOX (green) in mature Atlantic salmon adipocytes in vitro incubated with oleic (OA) (A) or docosahexaenoic acid (DHA) (B) for 6 days. Thereafter, the OA group (C) and the DHA group (D) were exposed to lipopolysaccharide (LPS) for 20 h and imaged using the same microscopy settings. A strong lipolysis effect was observed post LPS treatment, for both OA and DHA treated cells. Boxed areas are enlarged in the upper right corners in (C,D). 30 images were collected per treatment group (10 images per flask). One representative image for each treatment group is shown in this figure.
Figure 4
Figure 4
Imaging of mitochondrial morphology in mature Atlantic salmon adipocytes in vitro incubated with oleic acid (OA) (A) or docosahexaenoic acid (DHA) (C) for 6 days. Thereafter, the OA group (B) and the DHA group (D) were exposed to lipopolysaccharide (LPS) for 20 h. Mitochondria were visualized using MitoTracker (red) and a mitochondrial targeting SOD2-GFP construct (green). The panel on the right shows the area highlighted in the white dotted box for (B,D), showing the red channel, the green channel, and the merged image (colocalization shown in orange/yellow). Solid arrows point to fragmented mitochondria and open arrows point to round mitochondria.
Figure 5
Figure 5
Immunofluorescence detection of inducible nitric oxide synthase (iNOS) in mature Atlantic salmon adipocytes in vitro incubated with oleic (OA) (A) or docosahexaenoic acid (DHA) (B) for 6 days. Thereafter, the OA group (C) and the DHA group (D) were exposed to lipopolysaccharide (LPS) for 20 h.
Figure 6
Figure 6
Intracellular superoxide dismutase activity (SOD) in mature adipocytes incubated for 6 days with 100 µM oleic acid (OA) or 100 µM docosahexaenoic acid (DHA) and thereafter exposed to lipopolysaccharide (LPS) for 20 h (OA+LPS and DHA+LPS, respectively). Data are presented as mean ± SEM (n = 4). Different letters indicate significant differences between treatments (p < 0.05, ANOVA followed by Tukey’s post hoc test).
Figure 7
Figure 7
Transcript levels of superoxide dismutase 1 (cytosolic) (sod1) (A), superoxide dismutase 2 (mitochondrial) (sod2) (B), superoxide dismutase 3 (extracellular) (sod3) (C), and glutathione peroxidase 1 (gpx1) (D) in mature adipocytes incubated for 6 days with 100 µM oleic acid (OA) or 100 µM docosahexaenoic acid (DHA) and thereafter exposed to lipopolysaccharide (LPS) for 20 h (OA+LPS and DHA+LPS, respectively). Samples (n = 8 for OA and DHA groups and n = 6 for OA+LPS and DHA+LPS) were analyzed with real-time qPCR. Data are presented as fold change ± SEM using ef1α as a reference gene and the OA group was set to one (delta-delta method). Different letters indicate significant differences between treatments (p < 0.05, ANOVA followed by Tukey’s post hoc test).
Figure 8
Figure 8
Transcript levels of tumor necrosis factor (tnf-α) (A) interleukin 1β (il-1β) (B), and interleukin 10 (il-10) (C) in mature adipocytes incubated for 6 days with 100 µM oleic acid (OA) or 100 µM docosahexaenoic acid (DHA) and thereafter exposed to lipopolysaccharide (LPS) for 20 h (OA+LPS and DHA+LPS, respectively). Samples (n = 8 for OA and DHA groups and n = 6 for OA+LPS and DHA+LPS) were analyzed with real-time qPCR. Data are presented as fold change ± SEM using ef1α as a reference gene and the OA group was set to one (delta-delta method). Different letters indicate significant differences between treatments (p < 0.05, ANOVA followed by Tukey’s post hoc test).
Figure 9
Figure 9
Transcript levels of mitochondrial fission protein 1 (fis-1) (A) mitofusin 1 (mfn-1) (B), and tumor protein P53 binding protein 2 (p53bp2) (C) in mature adipocytes incubated for 6 days with 100 µM oleic acid (OA) or 100 µM docosahexaenoic acid (DHA) and thereafter exposed to lipopolysaccharide (LPS) for 20 h (OA+LPS and DHA+LPS, respectively). Samples (n = 8 for OA and DHA groups and n = 6 for OA+LPS and DHA+LPS) were analyzed with real-time qPCR. Data are presented as fold change ± SEM using ef1α as a reference gene and the OA group was set to one (delta-delta method). Different letters indicate significant differences between treatments (p < 0.05, ANOVA followed by Tukey’s post hoc test).

References

    1. Aas T.S., Ytrestøyl T., Åsgård T. Utilization of feed resources in the production of Atlantic salmon (Salmo salar) in Norway: An update for 2016. Aquac. Rep. 2019;15:100216. doi: 10.1016/j.aqrep.2019.100216. - DOI
    1. Colombo S.M., Foroutani M.B., Parrish C.C. Fats and Oils in Aquafeed Formulations. In: Shahidi F., editor. Bailey’s Industrial Oil and Fat Products. Wiley Online Library; Hoboken, NJ, USA: 2020. pp. 1–28.
    1. Todorčević M., Kjær M.A., Djaković N., Vegusdal A., Torstensen B.E., Ruyter B. N-3 HUFAs affect fat deposition, susceptibility to oxidative stress, and apoptosis in Atlantic salmon visceral adipose tissue. Comp. Biochem. Physiol. Part B Biochem. Mol. Biol. 2009;152:135–143. doi: 10.1016/j.cbpb.2008.10.009. - DOI - PubMed
    1. Weil C., Lefèvre F., Bugeon J. Characteristics and metabolism of different adipose tissues in fish. Rev. Fish Biol. Fish. 2013;23:157–173. doi: 10.1007/s11160-012-9288-0. - DOI
    1. Bou M., Todorcevic M., Torgersen J., Skugor S., Navarro I., Ruyter B. De novo lipogenesis in Atlantic salmon adipocytes. Biochim. Biophys. Acta. 2016;1860:86–96. doi: 10.1016/j.bbagen.2015.10.022. - DOI - PubMed