

ATN classification and clinical progression in subjective cognitive decline: The SCIENCe project
- PMID: 32522798
- PMCID: PMC7371376
- DOI: 10.1212/WNL.0000000000009724
ATN classification and clinical progression in subjective cognitive decline: The SCIENCe project
Abstract
Objective: To investigate the relationship between the ATN classification system (amyloid, tau, neurodegeneration) and risk of dementia and cognitive decline in individuals with subjective cognitive decline (SCD).
Methods: We classified 693 participants with SCD (60 ± 9 years, 41% women, Mini-Mental State Examination score 28 ± 2) from the Amsterdam Dementia Cohort and Subjective Cognitive Impairment Cohort (SCIENCe) project according to the ATN model, as determined by amyloid PET or CSF β-amyloid (A), CSF p-tau (T), and MRI-based medial temporal lobe atrophy (N). All underwent extensive neuropsychological assessment. For 342 participants, follow-up was available (3 ± 2 years). As a control population, we included 124 participants without SCD.
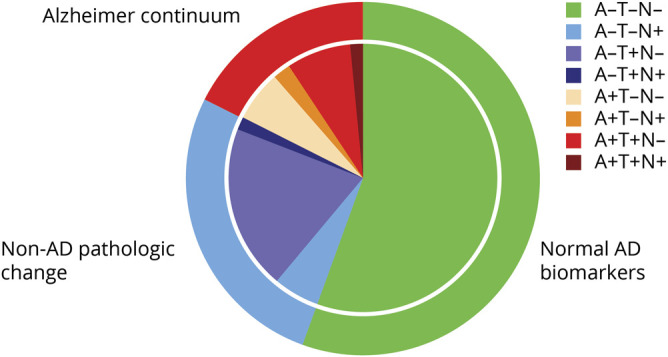
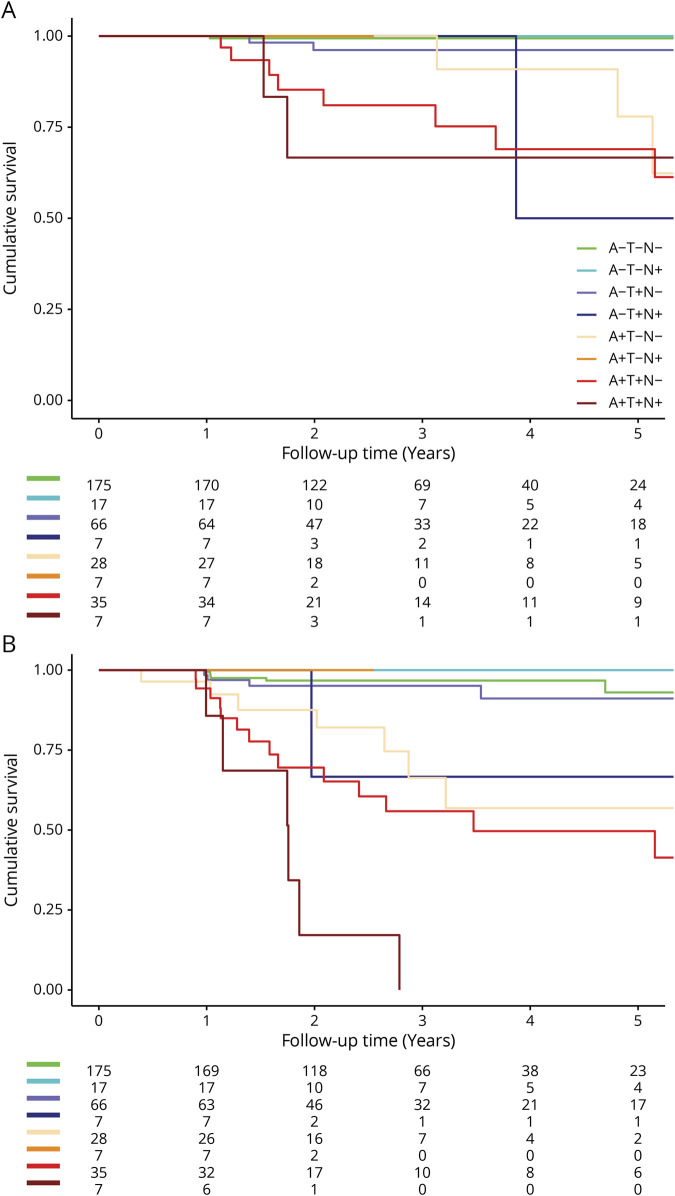
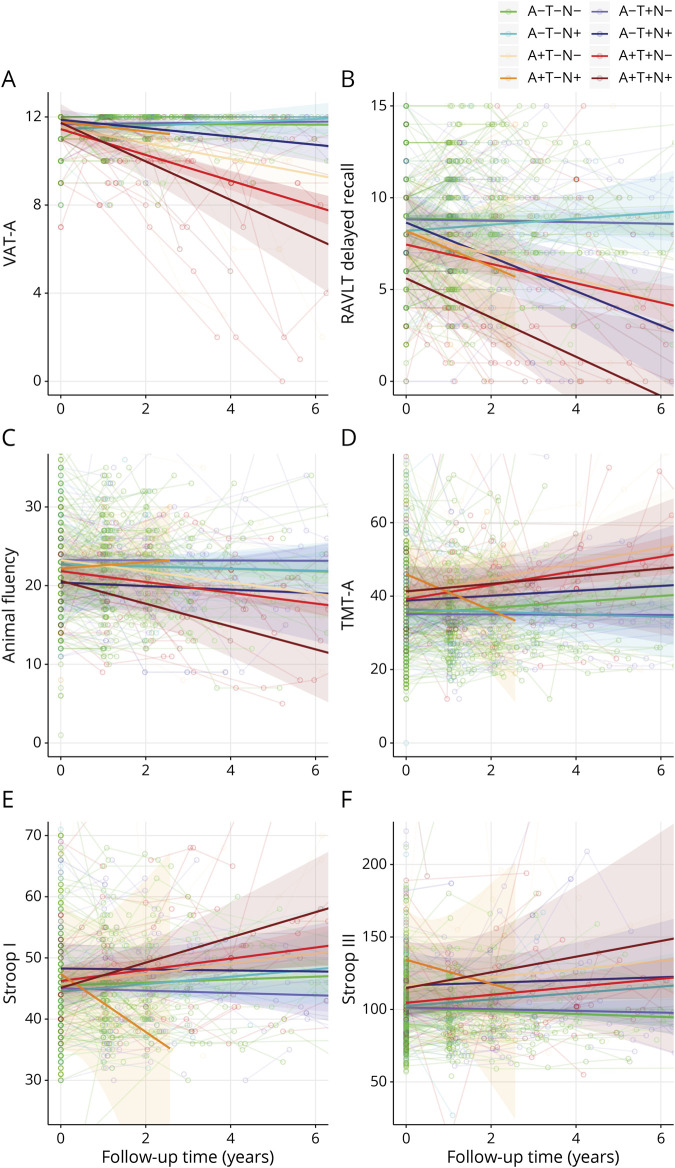
Results: Fifty-six (n = 385) participants had normal Alzheimer disease (AD) biomarkers (A-T-N-), 27% (n = 186) had non-AD pathologic change (A-T-N+, A-T+N-, A-T+N+), 18% (n = 122) fell within the Alzheimer continuum (A+T-N-, A+T-N+, A+T+N-, A+T+N+). ATN profiles were unevenly distributed, with A-T+N+, A+T-N+, and A+T+N+ containing very few participants. Cox regression showed that compared to A-T-N-, participants in A+ profiles had a higher risk of dementia with a dose-response pattern for number of biomarkers affected. Linear mixed models showed participants in A+ profiles showed a steeper decline on tests addressing memory, attention, language, and executive functions. In the control group, there was no association between ATN and cognition.
Conclusions: Among individuals presenting with SCD at a memory clinic, those with a biomarker profile A-T+N+, A+T-N-, A+T+N-, and A+T+N+ were at increased risk of dementia, and showed steeper cognitive decline compared to A-T-N- individuals. These results suggest a future where biomarker results could be used for individualized risk profiling in cognitively normal individuals presenting at a memory clinic.
Copyright © 2020 The Author(s). Published by Wolters Kluwer Health, Inc. on behalf of the American Academy of Neurology.
Figures
References
Publication types
MeSH terms
Substances
LinkOut - more resources
Full Text Sources
Other Literature Sources
Medical
Research Materials