

Atypical processing of tones and phonemes in Rett Syndrome as biomarkers of disease progression
- PMID: 32522978
- PMCID: PMC7287060
- DOI: 10.1038/s41398-020-00877-4
Atypical processing of tones and phonemes in Rett Syndrome as biomarkers of disease progression
Abstract
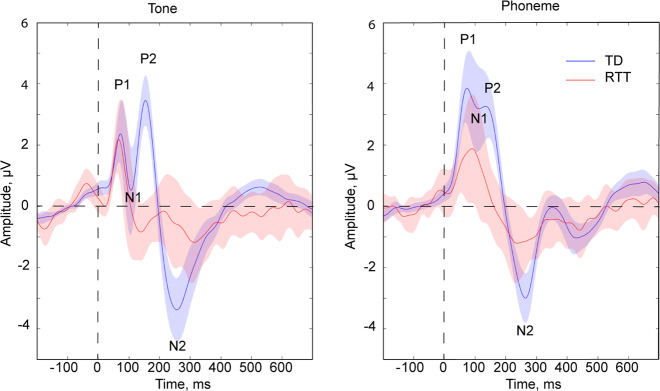
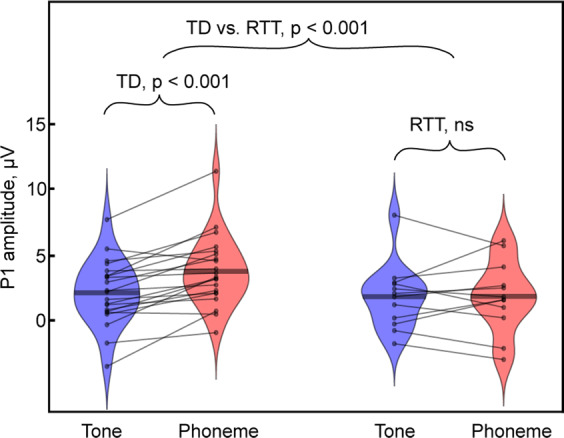
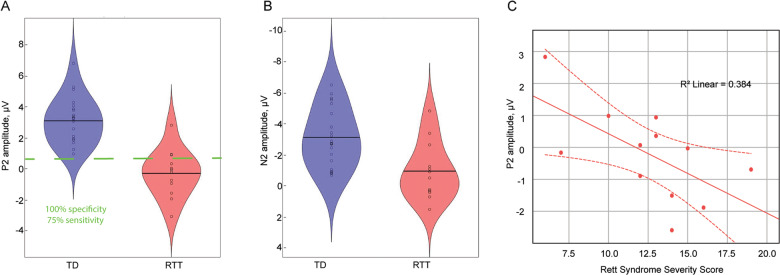
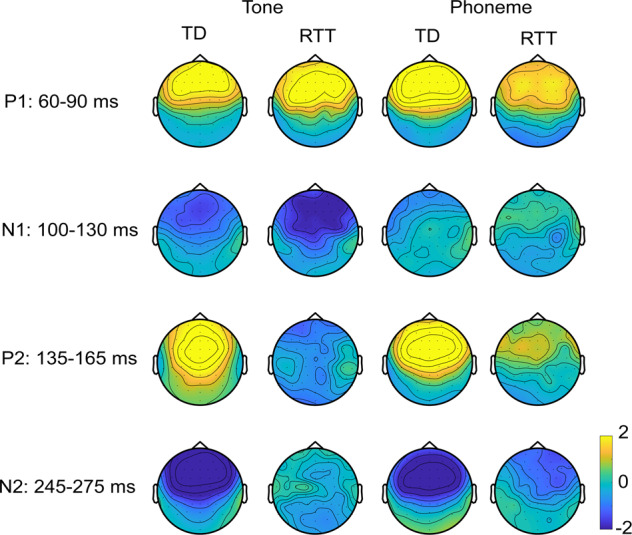
Due to severe motor impairments and the lack of expressive language abilities seen in most patients with Rett Syndrome (RTT), it has proven extremely difficult to obtain accurate measures of auditory processing capabilities in this population. Here, we examined early auditory cortical processing of pure tones and more complex phonemes in females with Rett Syndrome (RTT), by recording high-density auditory evoked potentials (AEP), which allow for objective evaluation of the timing and severity of processing deficits along the auditory processing hierarchy. We compared AEPs of 12 females with RTT to those of 21 typically developing (TD) peers aged 4-21 years, interrogating the first four major components of the AEP (P1: 60-90 ms; N1: 100-130 ms; P2: 135-165 ms; and N2: 245-275 ms). Atypicalities were evident in RTT at the initial stage of processing. Whereas the P1 showed increased amplitude to phonemic inputs relative to tones in TD participants, this modulation by stimulus complexity was absent in RTT. Interestingly, the subsequent N1 did not differ between groups, whereas the following P2 was hugely diminished in RTT, regardless of stimulus complexity. The N2 was similarly smaller in RTT and did not differ as a function of stimulus type. The P2 effect was remarkably robust in differentiating between groups with near perfect separation between the two groups despite the wide age range of our samples. Given this robustness, along with the observation that P2 amplitude was significantly associated with RTT symptom severity, the P2 has the potential to serve as a monitoring, treatment response, or even surrogate endpoint biomarker. Compellingly, the reduction of P2 in patients with RTT mimics findings in animal models of RTT, providing a translational bridge between pre-clinical and human research.
Conflict of interest statement
The authors declare that they have no conflict of interest.
Figures
References
-
- Amir RE, et al. Rett syndrome is caused by mutations in X-linked MECP2, encoding methyl-CpG-binding protein 2. Nat. Genet. 1999;23:185–188. - PubMed
-
- Laurvick CL, et al. Rett syndrome in Australia: a review of the epidemiology. J. Pediatrics. 2006;148:347–352. - PubMed
-
- Hagberg B, Aicardi J, Dias K, Ramos O. A progressive syndrome of autism, dementia, ataxia, and loss of purposeful hand use in girls: Rett’s syndrome: report of 35 cases. Ann. Neurol. 1983;14:471–479. - PubMed
-
- Stach BA, Stoner WR, Smith SL, Jerger JF. Auditory evoked potentials in Rett syndrome. J. Am. Acad. Audiol. 1994;5:226–230. - PubMed
Publication types
MeSH terms
Substances
Grants and funding
LinkOut - more resources
Full Text Sources
Medical
