. 2020 Jun 10;11(1):2919.
doi: 10.1038/s41467-020-16695-7.

Spt6 is a maintenance factor for centromeric CENP-A

Affiliations

Spt6 is a maintenance factor for centromeric CENP-A

Georg O M Bobkov et al. Nat Commun. .

Abstract

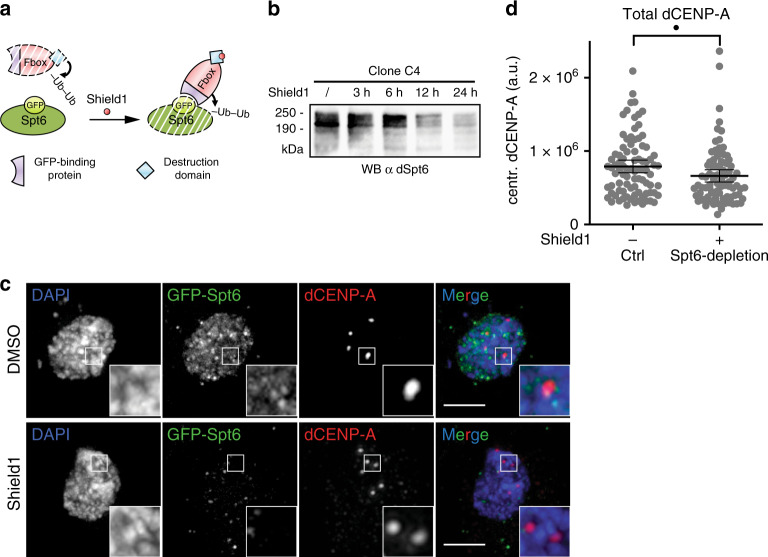
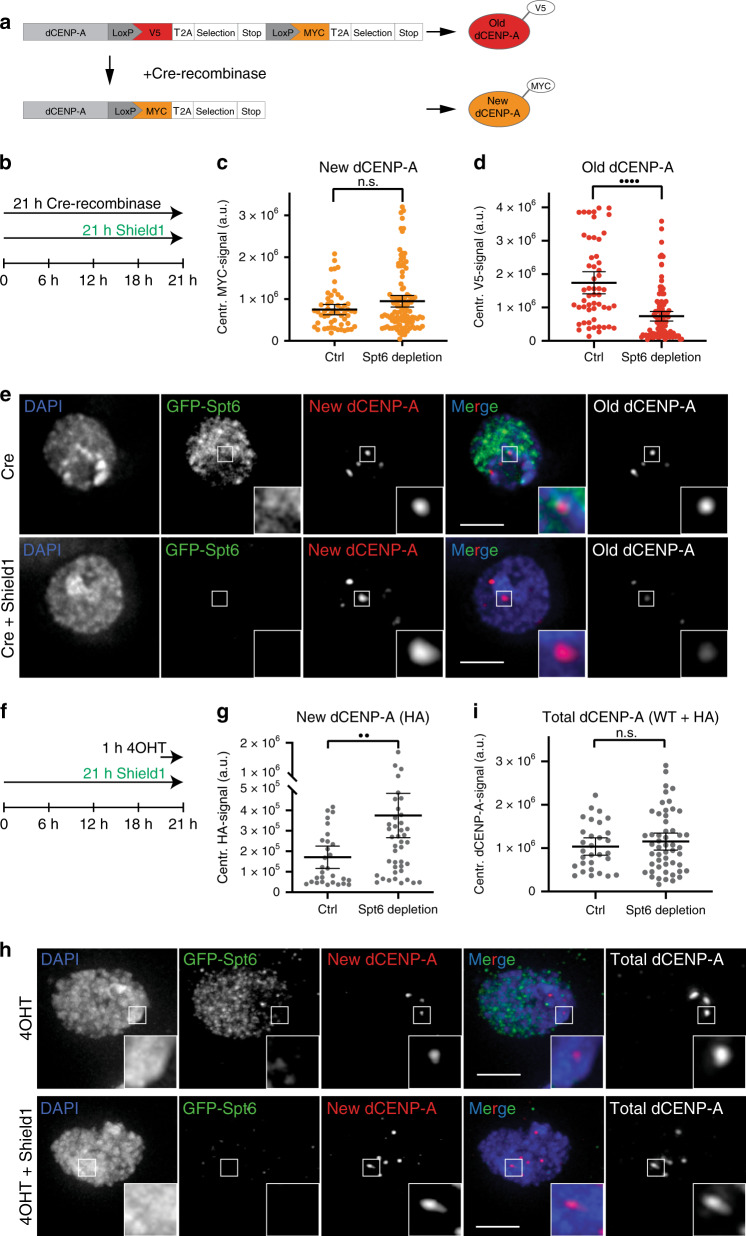
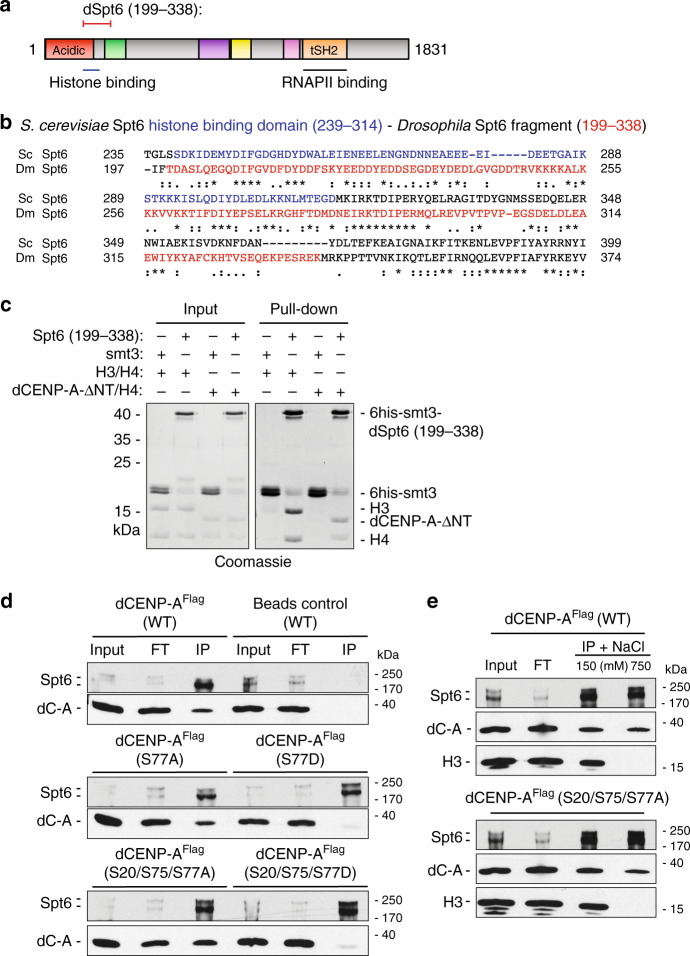
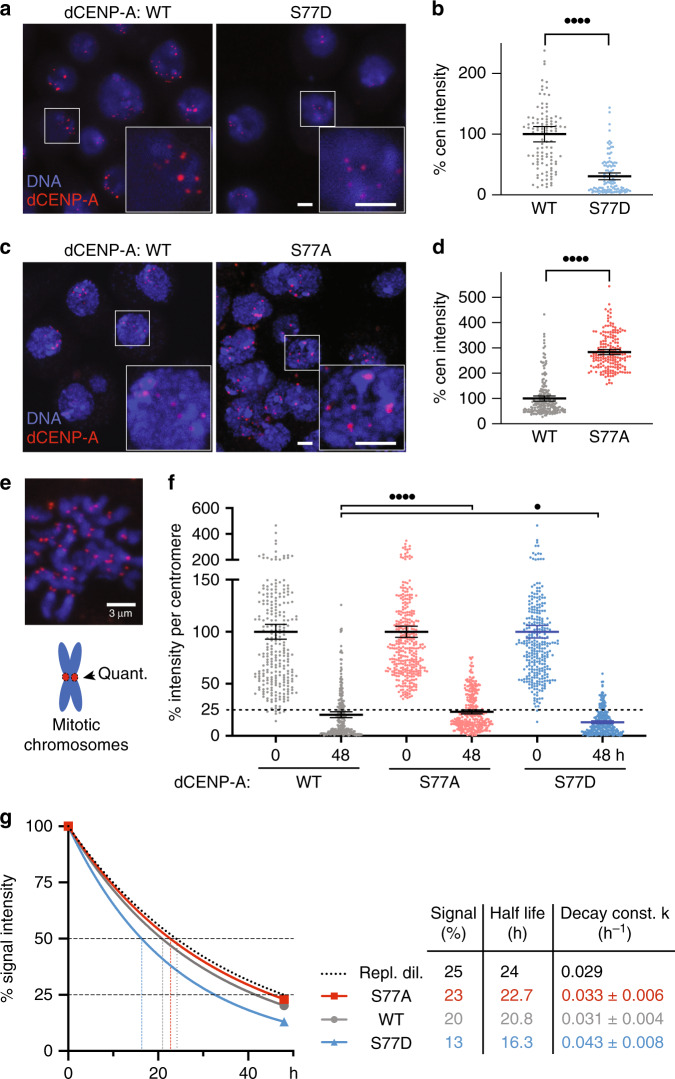
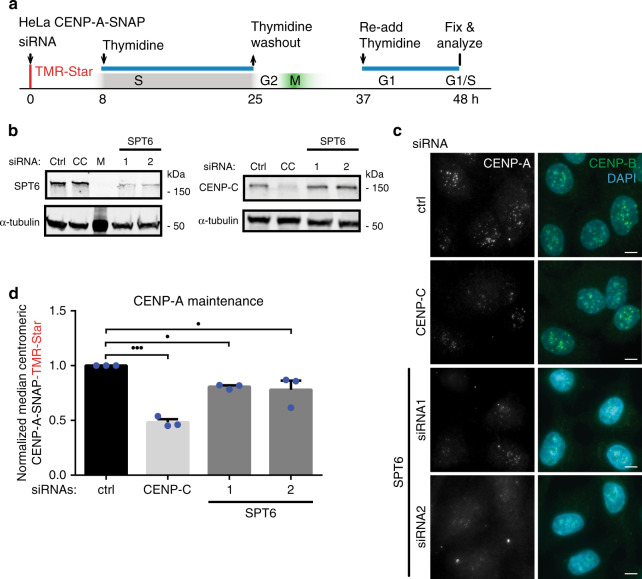
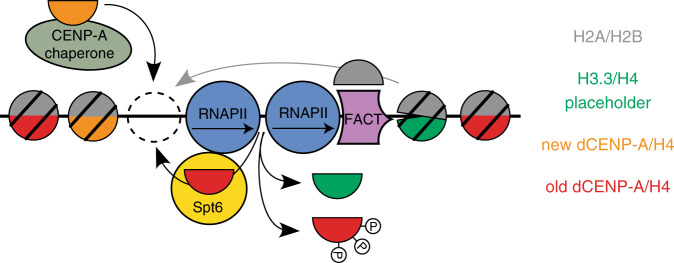
Replication and transcription of genomic DNA requires partial disassembly of nucleosomes to allow progression of polymerases. This presents both an opportunity to remodel the underlying chromatin and a danger of losing epigenetic information. Centromeric transcription is required for stable incorporation of the centromere-specific histone dCENP-A in M/G1 phase, which depends on the eviction of previously deposited H3/H3.3-placeholder nucleosomes. Here we demonstrate that the histone chaperone and transcription elongation factor Spt6 spatially and temporarily coincides with centromeric transcription and prevents the loss of old CENP-A nucleosomes in both Drosophila and human cells. Spt6 binds directly to dCENP-A and dCENP-A mutants carrying phosphomimetic residues alleviate this association. Retention of phosphomimetic dCENP-A mutants is reduced relative to wildtype, while non-phosphorylatable dCENP-A retention is increased and accumulates at the centromere. We conclude that Spt6 acts as a conserved CENP-A maintenance factor that ensures long-term stability of epigenetic centromere identity during transcription-mediated chromatin remodeling.


Conflict of interest statement

The authors declare no competing interests.

Figures

Fig. 1
Fig. 1. Spt6 localizes to centromeres in mitosis and G1.
a Single optical section of fixed metaphase (upper panel) and interphase (lower panel) cells immunostained for endogenous Spt6 and dCENP-A. N = 3 independent experiments. b Single optical section of fixed metaphase (upper panel) and interphase (lower panel) S2 cells expressing Spt6-GFP. N = 3 independent experiments. dCENP-A immunodetection served as a marker of centromeres. c Analysis of the localization of GFP-tagged Spt6 using life imaging of cells 1 h before (late G2; n = 23 cells) and 1 h after (G1; n = 39 cells) anaphase onset. Movies were taken in a cumulative way. Error bars = standard error of the mean; SEM. Quantification was based on images shown in Supplementary Fig.1a. d Quantification of Spt6 localization in fixed EdU incorporating S-phase cells exemplified in (e). N = 3 independent experiments; n = 93 S-phase cells. Data are represented as mean + standard deviation; SD. e Single optical section of fixed S-phase cell immunostained for Spt6 and dCENP-A. Incorporation of EdU served as a marker for S-phase. Boxes indicate the 3× enlarged inset. Scale bar represents 3 µm. f G1 phase S2 cell with nascent RNA production labeled by click-iT EU and immunostained for Spt6. N = 3 independent experiments. Yellow arrow heads point to centromeric Spt6. Boxes indicate the 3× enlarged inset. Scale bars represent 3 µm. Source data are provided as a Source Data file.
Fig. 2
Fig. 2. Spt6 depletion results in lower levels of total dCENP-A.
a Schematic representation of the Shield1-induceable degradation of GFP-Spt6. b Western blot analysis demonstrating the depletion of GFP-tagged Spt6 following the addition of Shield1. N = 3 independent experiments. c Maximum intensity projection of representative cells for the analysis in (d). Cells treated for 21 h with DMSO (upper panel) or Shield1 (lower panel) are shown. Boxes indicate the 3× enlarged inset. Scale bar represents 3 µm. d Quantification of total centromeric dCENP-A levels in Spt6 WT or depleted cells (17% reduction). N = 4 independent experiments; nWT = 87, ndepl = 85 cells. Data are represented as scatter plots with mean and 95% confidence interval (CI). Statistical significance: single dot P = 0.0157 (unpaired, two-tailed Mann–Whitney test). Source data are provided as a Source Data file.
Fig. 3
Fig. 3. Parental dCENP-A is lost in Spt6-depleted cells.
a Scheme displaying the RITE system used to distinguish old and new protein simultaneously (adapted from Verzijlbergen et al.). b Experimental setup used in (ce). Quantification of the centromeric incorporation of new dCENP-AMYC (c) or remaining levels of old dCENP-AV5 (d) at centromeres under Spt6 depletion conditions (58% reduction). N = 3 independent experiments; nWT = 54, ndepl = 107 cells. Statistical significance: quadruple dots P < 0.0001; n.s. not significant (unpaired, two-tailed Mann–Whitney test). e Maximum intensity projection of representative cells measured in c, d. Cells treated with Cre recombinase (upper panel) or Cre recombinase plus Shield1 (lower panel) are shown. Boxes indicate the 4× enlarged inset. Scale bar represents 3 µm. f Experimental setup used in (gi). g Quantification of new centromeric dCENP-AHA in fixed cells following 4OHT mediated release of TI-dCENP-AHA and depletion of Spt6 through Shield1 treatment. N = 3 independent experiments, nWT = 30, ndepl = 47 cells. Data are represented as scatter plots with mean and 95% CI. h Maximum intensity projection of representative cells measured in g, i. 4OHT treated (upper panel) and 4OHT plus Shield1 treated cells (lower panel) are shown. Boxes indicate the 4× enlarged inset. Scale bar represents 3 µm. i Quantification of total centromeric dCENP-A in fixed cells following 4OHT mediated release of TI-dCENP-AHA and depletion of Spt6 through Shield1 treatment. N = 3 independent experiments, nWT = 30, ndepl = 52 cells. All data plots are represented as scatter plots with mean and 95% CI. Statistical significance: double dots P = 0.0025; n.s. not significant (unpaired, two-tailed Mann–Whitney test). Source data are provided as a Source Data file.
Fig. 4
Fig. 4. dCENP-A binds directly to Spt6 and is affected by mutating phosphoresidues.
a Drosophila Spt6 domain organization based on Pfam: acidic (red), Helix-turn-Helix (green), YqgF/RNaseH-like domain (purple), Helix-hairpin-Helix (yellow), S1 RNA-binding domain (magenta), tandem SH2 (orange). Corresponding histone and RNAPII-binding domains based on S. cerevisiae,. b Alignment of the histone-binding domain of S. cerevisiae Spt6 (residues 239–314; blue) based on McDonald et al. with the bacterially expressed fragment of Drosophila Spt6 (199–338; red). Alignments were performed on Uniprot using the Clustal Omega program. Asterisk indicates fully conserved residues, colon indicates strongly similar residues, and period indicates weakly similar residues. c Pull-down experiments of purified recombinant 6his-smt3-Spt6 (199–338) or 6his-smt3 as a negative control with recombinant H3/H4 or dCENP-A-ΔNT (101–225) are shown on a Coomassie-stained SDS-PAGE. N = 3 independent experiments. d Western blot (α FLAG, α Spt6) showing co-IPs of Spt6 with WT dCENP-AFLAG and dCENP-AFLAG bearing phosphorylation-abolishing (S to A) or phosphomimetic (S to D) mutations at phosphorylation sites S20, S75 and S77. N = 5 independent experiments. WT wildtype, FT flowthrough; IP immunoprecipitate. dC-A dCENP-A. e Western blot (α FLAG, α Spt6, α H3) showing co-IPs of endogenous Spt6 (two bands) with dCENP-AFLAG (top) or dCENP-AFLAG (S20/75/77A) (bottom) and H3 exposed to low (150 mM) and high (750 mM) salt wash conditions. N = 5 independent experiments. Source data are provided as a Source Data file.
Fig. 5
Fig. 5. dCENP-A abundance at the centromere is affected by phosphorylation.
a Stably transfected cells with SNAP-tagged wildtype (WT) or S77D mutant dCENP-A were visualized by staining with TMR Star. Boxes indicate the 2.5 times enlarged inset. b Quantification of centromeric signal intensities of wildtype (n = 196) and S77A CENP-A (n = 182 centromeres). Representative images (a) and quantification (b) of one out of N = 3 independent experiments are shown. c SNAP-tagged wildtype and S77A-mutant dCENP-A staining by TMR Star. d Quantification of centromeric signal intensities of wildtype (n = 110) and S77D CENP-A (n = 112). Representative images (c) and quantification (d) of one out of N = 5 independent experiments. Values are normalized relative to the wildtype mean (set to 100%). Data are represented as scatter plots with mean and 95% CI. Statistical significance: quadruple dots P < 0.0001 (unpaired, two-tailed Mann–Whitney test). e Example image of a mitotic chromosome spread (wildtype) and cartoon illustrating analysis shown in (f). f Quantification of total TMR signal intensities per centromere (representative images shown in Supplementary Fig. 4), nWT 0|48h = 284|251, nS77A 0|48h = 368|305, nS77D 0|48 = 315|261 is shown for one out of N = 3 independent experiments. Mean values for the 0 h time point was set to 100% for each cell line. The dashed line marks 25%, the signal intensity expected for dCENP-A undergoing only replicative dilution after two cell generations (48 h). Data are represented as scatter plots with mean and 95% CI. Statistical significance: quadruple dots P < 0.0001, single dots P = 0.0221 (unpaired, two-tailed Mann–Whitney test). g Non-linear regression curves illustrating the decrease of centromeric CENP-A signal over 48 h. Half-life and decay constant k (± upper and lower 95% CI) were calculated using the one-phase-decay function of Prism 8.4.0. Source data are provided as a Source Data file.
Fig. 6
Fig. 6. Depletion of human SPT6 leads to the loss of CENP-A maintenance.
a Experimental setup. HeLa cells expressing SNAP-tagged CENP-A were treated with TMR-star to detect previously incorporated CENP-A and siRNA-treated to deplete proteins indicated in (b, c). Cells were then synchronized in S phase by a thymidine block and released. Cells were allowed transit through G1 phase and were collected at the next G1/S boundary by re-addition of thymine. b Cells were treated with indicated siRNAs for 48 h and extracts were processed for immunoblotting and probed with indicated antibodies. CC CENP-C, M Marker. N = 3 independent experiments. c Representative images of siRNA-treated cells, 48 h after TMR pulse labeling and mRNA depletion. Cells were counter stained with DAPI and anti-CENP-B antibodies to label DNA and centromeres, respectively. Scale bar represents 10 μm. d Quantification of experiments shown in (a, c). Mean and ± SEM of N = 3 independent experiments is shown normalized to median control siRNA (ctrl). Images are quantified with CrAQ2. nCrtl = 3989, nCC = 4097, nSpt6_1 = 3635, nSpt6_1 = 3559 centromeres. Statistical significance: triple dots PCC = 0.0001, single dots P1 = 0,0374, single dots P2 = 0.019. (One-way ANOVA, Dunnett’s multiple comparisons test). Source data are provided as a Source Data file.
Fig. 7
Fig. 7. Model showing histone dynamics during dCENP-A loading.
Both old CENP-A and placeholder H3 nucleosomes can be evicted during the transcription-induced remodeling of centromeric chromatin. Spt6 functions to retain old CENP-A nucleosomes. Phosphorylation of CENP-A interferes with Spt6-mediated recycling and maintenance.

References

    1. Earnshaw WC, Rothfield N. Identification of a family of human centromere proteins using autoimmune sera from patients with scleroderma. Chromosoma. 1985;91:313–321. - PubMed
    1. Henikoff S, Ahmad K, Platero JS, van Steensel B. Heterochromatic deposition of centromeric histone H3-like proteins. Proc. Natl Acad. Sci. USA. 2000;97:716–721. - PMC - PubMed
    1. Blower MD, Sullivan BA, Karpen GH. Conserved organization of centromeric chromatin in flies and humans. Dev. Cell. 2002;2:319–330. - PMC - PubMed
    1. Ahmad K, Henikoff S. Histone H3 variants specify modes of chromatin assembly. Proc. Natl Acad. Sci. USA. 2002;99:16477–16484. - PMC - PubMed
    1. Jansen LE, Black BE, Foltz DR, Cleveland DW. Propagation of centromeric chromatin requires exit from mitosis. J. Cell Biol. 2007;176:795–805. - PMC - PubMed

Publication types

MeSH terms