. 2020 Jun 10;11(1):2929.
doi: 10.1038/s41467-020-16487-z.

mTADA is a framework for identifying risk genes from de novo mutations in multiple traits

Affiliations

mTADA is a framework for identifying risk genes from de novo mutations in multiple traits

Tan-Hoang Nguyen et al. Nat Commun. .

Abstract

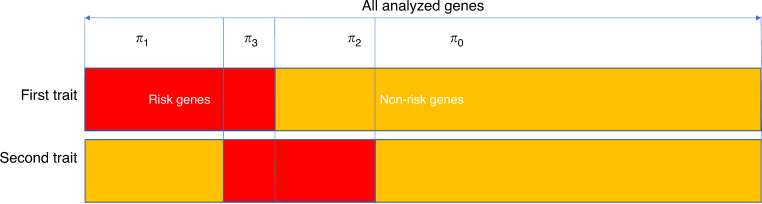
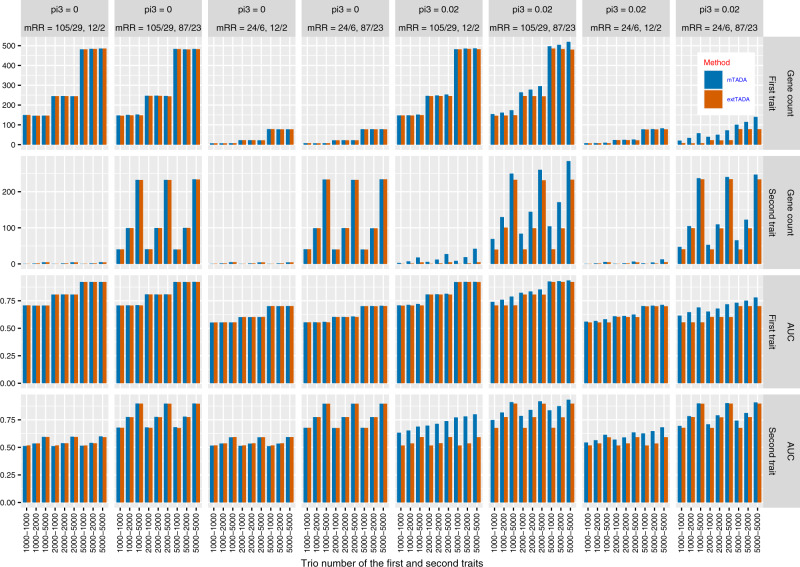
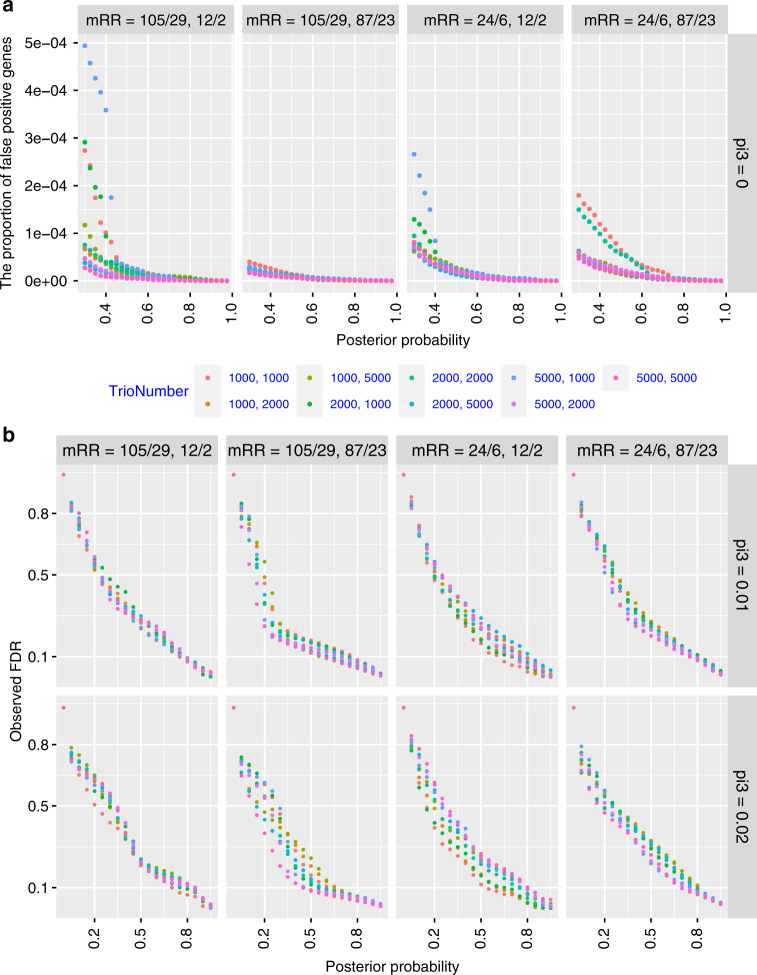
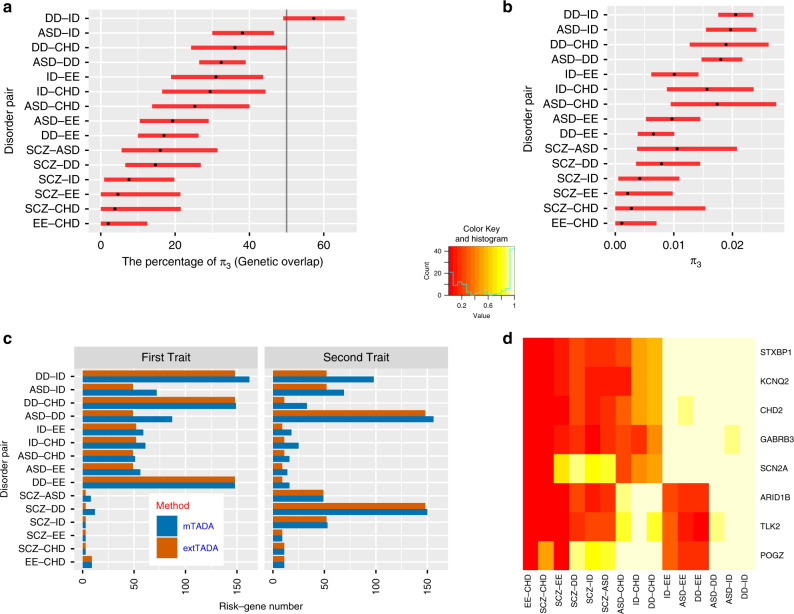
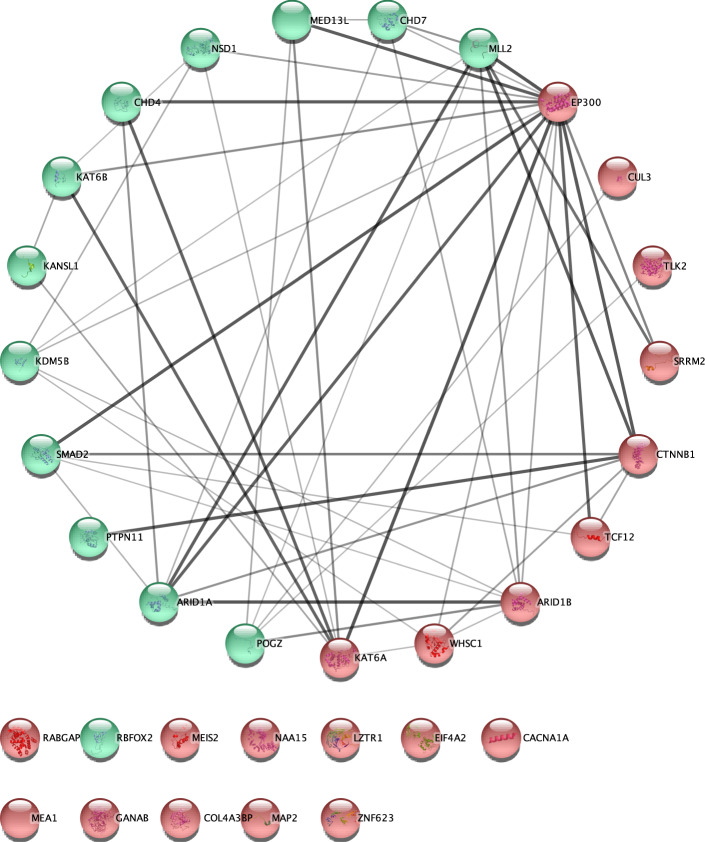
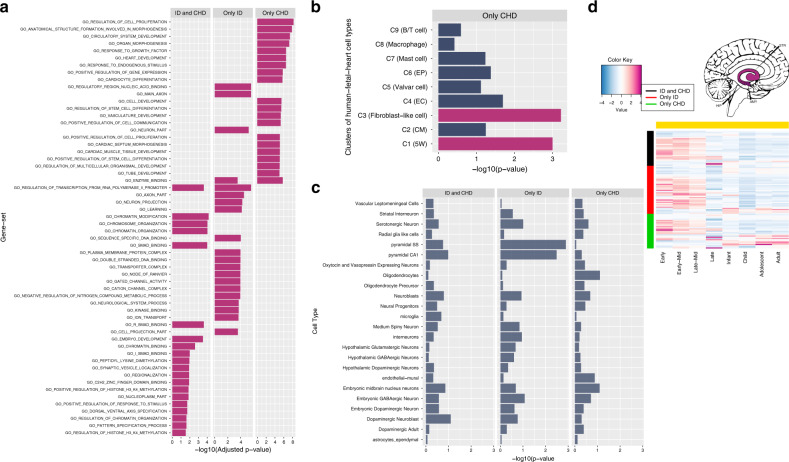
Joint analysis of multiple traits can result in the identification of associations not found through the analysis of each trait in isolation. Studies of neuropsychiatric disorders and congenital heart disease (CHD) which use de novo mutations (DNMs) from parent-offspring trios have reported multiple putatively causal genes. However, a joint analysis method designed to integrate DNMs from multiple studies has yet to be implemented. We here introduce multiple-trait TADA (mTADA) which jointly analyzes two traits using DNMs from non-overlapping family samples. We first demonstrate that mTADA is able to leverage genetic overlaps to increase the statistical power of risk-gene identification. We then apply mTADA to large datasets of >13,000 trios for five neuropsychiatric disorders and CHD. We report additional risk genes for schizophrenia, epileptic encephalopathies and CHD. We outline some shared and specific biological information of intellectual disability and CHD by conducting systems biology analyses of genes prioritized by mTADA.


Conflict of interest statement

P.F.S. reports the following potentially competing financial interests: Lundbeck (advisory committee, grant recipient), Pfizer (Scientific Advisory Board), Element Genomics (consultation fee), and Roche (speaker reimbursement). The remaining authors declare that they have no competing interests.

Figures

Fig. 1
Fig. 1. The multiple trait transmission and de novo association test (mTADA).
For each trait, mTADA divides the all tested genes into two sets: risk and non-risk genes. Therefore, there are four sets when two traits are combined: risk genes for neither of traits (H0), for the first trait only (H1), for the second trait only (H2), and for both traits (H3). Statistical details of four models for these four hypotheses are described in Table 1. πj (j = 0..3) are prior probabilities for the four models. From mTADA’s analysis results, each gene has four posterior probabilities (PPs) of the four models (e.g., PP0, PP1, PP2 and PP3 for Model 0, Model 1, Model 2 and Model 3 respectively).
Fig. 2
Fig. 2. Comparison results of simulated data for the current multi-trait approach (mTADA) and a previous single-trait approach (extTADA) in single-trait analyses.
For each bar, its height shows the average value of 100 simulations. mTADA performs better than extTADA when the proportions of overlapping risk genes (pi3) are larger than zero. The top two lines describe gene counts (posterior probability >0.8, while the two bottom lines show area under the Receiver Operating Characteristic (ROC) curves (AUCs). mRR describes mean relative risks and the trio number along the bottom describes the sample sizes. These results are for two variant categories. For example, “mRR = 105/29, 12/2” describes the mRRs of the first trait as 105 and 29, and the mRRs of the second trait as 12 and 2.
Fig. 3
Fig. 3. Validation of shared risk gene identification using mTADA on simulated data.
a The proportion of false positive genes (per 19,358 analyzed genes): X-axes are posterior probabilities of Model III while Y-axes are the proportions of false positive shared risk genes. b The correlation between posterior probabilities (x-axis) and observed false discovery rates (FDRs, y-axis). These are for the combination of different sample sizes (ntrio) and mean relative risks (mRR).
Fig. 4
Fig. 4. Analysis results of mTADA for pairs of disorders.
a The estimated gene-level genetic overlaps (gOs) of pairs of disorders from Markov Chain Monte Carlo sampling results. Each par shows the credible interval and the black dot is the estimated value. The vertical black line describes g0 = 50%. b The estimated proportion of overlapping risk genes (π3) in the mTADA model. c Comparison of mTADA and extTADA in the prioritization of top genes by using a threshold of posterior probability (PP) > 0.8. In mTADA, the column ‘First trait’ and ‘Second trait’ are inferred by summing the PPs of model 1 and 3 (PP1 + PP3), and model 2 and model 3 (PP2 + PP3) in Fig. 1 respectively. d These genes appear in at least 4 pairs of disorders (PP > 0.8). Cells show the PP values. Y-axis shows gene names and x-axis describes pairs of disorders.
Fig. 5
Fig. 5. Result of protein-protein interaction analysis for genes associated with congenital heart disease (CHD).
These genes were prioritized by using undiagnosed developmental disorders (DD) information. This is the top 33 genes, posterior probabilities > 0.8, identified by mTADA using the data set of Homsy et al.. Novel genes have red background and known genes have green background. Additional information for these genes is in Table 2.
Fig. 6
Fig. 6. The analysis results of shared and specific gene lists for ID and CHD (Only CHD: CHD-specific genes, Only ID: ID-specific genes, ID and CHD: shared genes).
a Top enrichment results of gene-ontology (G0) gene sets. These are the top 20 enriched gene sets of each gene list. All these results have adjusted-p-value < 0.05. b Enrichment results of human single-cell RNA sequencing (scRNAseq) datasets. These cells are from cardiac cells of the human fetal heart. They were clustered into 9 clusters (e.g., C1 to C9). The information of these clusters is in brackets (5W: 5-week hearts, ECs: endothelial cells, CMs: cardiomyocytes, epicardial cells: Eps). Magma-red bars are for results with adjusted p-value < 0.05 c) Enrichment results of mouse scRNAseq expression data. d BrainSpan expression results for the three gene lists. This is for Region 3 as defined by Huckins, et al.34 including hippocampus (HIP), amygdala (AMY), striatum (STR) regions. The package cerebroViz was used to draw brain regions.

References

    1. Solovieff N, Cotsapas C, Lee PH, Purcell SM, Smoller JW. Pleiotropy in complex traits: challenges and strategies. Nat. Rev. Genet. 2013;14:483–495. - PMC - PubMed
    1. Zhernakova A, et al. Meta-analysis of genome-wide association studies in celiac disease and rheumatoid arthritis identifies fourteen non-HLA shared loci. PLoS Genet. 2011;7:e1002004. - PMC - PubMed
    1. Galesloot TE, van Steen K, Kiemeney LA, Janss LL, Vermeulen SH. A comparison of multivariate genome-wide association methods. PLoS ONE. 2014;9:e95923. - PMC - PubMed
    1. Allison DB, et al. Multiple phenotype modeling in gene-mapping studies of quantitative traits: power advantages. Am. J. Hum. Genet. 1998;63:1190–1201. - PMC - PubMed
    1. Pickrell JK, et al. Detection and interpretation of shared genetic influences on 42 human traits. Nat. Genet. 2016;48:709–717. - PMC - PubMed

Publication types

MeSH terms