. 2020 Jun 10;11(1):2943.
doi: 10.1038/s41467-020-16781-w.

Impaired peroxisomal import in Drosophila oenocytes causes cardiac dysfunction by inducing upd3 as a peroxikine

Affiliations

Impaired peroxisomal import in Drosophila oenocytes causes cardiac dysfunction by inducing upd3 as a peroxikine

Kerui Huang et al. Nat Commun. .

Abstract

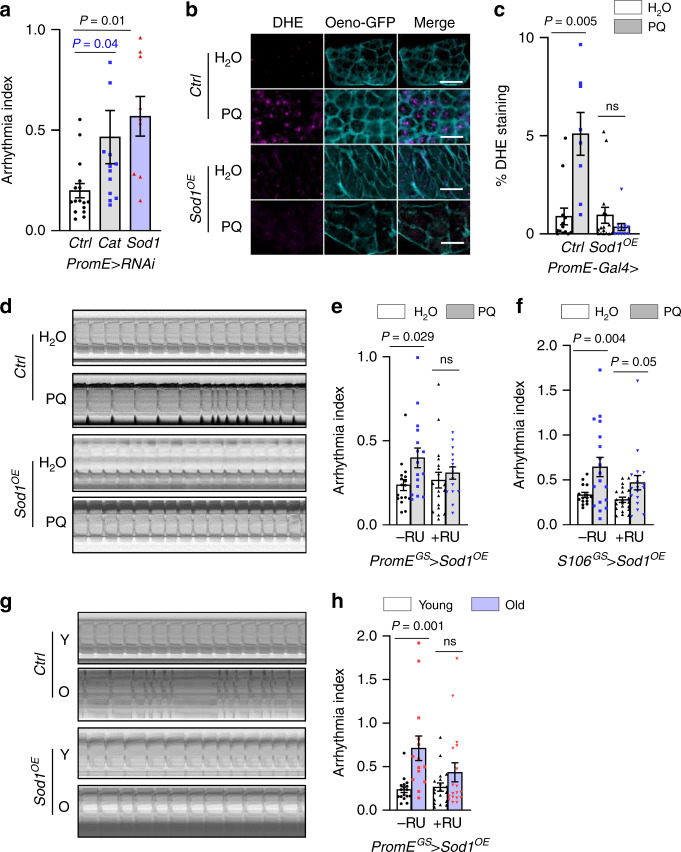
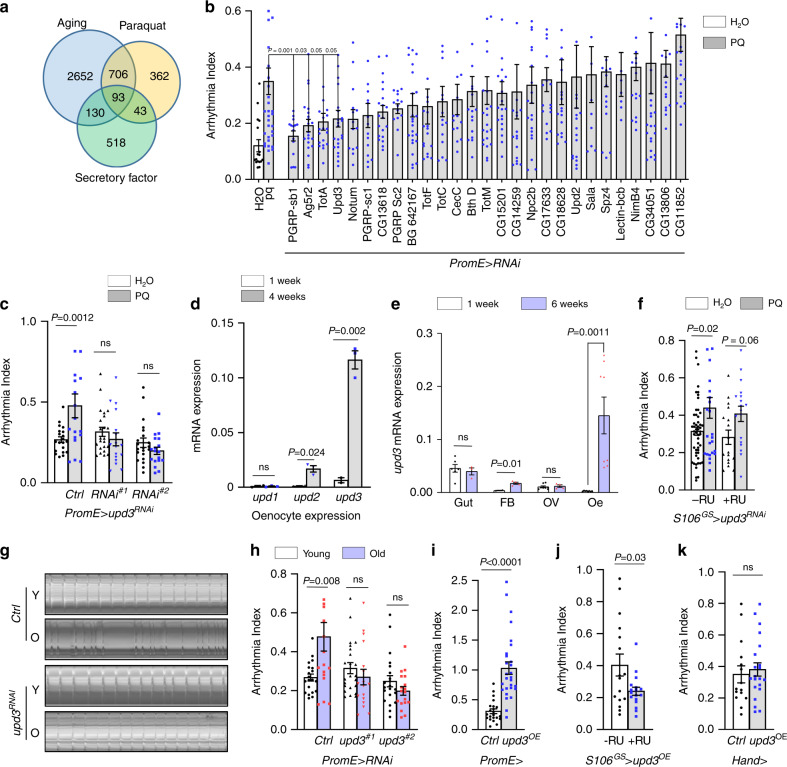
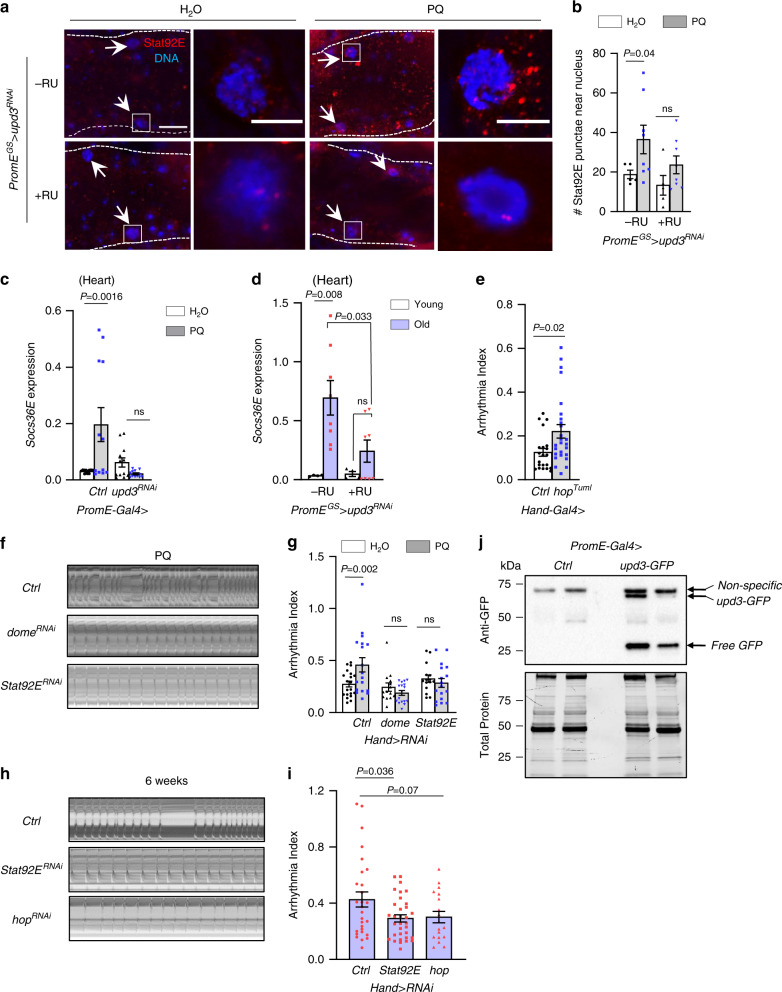
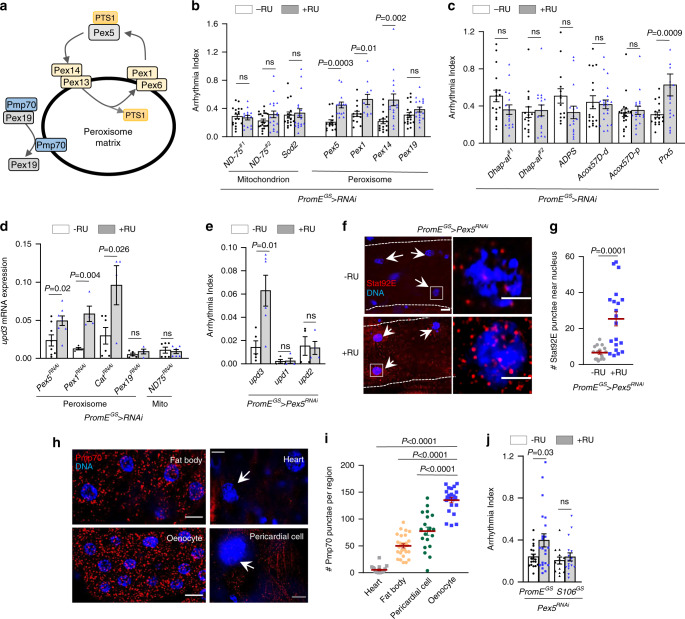
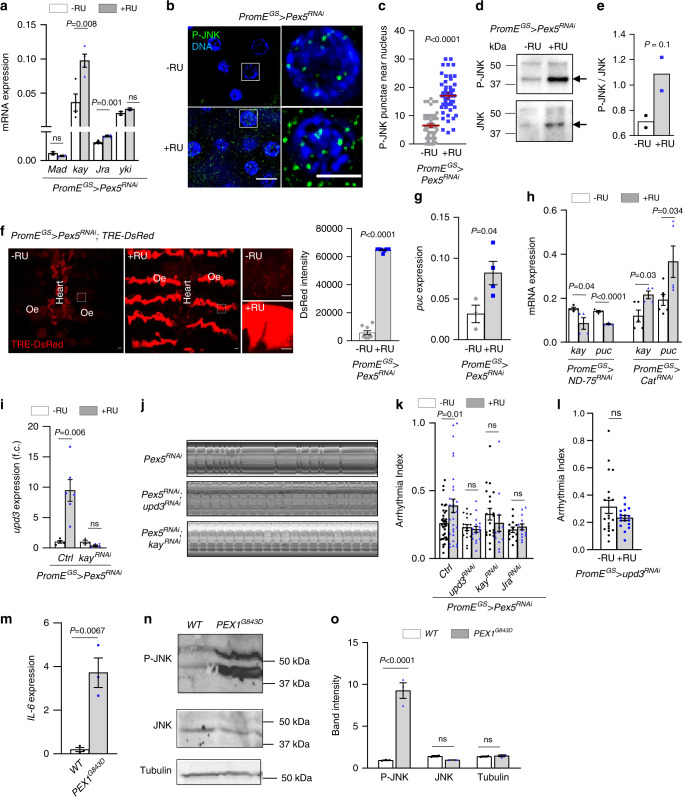
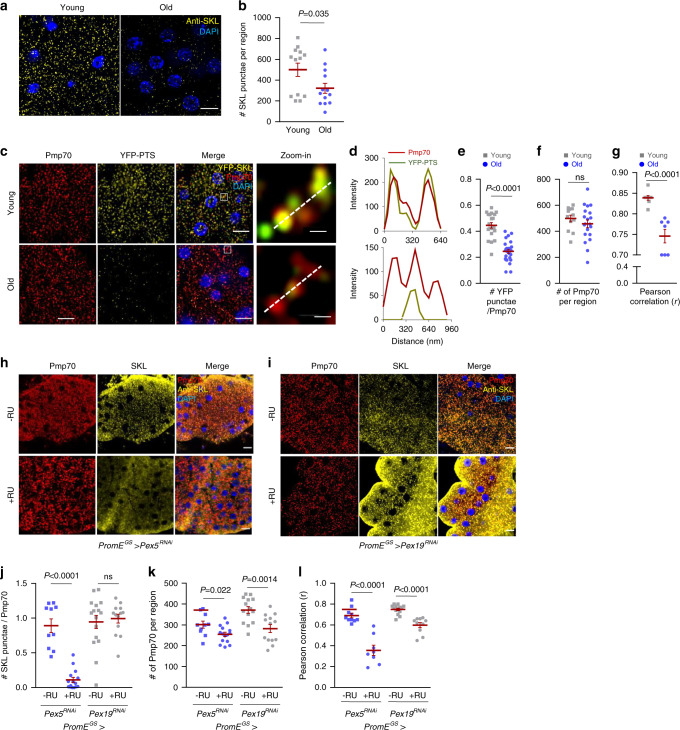
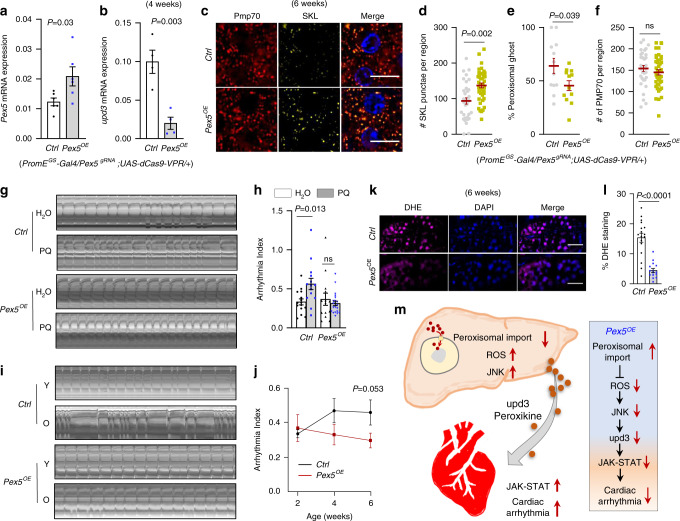
Aging is characterized by a chronic, low-grade inflammation, which is a major risk factor for cardiovascular diseases. It remains poorly understood whether pro-inflammatory factors released from non-cardiac tissues contribute to the non-autonomous regulation of age-related cardiac dysfunction. Here, we report that age-dependent induction of cytokine unpaired 3 (upd3) in Drosophila oenocytes (hepatocyte-like cells) is the primary non-autonomous mechanism for cardiac aging. We show that upd3 is significantly up-regulated in aged oenocytes. Oenocyte-specific knockdown of upd3 is sufficient to block aging-induced cardiac arrhythmia. We further show that the age-dependent induction of upd3 is triggered by impaired peroxisomal import and elevated JNK signaling in aged oenocytes. We term hormonal factors induced by peroxisome dysfunction as peroxikines. Intriguingly, oenocyte-specific overexpression of Pex5, the key peroxisomal import receptor, blocks age-related upd3 induction and alleviates cardiac arrhythmicity. Thus, our studies identify an important role of hepatocyte-specific peroxisomal import in mediating non-autonomous regulation of cardiac aging.


Conflict of interest statement

The authors declare no competing interests.

Figures

Fig. 1
Fig. 1. Oenocyte ROS homeostasis non-autonomously modulates cardiac function.
a Arrhythmia index of oenocyte-specific Cat (n = 9) and Sod1 (n = 13) knockdown flies (1-week-old). Ctrl genotype is PromE>attP40 (n = 16). b Representative images of ROS levels in dissected oenocytes from flies fed on normal diet (white bar) or 10mM paraquat (grey bar). All flies express mCD8::GFP under PromE-Gal4. Sod1 was specifically overexpressed in the oenocytes (Sod1OE). Scale bar: 20 µm. c Quantification of the percentage of DHE-positive staining in region of interest ROIs from 5 flies (nleft-right = 13, 8, 12, 16 ROIs). d Representative M-mode showing heart contraction in control and Sod1 overexpression flies fed on normal or 10mM paraquat food. Sod1 was expressed using the GeneSwitch PromEGS-Gal4 (+RU). Ctrl genotype is PromEGS>Sod1OE with no RU (−RU). e Arrhythmia index of control and oenocyte-specific Sod1 overexpression flies fed on normal or 10 mM paraquat diets (nleft-right = 17, 16, 19, 15 flies). f Arrhythmia index of control and fat body/gut-specific Sod1 (S106-Gal4>Sod1OE) overexpression flies fed on normal or 10 mM paraquat diets. Overexpression specifically in fat body and gut (nleft-right = 15, 18, 21, 17 flies). g Representative M-mode showing heart contraction in young (2 weeks, white bar) and old (6 weeks, purple bar) flies with or without oenocyte-specific Sod1 overexpression. Ctrl genotype is PromEGS>Sod1OE with no RU. h Arrhythmia index of control and oenocyte-specific Sod1OE flies at young and old ages (nleft-right = 17, 19, 14, 18 flies). Data are represented as mean ± SEM. P values are calculated using either two-way ANOVA (c, e, f, h) or one-way ANOVA (a), followed by Holm-sidak multiple comparisons. ns: not significant.
Fig. 2
Fig. 2. Pro-inflammatory upd3 produced from oenocytes mediates arrhythmia.
a Venn diagram showing the number of the predicted secretory proteins that are differentially expressed (≥2-fold, FDR < 0.05) under aging and paraquat treatment. Aging and paraquat RNA-Seq data were from our previous studies. Fly ages: 10-day-old vs. 30-day-old. b Genetic screening on 27 candidate genes for their role in paraquat-induced arrhythmia. WT: Wild-type (attP2 or attP40 RNAi control lines). For statistical numbers, refer to the Methods section. c PQ-induced arrhythmia measured by SOHA for two independent upd3 RNAi lines under oenocyte-specific GeneSwitch driver (PromEGS-Gal4). Ctrl genotype is PromE>attP40. (nleft-right = 20, 18, 23, 17, 22, 18 flies). d Relative mRNA expression of upd1, upd2 and upd3 from isolated oenocytes at ages of 1 week or 4 weeks. N = 3 biologically independent samples. e Relative mRNA expression of upd3 in different tissues dissected from young (1 week) and old (6 weeks) female flies. FB: fat body, OV: ovary, oe: oenocytes. N = 4 biological samples, results pooled from 2 independent experiments. f PQ-induced arrhythmia measured by SOHA for upd3 RNAi under fat body/gut-specific GeneSwitch driver, (nleft-right = 52, 27, 17, 18 flies). g Representative M-mode traces of wild-type and oenocyte-specific upd3 knockdown flies at young and old ages. h Arrhythmia index of wild-type and oenocyte-specific upd3 knockdown flies. Two independent RNAi lines used. Ctrl genotype is PromE>attP40, (nleft-right = 14, 17, 19, 20, 18, 19 flies). i Arrhythmia index for flies with ectopic upd3 expression (UAS-upd3-GFP) specifically in oenocytes. Flies are 1-week-old. Ctrl genotype is PromE>attP40 (nleft-right = 22, 28 flies). j Arrhythmia index of flies overexpressing upd3 in fat body and gut (S106GS-Gal4), nleft-right = 16, 17 flies. k Arrhythmia index of flies overexpressing upd3 in the heart (Hand-Gal4), nleft-right = 16, 21 flies. Data are represented as mean ± SEM. P values are calculated using two-tailed unpaired t-test (ik), one-way ANOVA (b), or two-way ANOVA (cf, h) followed by Holm-Sidak multiple comparisons. ns: not significant.
Fig. 3
Fig. 3. Oenocyte upd3 activates JAK-STAT pathway in cardiomyocytes to induce arrhythmia.
a Representative images of Stat92E immunostaining in the heart of oenocyte-specific upd3 KD ¬(+RU) and control flies (−RU). Flies were treated with normal or paraquat diet for 24 h. Arrows indicate cardiomyocyte nuclei. White boxes indicate the regions shown in the right insets. Scale bar: 20 µm (inset: 5 µm). b Quantification of the Stat92E-positive punctae near cardiomyocyte nucleus. N = 7 flies. Data presented are representative of two independent experiments. c, d QRT-PCR analysis on Socs36E mRNA expression in the heart of control (attP40) and flies with oenocyte-specific upd3 KD under either paraquat treatment or aging. In paraquat treatment (c), 4 independent biological samples are shown, results are pooled from 3 experiments. In aging study (d), flies with two ages (1 week vs 5 weeks) are collected. N = 4 biological samples from 2 independent experiments. e Arrhythmia index of young flies (1-week-old) with heart-specific expression of an activated form of hop (hopTuml) (nleft-right = 21, 26 flies). f Representative M-mode of paraquat-treated wild-type, heart-specific dome and Stat92E RNAi flies. g Arrhythmia Index of paraquat-treated wild-type, heart-specific dome and Stat92E KD flies. Ctrl genotype is Hand>attP40 (nleft-right = 20, 18, 14, 17, 15, 17 flies). h Representative M-mode of heart-specific Stat92E and hop RNAi flies at old ages. i Arrhythmia Index of heart-specific Stat92E and hop RNAi flies at old ages. Ctrl genotype is Hand>attP40. (nleft-right= 28, 33, 18 flies). j Western blot analysis on the hemolymph samples extracted from flies expressing upd3-GFP fusion proteins in oenocytes. Two biological replicates are shown. Total protein loaded onto the Bio-Rad Stain-Free gel was visualized using ChemiDoc MP Imagers after UV activation. Ctrl genotype is PromE>attP40. k Quantification of western blots in j. The data represent the intensity of GFP bands normalized to the total protein. Data are represented as mean ± SEM. P values are calculated using two-tailed unpaired t-test (e, k) or one-way ANOVA (i), or two-way ANOVA (bd, g) followed by Holm-Sidak multiple comparisons. ns: not significant.
Fig. 4
Fig. 4. Impaired peroxisomal import in oenocytes induces upd3 and promotes cardiac arrhythmia.
a Schematic diagram showing the key genes involved in peroxisomal import and membrane assembly. b Arrhythmia index of oenocyte-specific knockdown of mitochondrial complex I subunit ND-75 (two independent RNAi lines), mitochondrial Mn superoxide dismutase Sod2, peroxisomal import factors (Pex5, Pex1, Pex14), and peroxisomal membrane assembly factor (Pex19), (nleft-right = 14, 15, 14, 11, 16, 17, 18, 18 flies). Oenocyte-specific GeneSwitch driver (PromEGS-Gal4) was used. c Arrhythmia index of oenocyte-specific knockdown of peroxisomal matrix enzymes, Dhap-at, ADPS, Acox57D-d, Acox57D-p, Prx5 (nleft-right = 17, 18, 18, 18, 18, 17, 21, 20, 18, 16, 17, 14, 17 flies). d QRT-PCR analysis showing relative mRNA levels of upd3 from dissected oenocytes of Pex5, Pex1, Cat, Pex19 and ND-75 KD flies. Mito: Mitochondrion. N = 4 biological samples from 2 independent experiments. e QRT-PCR analysis showing relative mRNA levels of upd1, upd2, upd3 from dissected oenocytes of oenocyte-specific Pex5 KD flies. N = 3 biological samples, from 2 independent experiments. f Representative images of Stat92E immunostaining of heart tissues dissected from flies with (+RU) or without (−RU) oenocyte-specific Pex5 KD. Arrows indicate cardiomyocyte nuclei. White boxes indicate the regions shown in the right insets. Scale bar: 20 µm (inset: 5 µm). g Quantification on the number of Stat92E punctae around cardiomyocyte nuclei of oenocyte-specific Pex5 KD flies (blue dots). Dot plot shows the quantifications of 6 biological replicates, 3-4 selected regions of interest (ROIs) per replicate. h Representative images of Pmp70 immunostaining in fly tissues. Arrows indicate cardiomyocyte and pericardial cell nuclei. Scale bar: 6.7 µm. i Quantification of Pmp70-positive peroxisomes per region of interest. Dot plot shows the quantifications of 6 biological replicates, 4 ROIs per replicate. j Arrhythmia of flies with Pex5 KD in either oenocytes (PromEGS-Gal4) or fat body/gut (S106GS-Gal4) (nleft-right = 19, 22, 13, 17 flies). Data are represented as mean ± SEM. P values are calculated using two-sided unpaired t-test (g), one-way ANOVA followed (i), or two-way ANOVA (be, j) by Holm-Sidak multiple comparisons. ns: not significant.
Fig. 5
Fig. 5. Pex5 KD-mediated PIS induces upd3 through JNK signaling.
a Expression of Mad, kay, Jra, yki in oenocytes of PromEGS>Pex5RNAi flies, n = 2 biological samples from 2 independent experiments. b P-JNK immunostaining of Pex5 KD oenocytes with (+RU, blue dots) or without (−RU, grey dots). Scale bar: 6.7 µm. c Quantification of b N = 6 biological replicates (8 nuclei per replicate). d Western blots showing the levels of P-JNK and JNK (arrows) in control (−RU) and Pex5 KD (+RU) oenocytes. e Quantification of d N = 2 independent biological samples. f Fluorescence imaging of JNK reporter TRE-DsRed from control (−RU) and oenocyte Pex5 KD (+RU). Scale bar = 20 μm. Quantification is shown on the right. N = 9 flies. g Expression of puc in oenocytes from flies with Pex5 kd oenocyte. N = 4 independent biological samples. h Expression of kay and puc in oenocytes dissected from flies with oenocyte-specific knockdown of ND-75 and Cat. N = 4 independent biological samples. i Expression of upd3 in oenocytes dissected from flies with Pex5 KD or Pex5; kay double KD. N = 4 biological samples. Ctrl genotype is UAS-Pex5RNAi/attP40; PromEGS-Gal4/+. + indicates wild type. j Representative M-mode of flies with oenocyte Pex5 KD, Pex5; upd3 double KD, or Pex5; kay double KD. k Arrhythmia of flies with oenocyte Pex5 KD, or Pex5; upd3 double KD, or Pex5; kay double KD, or Pex5; Jra double KD. Ctrl genotype is the same as i (nleft-right = 34, 30, 16, 17, 20, 16, 20, 13, 13, 14 flies). l Arrhythmia of flies with oenocyte upd3 KD (nleft-right = 20, 17). m Expression of IL-6 in human PEX1-G843D-PTS1 cells. N = 3 independent biological samples. n Western blots showing P-JNK and JNK in wild-type and human PEX1-G843D-PTS1 cells. o Quantification of Panel n. nJNK/tubulin = 2, nPJNK = 3 biological samples. Data are represented as mean ± SEM. P values are calculated using two-sided unpaired t-test (c, eg, l, m), two-way ANOVA followed by Holm-sidak multiple comparisons (a, h, i, k, o) ns: not significant.
Fig. 6
Fig. 6. Peroxisomal import function is disrupted in aged oenocytes.
a Representative images of anti-SKL immunostaining of young and aged wild-type oenocytes. Scale bar: 6.7 µm. b Quantification on the number of SKL-positive punctae in a. Dot plot shows the quantifications of 6 biological replicates, 2 ROIs per replicate. c Representative images to show co-localization of Pmp70 and YFP-PTS in young and aged oenocytes (Scale bar: 6.7 µm). Insets on the right show zoom-in peroxisome structures (the regions indicated by the white boxes in the merged panels, Scale bar: 125 nm). d Line scan analysis to show the fluorescence intensity of Pmp70 (red) and YFP-PTS (green) crossing peroxisomes in the insets (dashed line). e Quantification of the number of YFP-positive punctae normalized Pmp70 in c. N = 6. Dot plot shows the quantifications of 6 biological replicates, 4 ROIs per replicate. f Quantification of the number of Pmp70-positive punctae in c, N = 6 biological replicates, 4 ROIs per replicate. g Pearson correlation quantification measuring the correlation coefficiency of the co-localization between Pmp70 and YFP-PTS in c. N = 6 biological replicates. h Representative images of anti-SKL and anti-Pmp70 immunostaining of PromEGS>Pex5RNAi oenocytes. Scale bar: 6.7 µm. i Representative images of anti-SKL and anti-Pmp70 immunostaining of PromEGS>Pex19RNAi oenocytes. Scale bar: 6.7 µm. j Quantification of the number of SKL-positive punctae normalized Pmp70 in h, i. k Quantification of the number of Pmp70-positive punctae in h, i. l Quantification of Pearson correlation coefficiency of the co-localization between Pmp70 and SKL in hi. 6 biological replicates, 3 ROIs per replicate. Data are represented as mean ± SEM. P values are calculated using two-sided unpaired t-test (b, eg). or two-way ANOVA by Holm-Sidak multiple comparisons (jl), ns: not significant. For specific statistical number, please refer to the source data.
Fig. 7
Fig. 7. Oenocyte-specific Pex5 activation alleviates age-related PIS and preserves cardiac function.
a QRT-PCR analysis showing expression of Pex5 in oenocytes dissected from flies with oenocyte-specific overexpression of Pex5. N = 3 biological samples from 2 independent experiments. b QRT-PCR analysis showing relative mRNA expression of upd3 in 4-week-old oenocytes dissected from flies with oenocyte-specific overexpression of Pex5. N = 4 independent biological samples. c Representative images to show co-localization of anti-Pmp70 and anti-SKL immunostaining in 6-week-old oenocytes dissected from flies with oenocyte-specific overexpression of Pex5 (yellow dots). Scale bar: 6.7 µm. d Quantification of SKL-positive punctae in c. Quantification of the percentage of peroxisomal ghosts (Pmp70-punctae with no SKL signals) per region of interest (166.41 µm2) in c. f Quantification of Pmp70-positive punctae in c. df. Dot plot shows the quantifications of 6 biological replicates, 6 ROIs per replicate. g Representative M-mode of flies with oenocyte-specific Pex5 overexpression under paraquat treatment. h Arrhythmia index of flies with oenocyte-specific Pex5 overexpression under paraquat treatment. (nleft-right = 15,14,14,21 flies). iRepresentative M-mode of flies with oenocyte-specific Pex5 overexpression during normal aging. j Arrhythmia index of flies with oenocyte-specific Pex5 overexpression (red dots) during normal aging (2-week, 4-week and 6-week-old), n0RU,y-o = 35, 15, 15 flies; n200RU,y-o = 9, 15, 18 flies. k DHE staining in 6-week-old oenocytes from flies with oenocyte-specific overexpression of Pex5. Scale bar: 20 µm. l Quantification of the percentage of DHE-positive staining in k. N = 6 flies, 3 ROIs per replicate. Ctrl genotype is PromEGS>Pex5OE with no RU feeding. Data are represented as mean ± SEM. P values are calculated using two-sided unpaired t-test (a, b, df, l, j) or two-way ANOVA, followed by Holm-sidak multiple comparisons (h). m Proposed model to show that impaired hepatic peroxisomal import promotes ROS production, JNK activation, and peroxikine upd3 expression, which non-autonomously controls cardiac JAK-STAT and arrhythmia. Overexpression of endogenous Pex5 preserves cardiac health.

References

    1. Barzilai N, Rennert G. The rationale for delaying aging and the prevention of age-related diseases. Rambam Maimonides Med. J. 2012;3:e0020. - PMC - PubMed
    1. Dai DF, et al. Cardiac aging: from molecular mechanisms to significance in human health and disease. Antioxid. Redox Signal. 2012;16:1492–1526. - PMC - PubMed
    1. Ferrucci L, Fabbri E. Inflammageing: chronic inflammation in ageing, cardiovascular disease, and frailty. Nat. Rev. Cardiol. 2018;15:505–522. - PMC - PubMed
    1. Franceschi C, Campisi J. Chronic inflammation (inflammaging) and its potential contribution to age-associated diseases. J. Gerontol. A. 2014;69(Suppl 1):S4–S9. - PubMed
    1. Fontes JA, Rose NR, Cihakova D. The varying faces of IL-6: From cardiac protection to cardiac failure. Cytokine. 2015;74:62–68. - PMC - PubMed

Publication types

Substances