. 2020 Jun;15(6):491-499.
doi: 10.1038/s41565-020-0679-4. Epub 2020 Jun 10.

Programmable multistage drug delivery to lymph nodes

Affiliations

Programmable multistage drug delivery to lymph nodes

Alex Schudel et al. Nat Nanotechnol. 2020 Jun.

Erratum in

Abstract

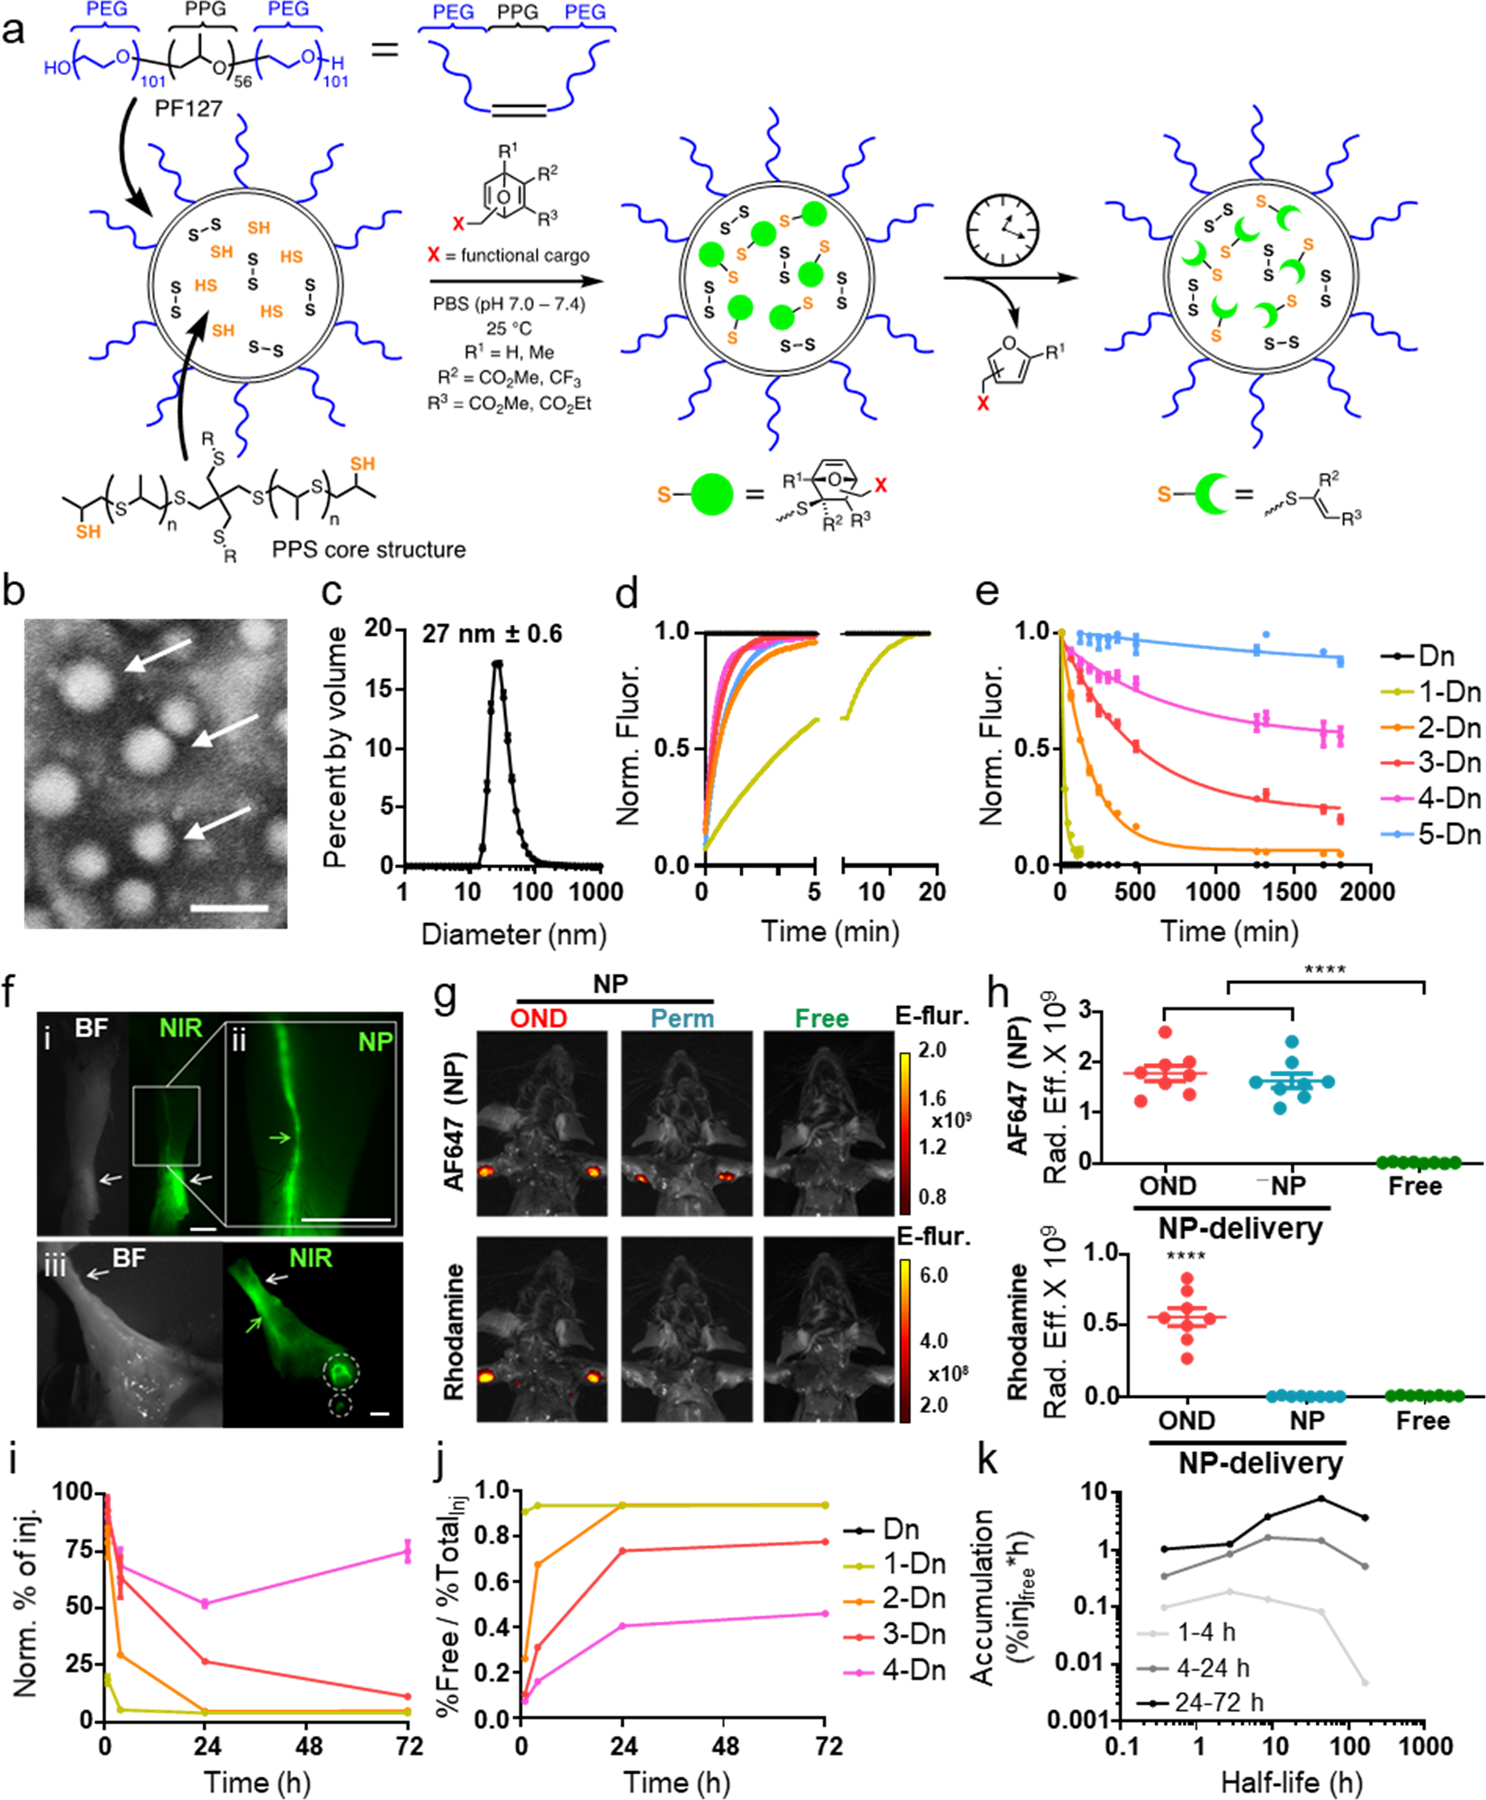
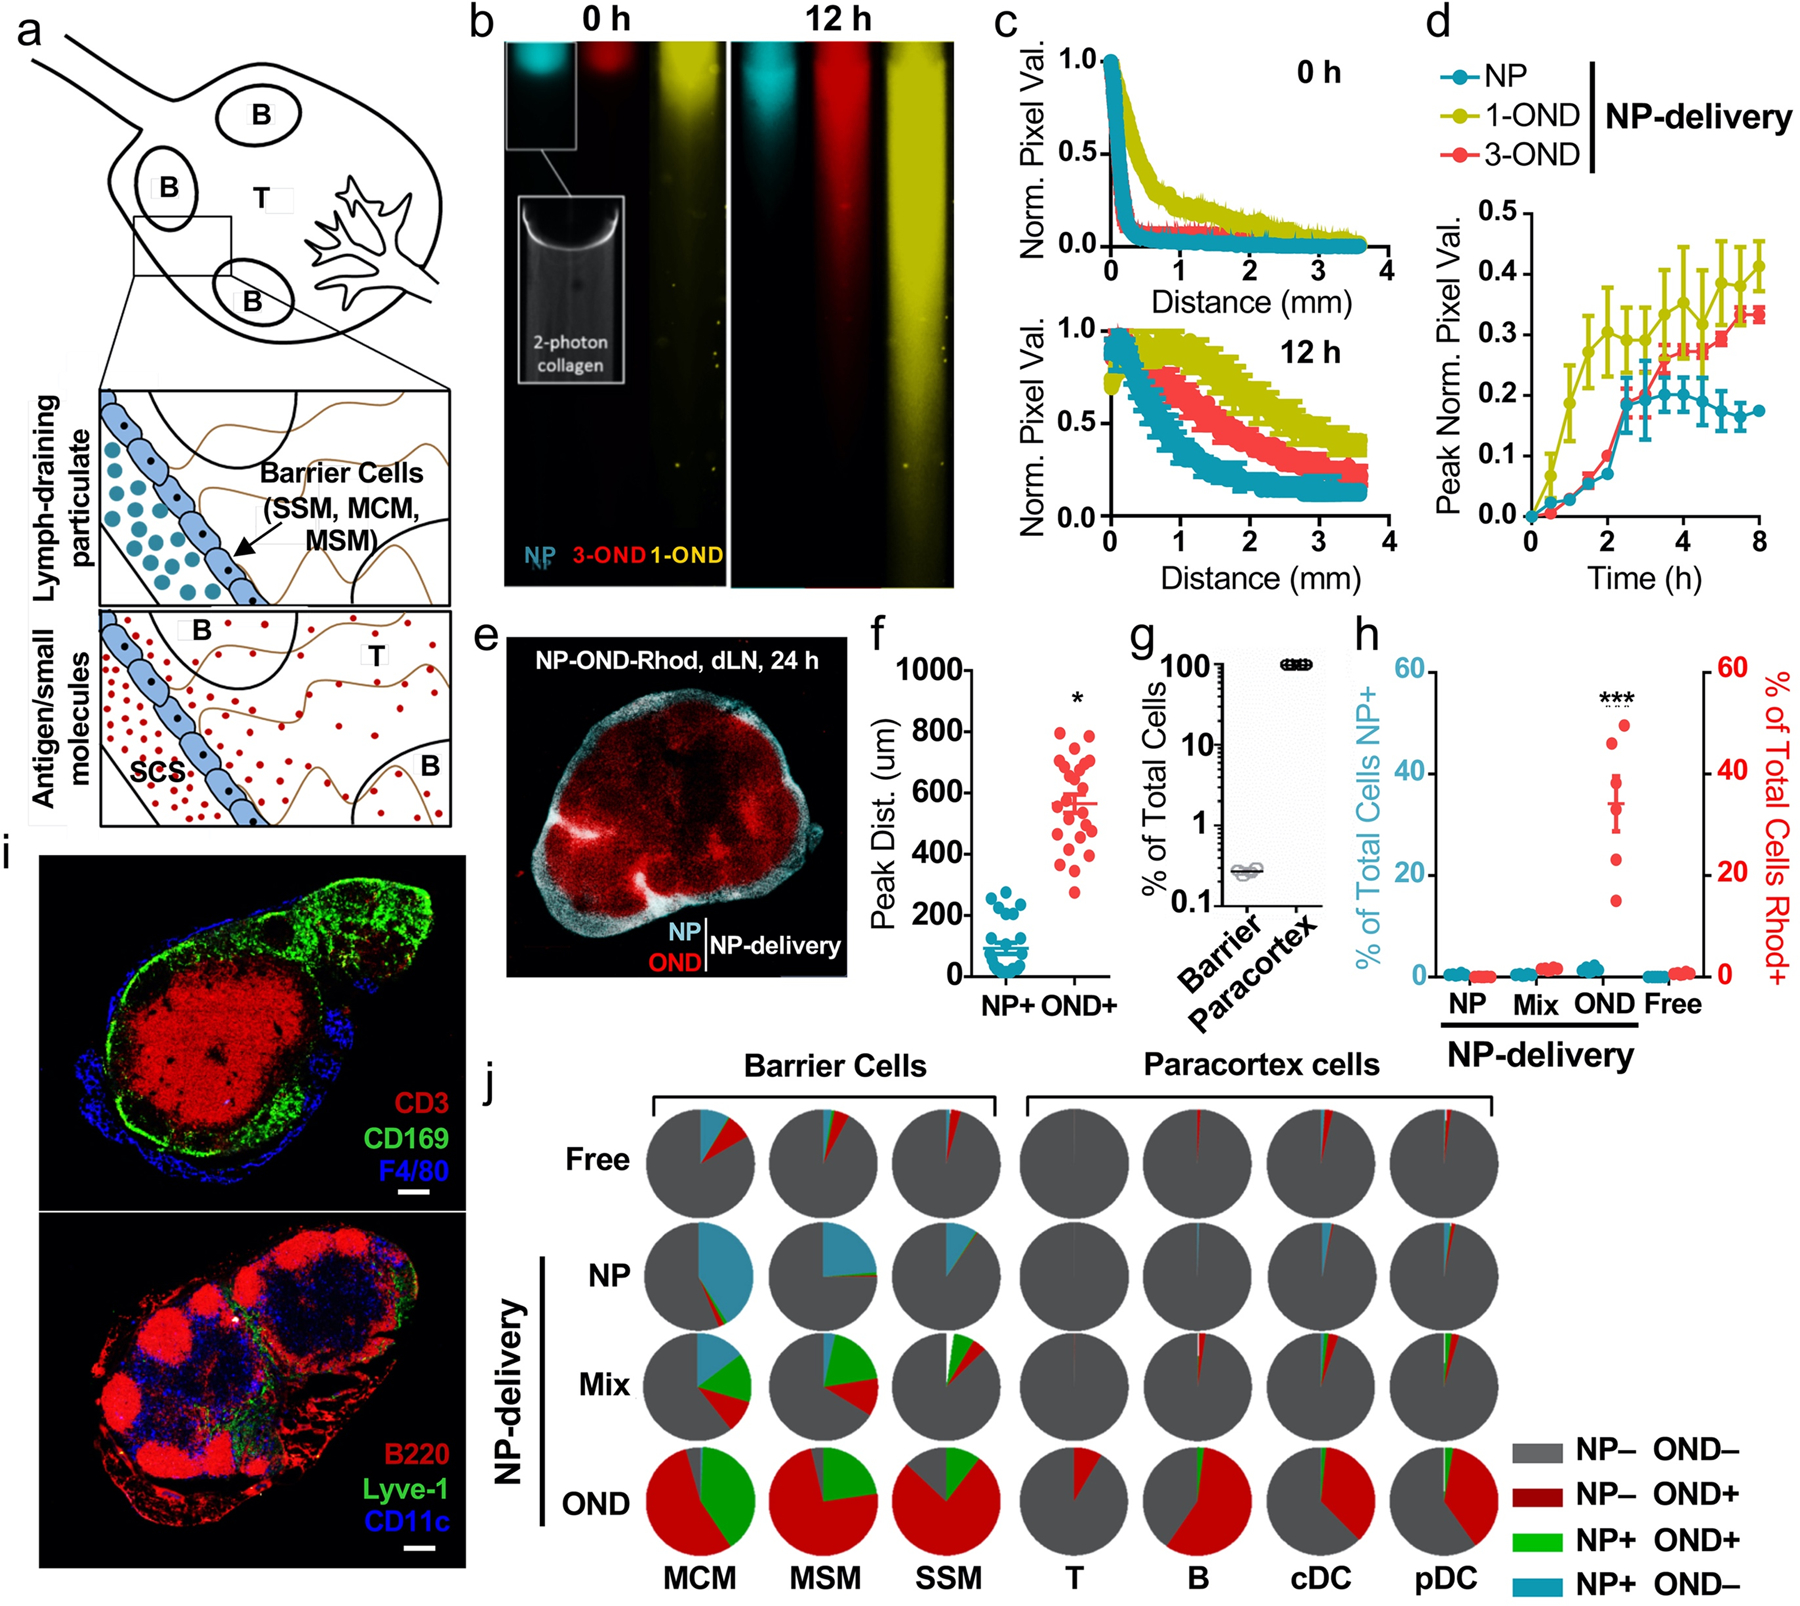
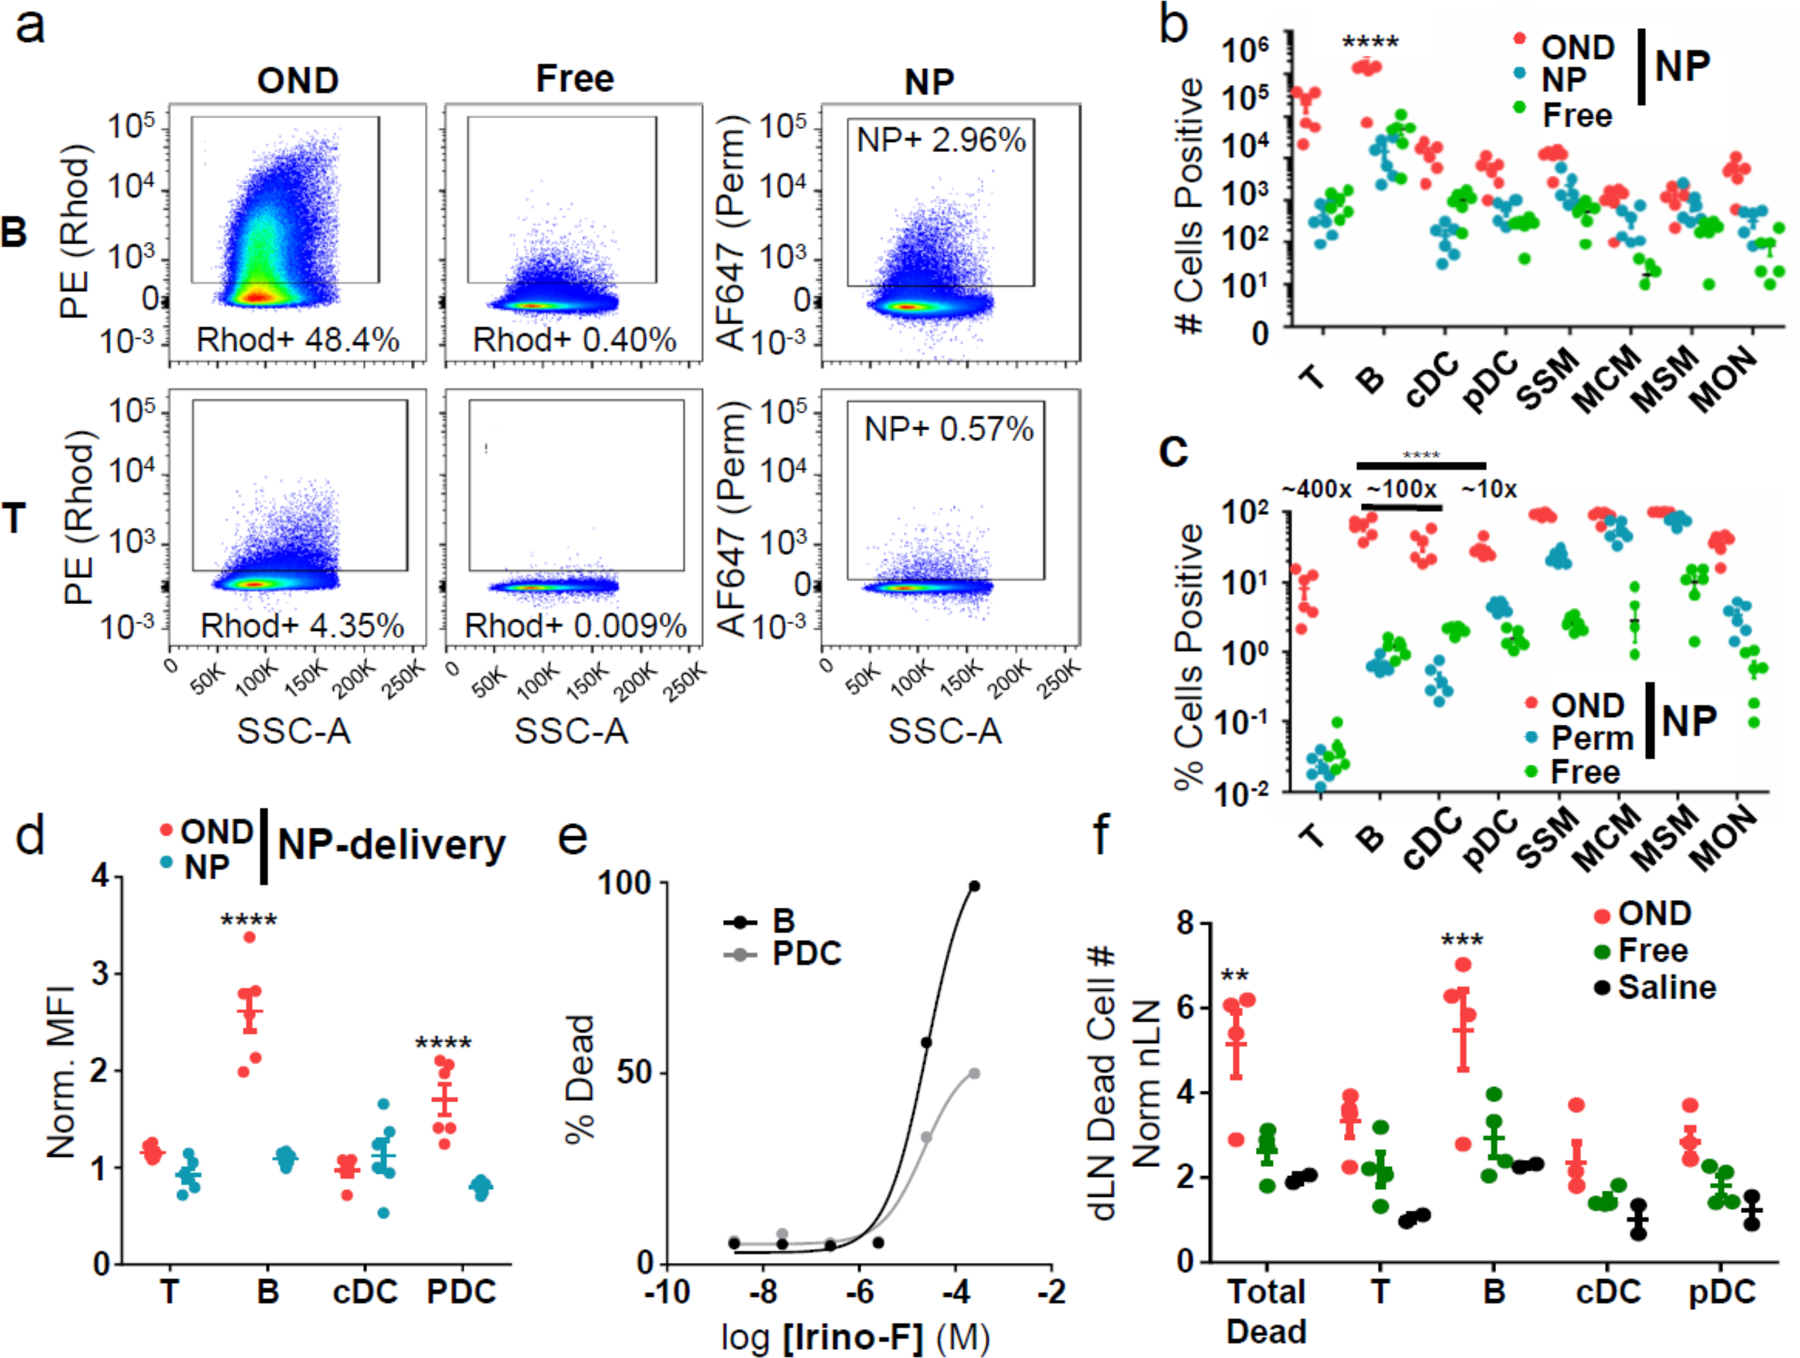
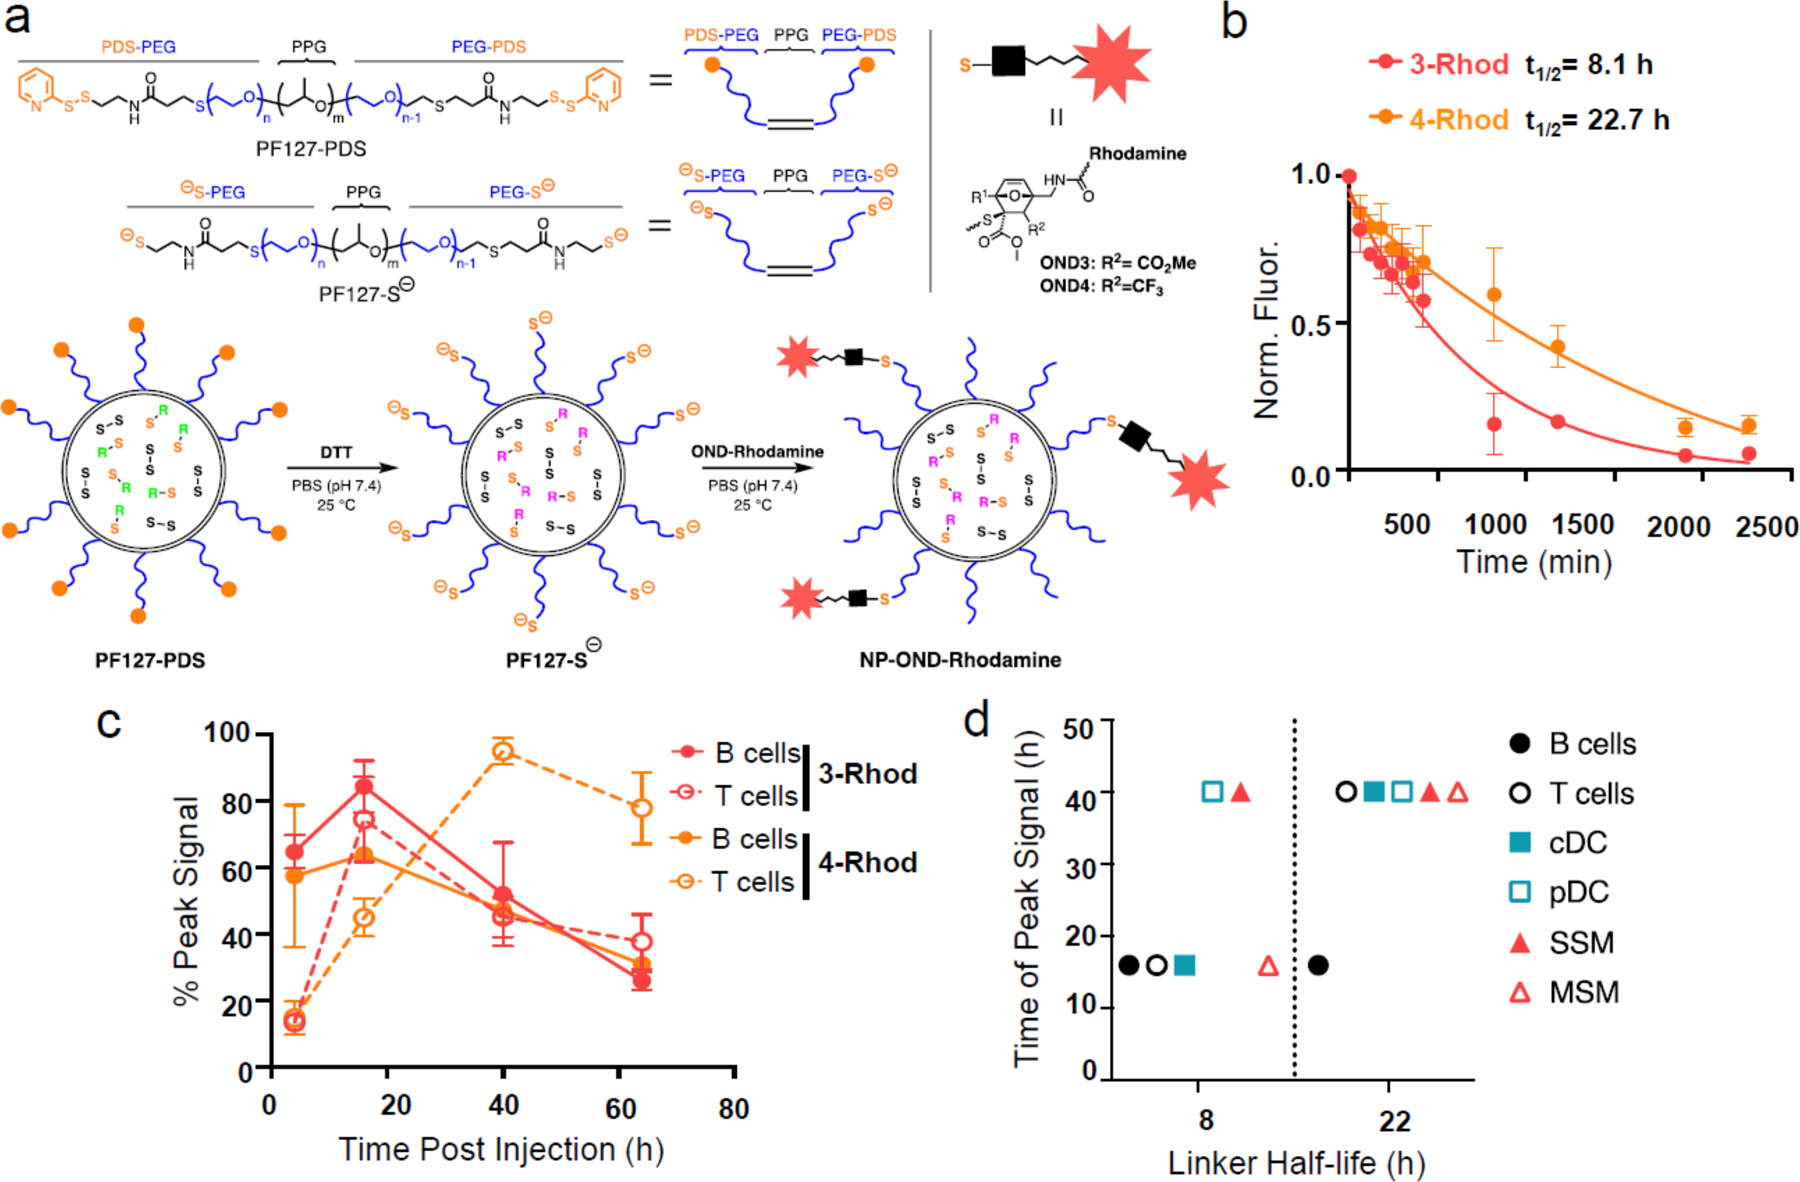
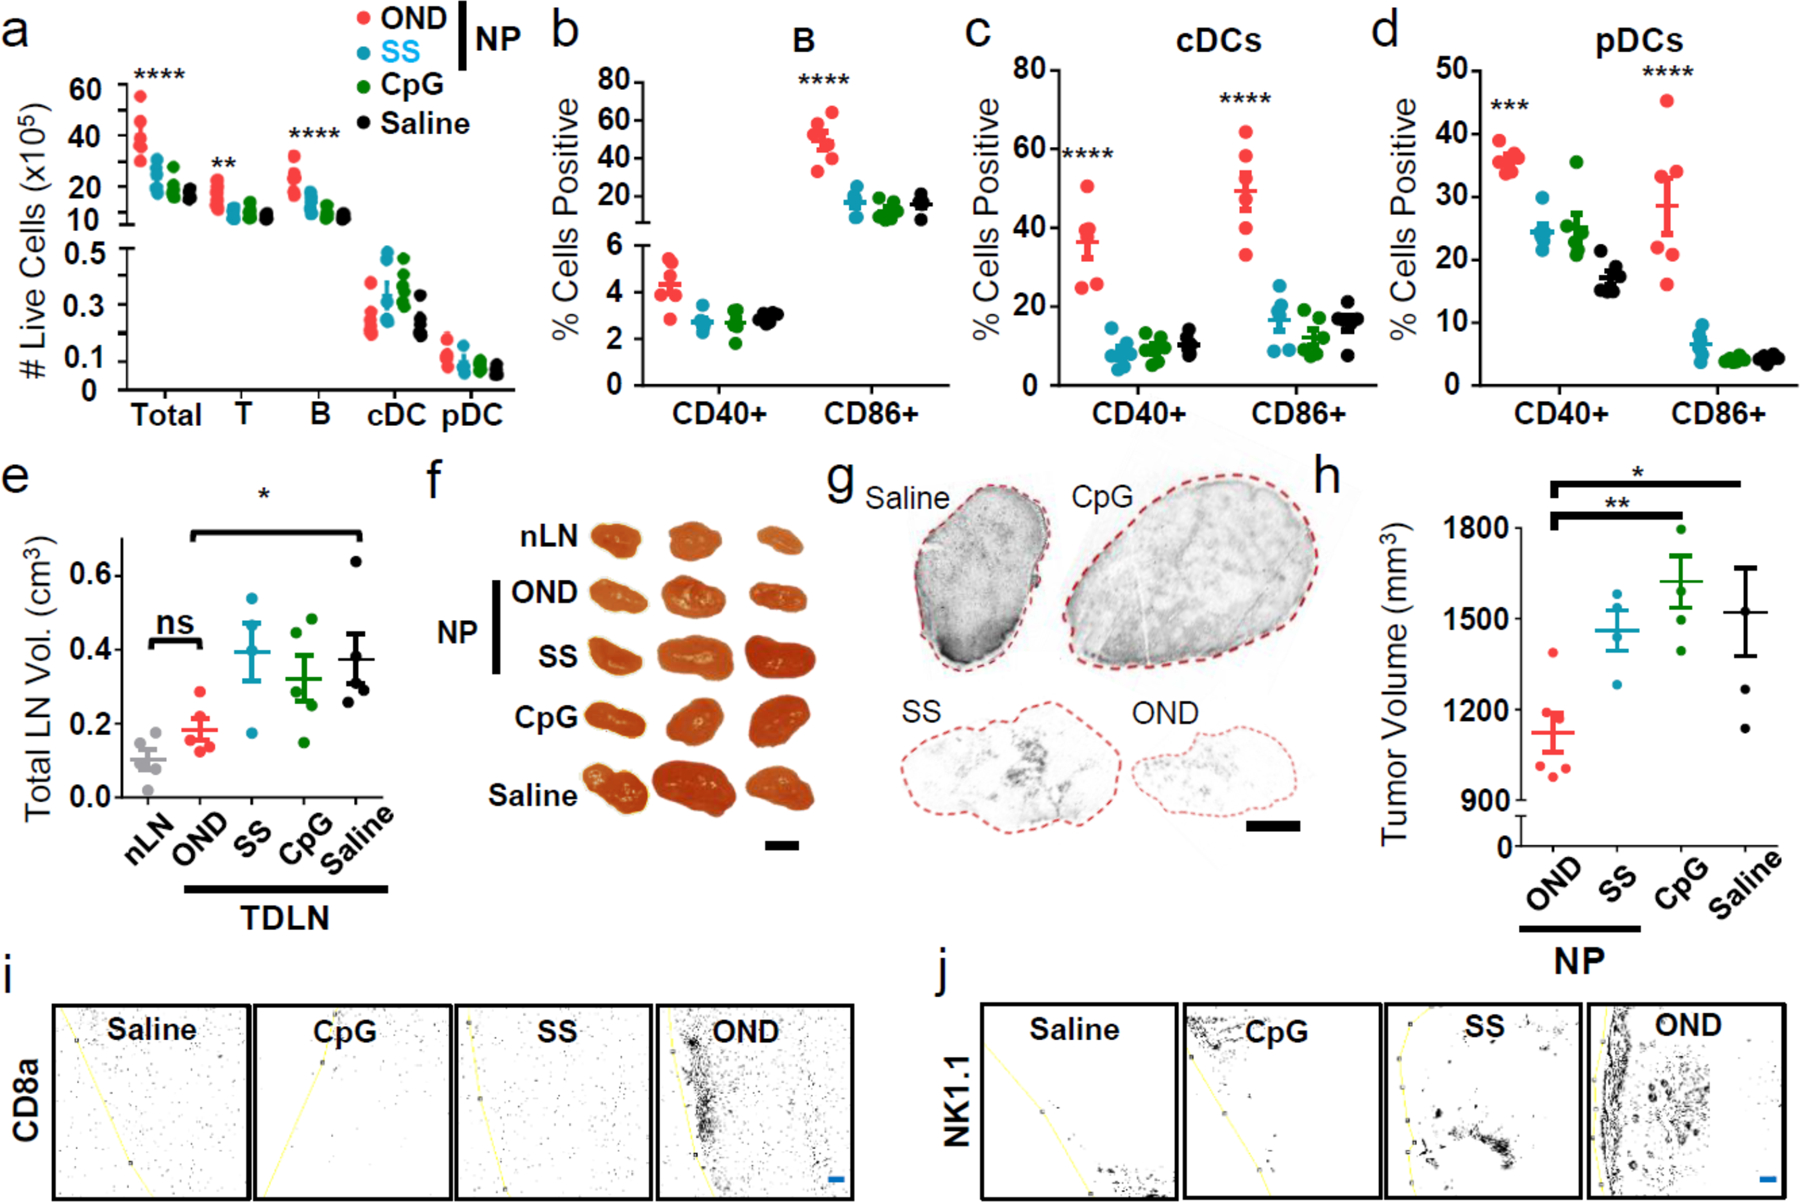
Therapeutic delivery selectively to lymph nodes has the potential to address a variety of unmet clinical needs. However, owing to the unique structure of the lymphatics and the size-restrictive nature of the lymph node reticular network, delivering cargo to specific cells in the lymph node cortex and paracortex is difficult. Here, we describe a delivery system to overcome lymphatic and intra-lymph node transport barriers by combining nanoparticles that are rapidly conveyed to draining lymph nodes after administration in peripheral tissues with programmable degradable linkers. This platform enables the controlled release of intra-lymph-mobile small-molecular cargo, which can reach vastly more immune cells throughout the lymph node than either the particles or free compounds alone. The release rate can be programmed, allowing access to different lymph node structures and therefore specific lymphocyte subpopulations. We are thus able to alter the subtypes of drugged lymph node cells to improve immunotherapeutic effects.


Conflict of interest statement

Financial and Non-Financial Competing Interest Statement

The authors declare no conflict of or cometing interest.

Figures

Extended Data Figure 1.
Extended Data Figure 1.. Compound structures.
OND (1–4 Dn) and epoxyoxanorbornene (5-Dn) electrophiles, model fluorophore (Fluor-Mal, Rhod-Mal, Cy5.5-COOH, 1-Coum, Rhod-F, 3-Rhod, 4-Rhod) and drug cargos (Irino-F, 3-Irino, OND-CpG) presented in this study.
Extended Data Figure 2.
Extended Data Figure 2.. Spatiotemporal effects of NP encapsulation-and-release delivery platform.
a) In vitro extended release of encapsulated Cy5.5 Cargo from NP (teal; half-life = 10.9h) versus free dye (dark blue; half-life = 1.2h). n=6 samples per group. Fraction (b) and percentage of total (c) dLN cells of various types positive for encapsulated Cy5.5 cargo (blue) and AF488-NPs (orange) measured by flow cytometry 6, 12, 24, and 48h after i.d. administration Cy5.5-encapsulating NPs. n=6 biological replicates per group. For all graphs, the columns/points and error bars represent the mean + SEM.
Extended Data Figure 3.
Extended Data Figure 3.. Delivery of OND cargo using virus like particle carriers.
a) Schematic representation of the preparation of VLPs conjugated to 3-Rhod. b) Liquid chromatography time-of-flight mass spectrometry (C3 column) of VLP-OND conjugates. Blue trace represents VLP coat protein associated with AF647-NHS via lysine residues, red trace represents species associated with 3-Rhod. This experiment was repeated once with similar results. c) VLPs covalently labeled with NIR-NHS ester were injected i.d. into mice, followed by organ extraction and IVIS imaging after 6 and 24 h. This experiment was repeated once with similar results. d) dLN size after i.d. injection of VLP. Axial and brachial LN from draining and contralateral (non-draining) sides were photographed and measured using ImageJ. n=6 biological replicates per group. e) Total numbers of AF647 positive and Rhodamine positive dLN cells 24 h after i.d. treatment with VLPs labelled with AF647-NHS (VLP, non-cleavable linker) and 3-Rhod (OND). Saline injected and naïve (uninjected) animals served as Rhodamine channel negative controls. n=6 biological replicates per group. f) Percent of Rhodamine positive cells in dLN 4 h (teal), 6 h (black), 16 h (green), or 24 h (red) after i.d. injection with either VLP (VLP) or pyridyl disulfide PPS NP (PDS) conjugated with 3-Rhod measured by flow cytometry. n=3 biological replicates per group. g) Percent of positive lymphocytes and barrier cells in dLN 6 h (black) or 24 h (red) after i.d. injection of VLP labeled with both Alexa647-NIH (VLP, non-cleavable linker) and 3-Rhod (OND) measured by flow cytometry, normalized to average uptake at 6 h. n=5 biological replicates per group. For all graphs, the columns/points and error bars represent the mean + SEM. Statistics were performed by ordinary one-way ANOVA with Tukey’s multiple comparisons test. ****=p<.0001, ***=p<.005, *=p<.05.
Extended Data Figure 4.
Extended Data Figure 4.. Toxicity of OND derivatives of irinotecan.
a) Log dose testing of 3-Irino (OND), Irino-F (Furan), and unmodified irinotecan against C57Bl6 splenocytes after 24 h in IMDM at 37°C. n=5 samples per group. b) Log IC50 values derived from panel a. c) Effects of cargo delivered to lymph node-resident cells by lymph accessing NP-OND compared to free drug. Number of dead LN cells normalized to saline-treated animals 24 h after i.d. administration of (NP-OND) NPs labeled with 3-Irino (4 mg/kg) or i.p. administration of free Irino-F at the indicated doses. n=5 biological replicates per group. For all graphs, the columns/points and error bars represent the mean + SEM. Statistics were performed by two-way ANOVA with Tukey’s multiple comparisons test. ****=p<.0001, ***=p<.005, *=p<.05 relative to each dose of free Irino-F. For all graphs, the columns/points and error bars represent the mean + SEM.
Figure 1:
Figure 1:. Nanoparticle-OND preparation and properties.
a) Schematic representation of poly(propylene sulfide) (PPS) nanoparticle (NP) preparation, conjugation with OND electrophiles, and retro-Diels-Alder release of furan-tagged cargo. b) Representative TEM image of NPs; scale bar = 100 nm. n=3 independent experiments. c) Overlaid DLS traces of the starting NPs and PDS-NPs (described in Figure 5). n=3 independent experiments. Ave NP size is 27 nm. d) Addition rates of OND derivatives, each bearing a dansyl (Dn) group, to NP represented as normalized fluorescence (Norm. Fluor.). This experiment was repeated twice with similar results. e) Release curves of the Dn-furan fragment from OND linkers 1-5 at 37°C. Linker structures and kinetic parameters of addition and fragmentation are given in Supporting Information. n=6 independent samples per group. Data is shown as normalized fluorescence (Norm. Fluor.). f) Representative bright-field (BF) and near infrared (NIR) images showing NP transport after 10 min from site of i.d. injection (white arrows) via C57Bl6 mouse forearm lymphatic vessel (green arrows) to draining LN (white circles). All images are anterior views of the right distal forelimb with i and ii focusing in on the site of injection at the anterior region of the wrist and iii showing the proximal medial lymphatic drainage to the brachial and axillary LN of same i.d. injection. Scale bar = 0.25 cm. This experiment was repeated twice with similar results. g) Representative IVIS images of mice after i.d. injection of: (OND) NPs labeled with both Alexa647-maleimide (AF647, non-cleavable linker) and 3-Rhod (Suppl. Fig. 1), NPs labeled with only Alexa647, and (Free) Rhod-F (Suppl. Fig. 1). Top row = 720 nm emission channel; bottom row = 580 nm emission channel. Data is in Epi-fluorescence: fluorescent emission normalized to incident excitation intensity (unitless). This experiment was repeated once with similar results. Representative images of n=8 biological replicates. h) Quantification of IVIS images of the type shown in panel g. n=8 biological replicates. i) Dn signal (both NP-bound and released) accumulated in LN vs. time after injection of NP loaded with the indicated OND-Dn reagent normalized to the signal from non-cleavable 5-Dn conjugate. Key is the same as in panels e and j. n=3 biological replicates per group. j) Percent of free Dn cargo delivered to dLN vs. time after injection of the same NPs shown in panel I; “TotalInj” represents total percent of injection as measured by Dn signal. n=3 biological replicates per group. k) AUC (area under the curve, representing total amounts) of OND released cargo for different time periods: 1–4, 4–24, and 24–72 h vs. half-life of rDA cleavage for the indicated OND-Dn derivatives. n=3 biological replicates per group. For all graphs, the columns/points and error bars represent the mean + SEM. Statistics were performed by ordinary one-way ANOVA with Tukey’s multiple comparisons test. ****=p<.0001, ***=p<.005, *=p<.05. ****=p<.0001, ***=p<.005, *=p<.05.
Figure 2.
Figure 2.. Altered access by NP-OND to draining lymph node-resident cell populations.
a) Schematic representation of the two-stage delivery mechanism. The cells lining the subcapsular sinus (green) are expected to restrict large particulates (blue) while allowing small molecules (red) into the LN cortex. b) Fluorescence images of collagen hydrogels (7.5 mg collagen/mL) after application of NPs labeled with (NP) Fluorescein-maleimide, (3-OND) 3-Rhod, and (1-OND) 1-Coum. The indicated time represents the period after particle labeling for several minutes followed by application to the top of the gel. Movement through the gel is diffusive, not under flow. Scale bar (white) = 500 μm. Inset = 2-photon image of collagen hydrogel. This experiment was repeated once with similar results. c) Normalized intensity profile across field of view at 0 and 12 h time points for collagen diffusion experiment at 37°C. n=3 samples per group. d) Pixel value (normalized to the 0 h time point) for the half-way point in the field of view at 12 h at 37°C. n=3 samples per group. e) Representative fluorescence image of excised dLN 24 h after i.d. administration of NP labeled with both 3-Rhod and AF647-maleimide. Red = rhodamine OND cargo, blue = false-colored AF647-labeled NP. Scale bar (white) = 500 μm. This experiment was repeated twice with similar results. f) Peak distance for the penetration of (NP+) NP-Alexa and (OND+) dansyl cargo into the LN from the LN boundary, derived from images such as in panel a; n = 24 biological replicates per group. g) Distance of centroid of cell fluorescence from capsule showing deeper lymphocytes (Ly) and more shallow barrier cells (B.C.). h) Percentage of total cells (analyzed by flow cytometry) positive for AF647 (blue) and rhodamine (red) from dLNs 24 h after i.d. administration of: NPs labeled with AF647-maleimide only, (Mix) NPs labeled with AF647-maleimide and mixed with Rhod-F, (OND) NPs labeled with both AF647-maleimide and 3-Rhod, (Free) Rhod-F only. n=6 biological replicates per group. i) Representative images of LN sections stained with markers characteristic of lymphocytes (CD3, B220) vs. barrier cells (CD169, F4/80, Lyve-1) and including CD11c. This experiment was repeated twice with similar results. j) Fraction of total cells positive for OND cargo or NP-AF647 within the dLN. Administration details same as in panel c. n=6 biological replicates per group. For all graphs, the columns/points and error bars represent the mean + SEM. Statistics for f were performed by two-tailed parametric t-test. Statistics for h were performed by two-way ANOVA with Tukey’s multiple comparisons test. ****=p<.0001, ***=p<.005, *=p<.05.
Figure 3.
Figure 3.. Increased cargo delivered by NP-OND to lymph node-resident cells.
a) Representative flow cytometry scatter plots for T and B cells isolated from the dLN 24 h after i.d. administration of: (OND) NPs labeled with both AF647-maleimide and 3-Rhod, (Free) Rhod-F only, (NP) NPs labeled with AF647-maleimide only. This experiment was repeated twice with similar results. b) Number of dLN cells of various types positive for NP-delivered (OND, red) versus free (Free, green) rhodamine and AF647 (NP, blue) measured by flow cytometry after NP-OND and free rhodamine treatment defined as in panel a. n=6 biological replicates per group. c) Data from panel b, represented as percentages of each cell type. n=6 biological replicates per group. d) Normalized mean fluorescence intensity (MFI) of rhodamine (red) and AF647 (blue) in the indicated dLN immune cells after NP-OND or free rhodamine treatment defined as in panel a, normalized to free rhodamine or signal from plain (non-OND derivatized) NP. n=6 biological replicates per group. e) Toxicity of irinotecan-furan derivative Irino-F toward cultured B cells and pDCs after 24 h exposure in media at 37°C. This experiment was repeated once with similar results. f) Number of dead cells in the dLN normalized to the nLN 24 h after i.d. administration of: (OND) NPs labeled with 3-Irino (4 mg/kg), (Free) Irino-F (4 mg/kg), (Saline) negative control. n=3 biological replicates per group. For all graphs, the columns/points and error bars represent the mean + SEM. Statistics were performed by two-way ANOVA with Tukey’s multiple comparisons test. ****=p<.0001, ***=p<.005, *=p<.05.
Figure 4.
Figure 4.. Temporal effects of multistage NP-OND delivery.
a) Schematic representation of the preparation of NPs carrying Rhodamine via OND linkers 3 and 4. b) Release curves of the Rhodamine-furan fragment from OND linkers 3 and 4 at 37°C. n=3 per group. c) Half-life of Rhodamine- OND 3 and 4 at 37°C. n=3 samples per group. This experiment was repeated once with similar results. d) Peak uptake of Rhodamine-furan cargo released from OND linkers 3 (red) and 4 (orange) in the indicated dLN immune cells after NP-OND treatment defined as in panel a. n=5 biological samples per group. For all graphs, the columns/points and error bars represent the mean + SEM.
Figure 5.
Figure 5.. Augmented immunotherapeutic effects of adjuvant delivery with NP-OND system.
a) Total numbers of dLN cells of various types 24 h after i.d. treatment with (OND) NP-OND-CpG, (SS) CpG disulfide bonded to NP, (CpG) free CpG oligonucleotide, and saline as negative control. n=6 biological replicates per group. b-d) Maturation of (b) B cells, (c) cDCs, and (d) pDCs from dLNs 24 h after i.d. treatment with NP-OND-CpG, determined by flow cytometry analysis for the indicated markers. n=6 biological replicates per group. e-j) Results at day 12 after tumor implantation, following treatment for five days (starting at day 4) with: (OND) NP-OND-CpG, (SS) NP-SS-CpG, (CpG) free CpG oligonucleotide, or saline. n=5 biological replicates per group. e) EL4 LN tumor sizes. f) Representative LN images. Black bar = 0.5 cm. This experiment was repeated once with similar results. g) Representative TCRVβ12 staining of sectioned LN tumors. Black bar = 1.0 mm. This experiment was repeated once with similar results. h) Primary tumor size d12 post treatment. Immunohistochemistry staining of primary EL4 tumors for CD8a (i) and NK1.1 (j) cells. n=5 biologic replicates per group. Yellow line is the tumor border. Blue bar = 100 um. For all graphs, the columns/points and error bars represent the mean + SEM. Statistics for a-d were performed by two-way ANOVA with Tukey’s multiple comparisons test. Statistics for e and h were performed by ordinary one-way ANOVA with Tukey’s multiple comparisons test. ****=p<.0001, ***=p<.005, *=p<.05.

Comment in

  • Targeting immune cells within lymph nodes.
    Porter CJH, Trevaskis NL. Porter CJH, et al. Nat Nanotechnol. 2020 Jun;15(6):423-425. doi: 10.1038/s41565-020-0663-z. Nat Nanotechnol. 2020. PMID: 32523098 No abstract available.

References

    1. Babar IA et al. Nanoparticle-based therapy in an in vivo microRNA-155 (miR-155)-dependent mouse model of lymphoma. Proceedings of the National Academy of Sciences 109, E1695–E1704 (2012). - PMC - PubMed
    1. Lorenzo-Redondo R et al. Persistent HIV-1 replication maintains the tissue reservoir during therapy. Nature 530, 51 (2016). - PMC - PubMed
    1. Kuerer HM et al. Residual metastatic axillary lymph nodes following neoadjuvant chemotherapy predict disease-free survival in patients with locally advanced breast cancer. Am J Surg 176, 502–509 (1998). - PubMed
    1. Liu H et al. Structure-based Programming of Lymph Node Targeting in Molecular Vaccines. Nature 507, 519–522 (2014). - PMC - PubMed
    1. Lee J-W et al. Peripheral antigen display by lymph node stroma promotes T cell tolerance to intestinal self. Nature Immunology 8, 181 (2006). - PubMed

Publication types

MeSH terms