. 2020 Jun;582(7811):294-297.
doi: 10.1038/s41586-020-2236-6. Epub 2020 Apr 29.

The architecture of the Gram-positive bacterial cell wall

Affiliations

The architecture of the Gram-positive bacterial cell wall

L Pasquina-Lemonche et al. Nature. 2020 Jun.

Abstract

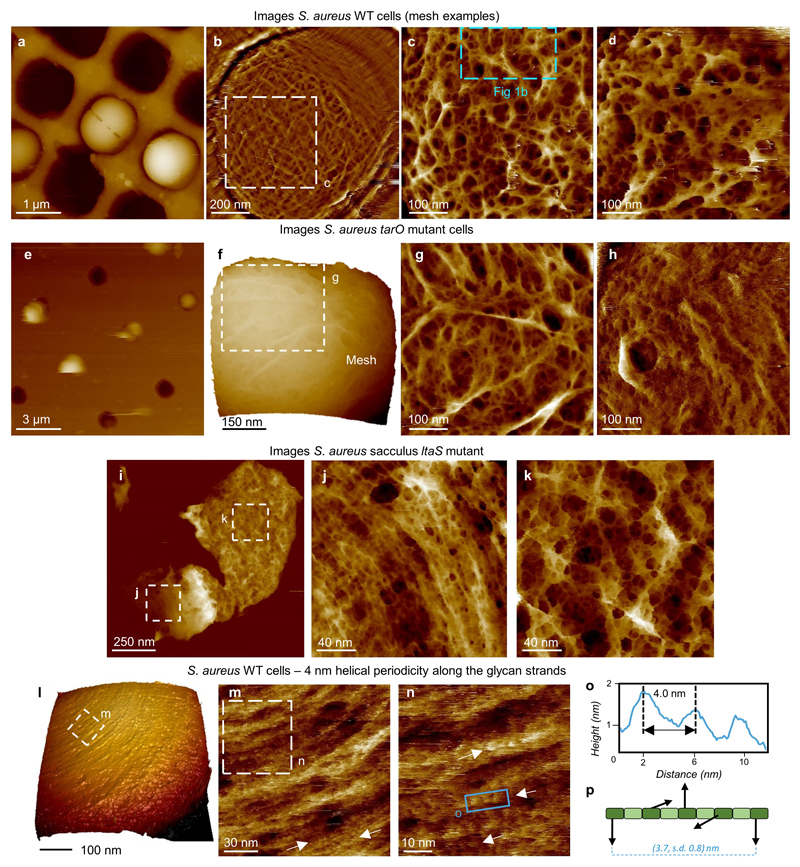
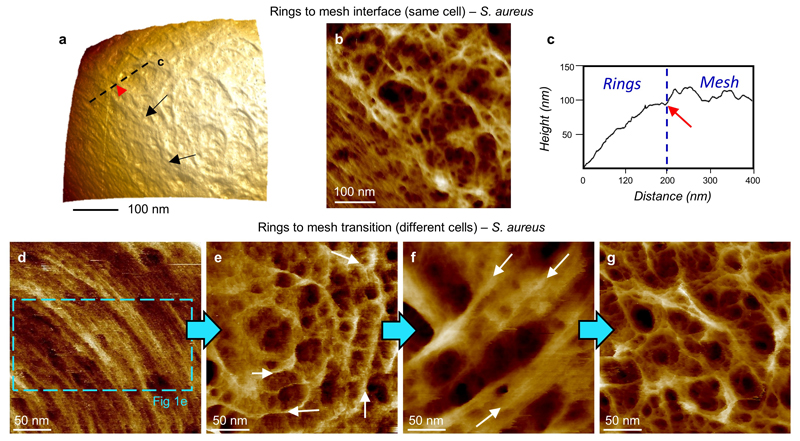
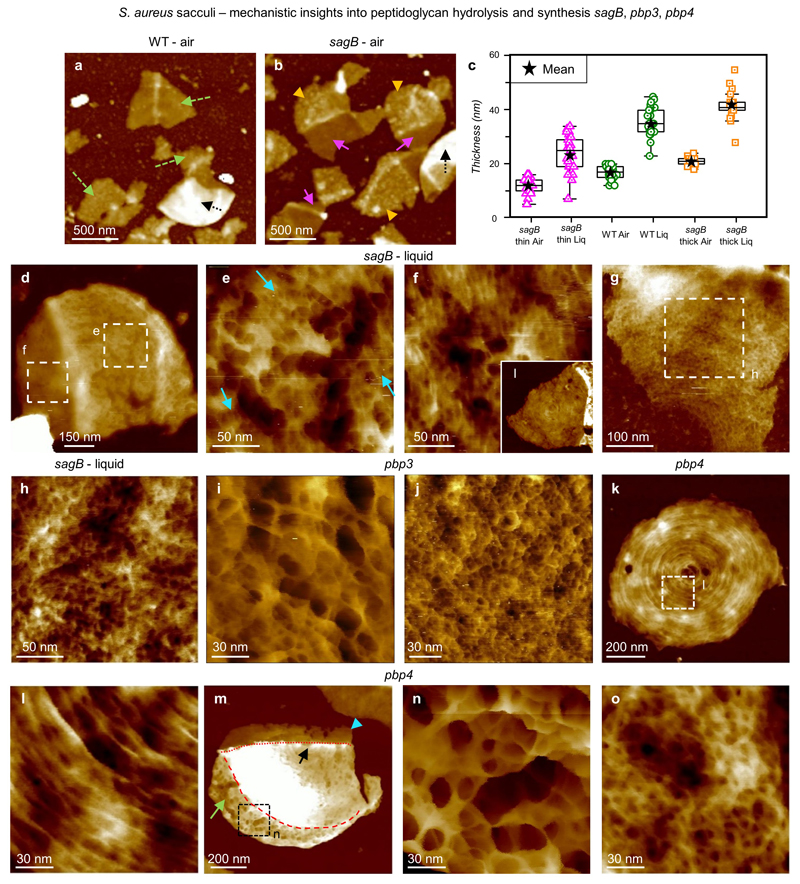
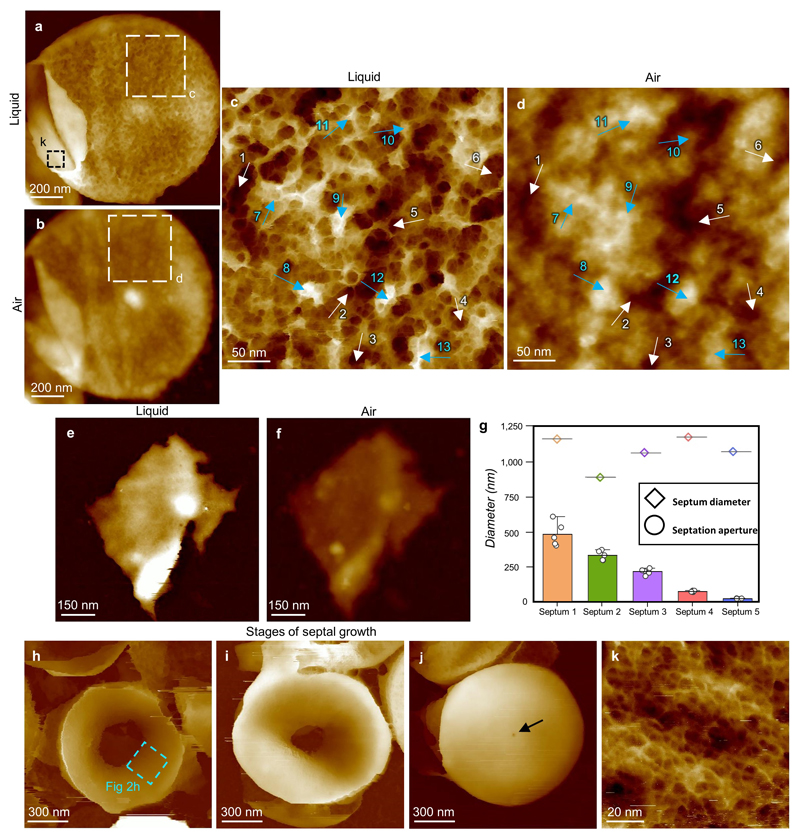
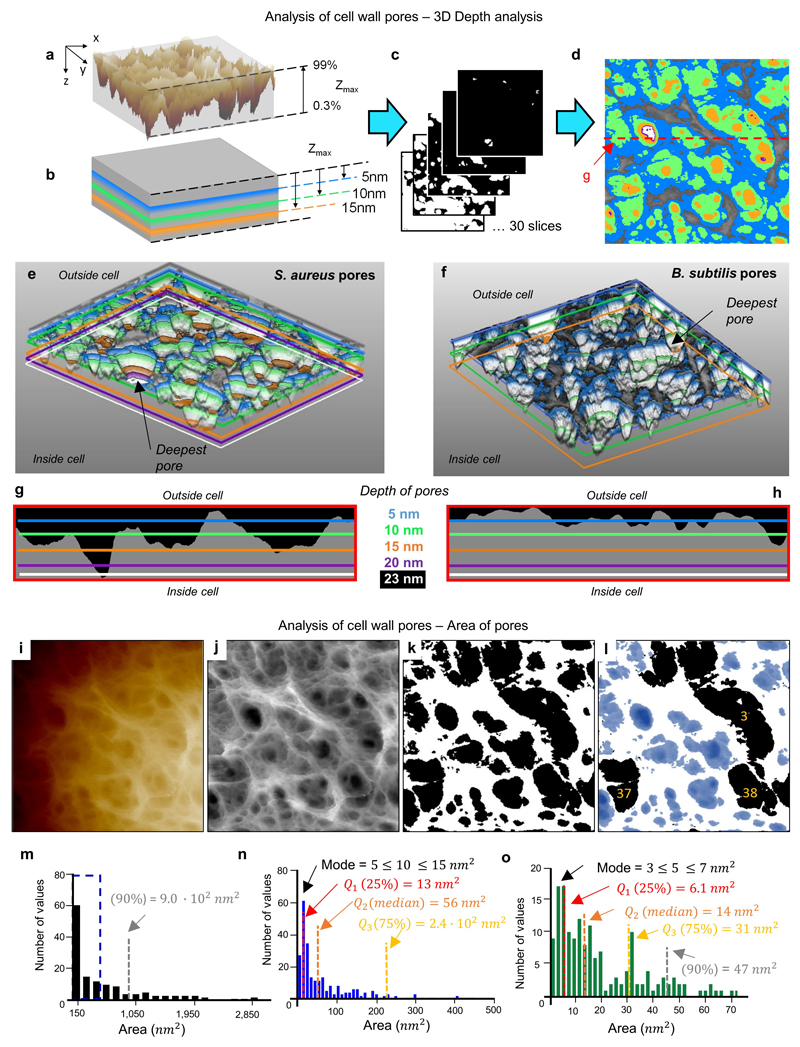
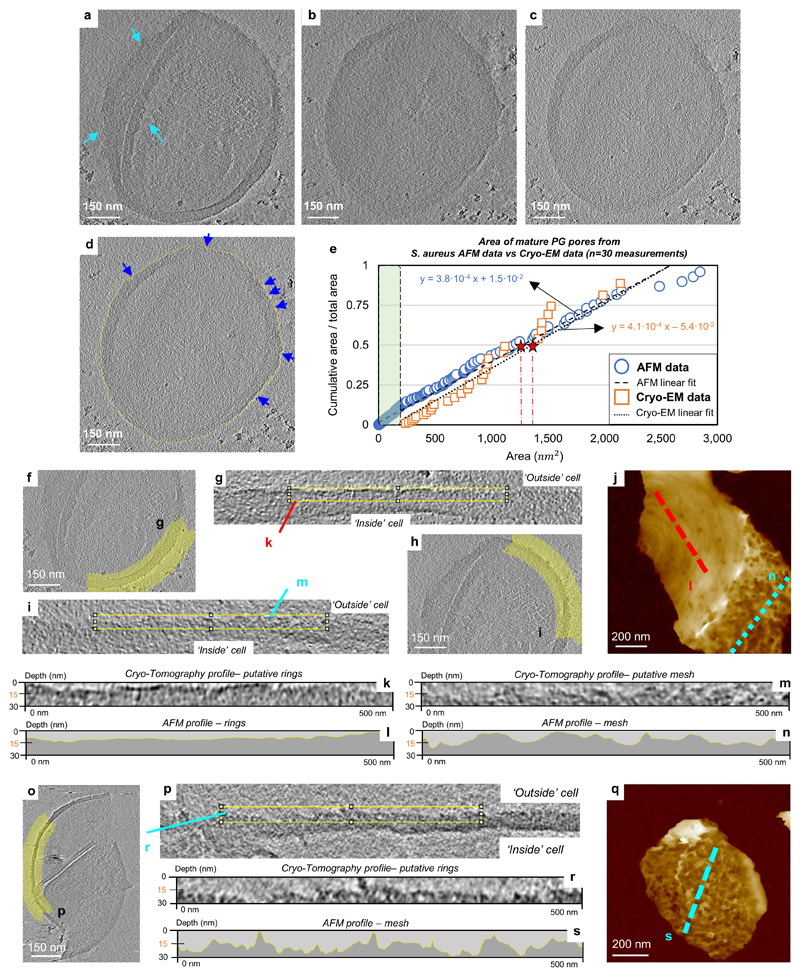
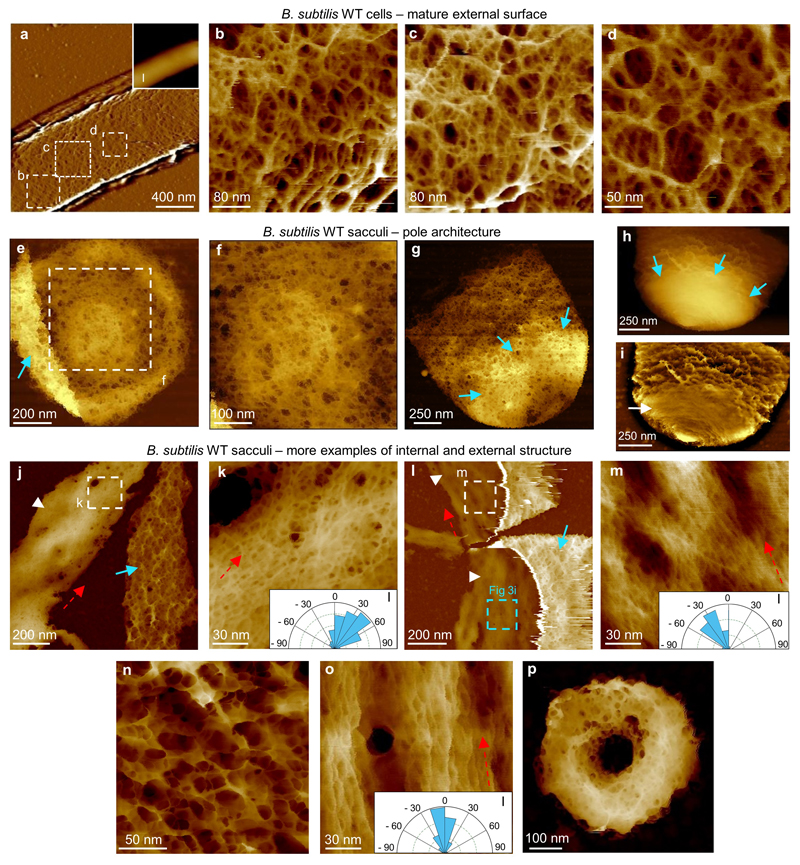
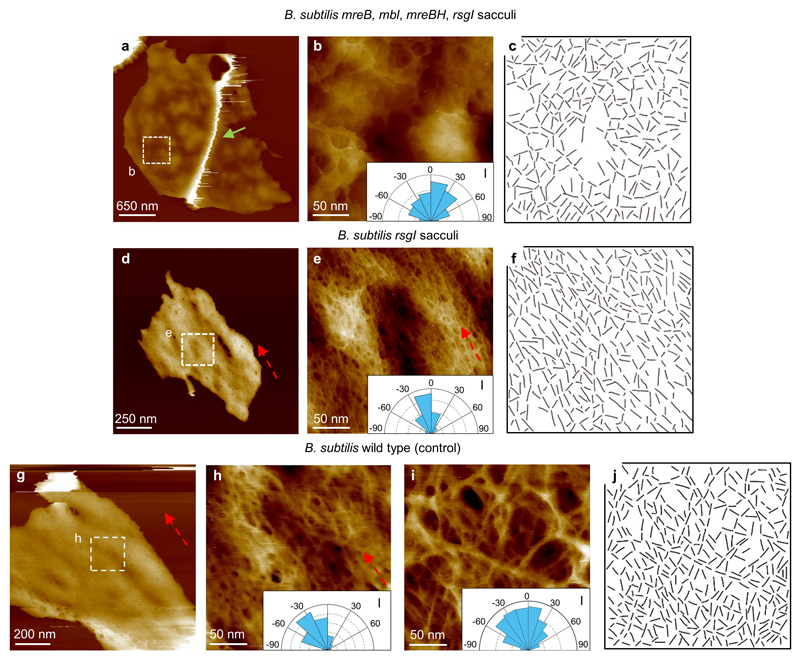
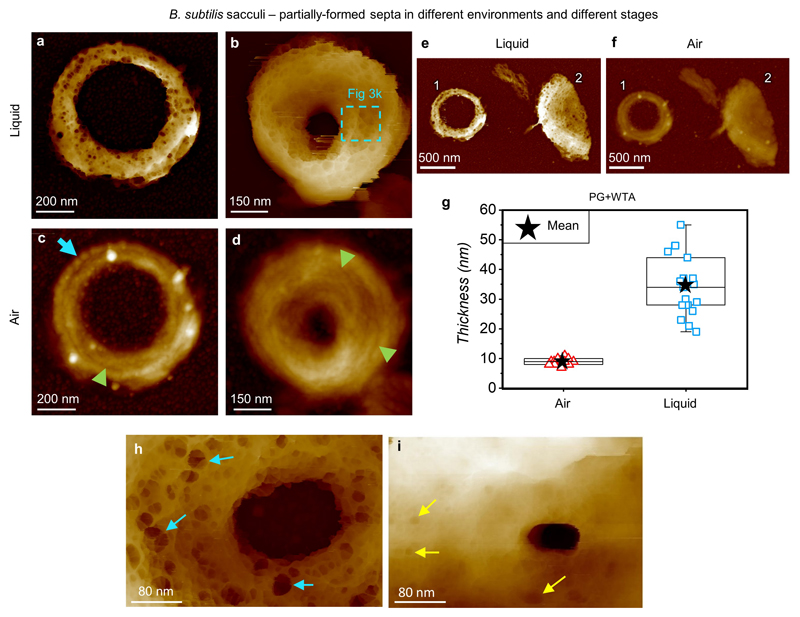
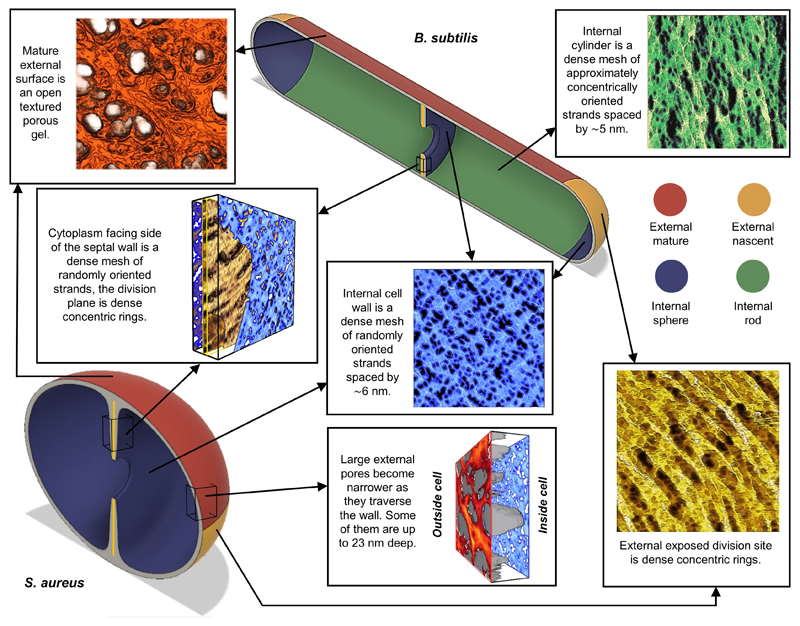
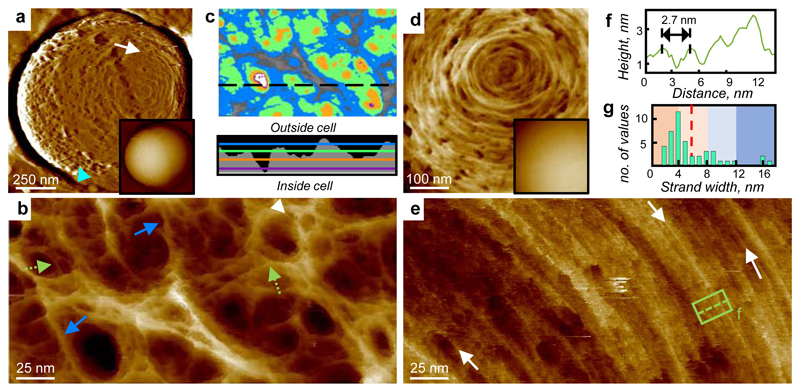
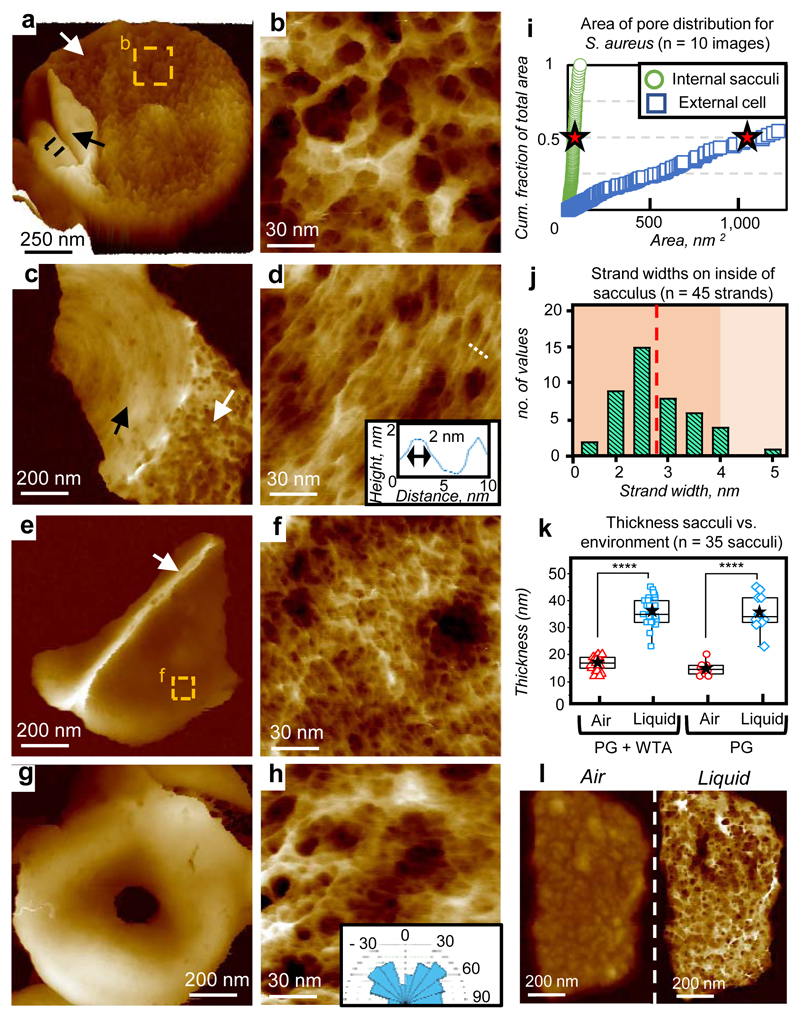
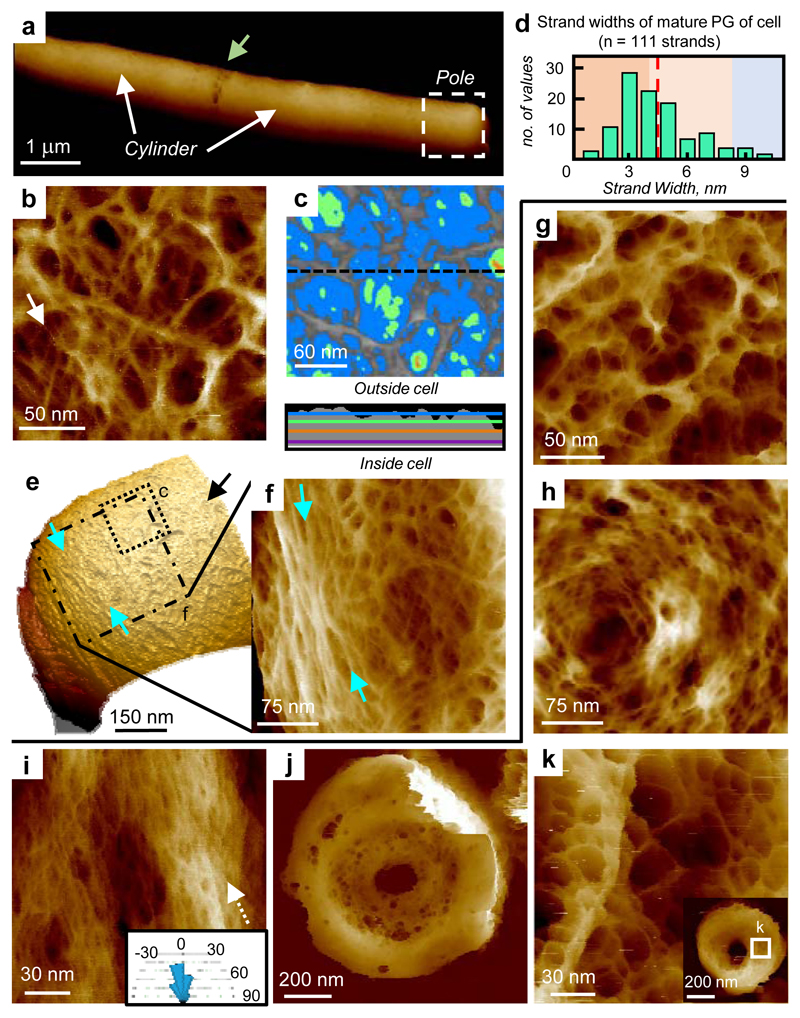
The primary structural component of the bacterial cell wall is peptidoglycan, which is essential for viability and the synthesis of which is the target for crucial antibiotics1,2. Peptidoglycan is a single macromolecule made of glycan chains crosslinked by peptide side branches that surrounds the cell, acting as a constraint to internal turgor1,3. In Gram-positive bacteria, peptidoglycan is tens of nanometres thick, generally portrayed as a homogeneous structure that provides mechanical strength4-6. Here we applied atomic force microscopy7-12 to interrogate the morphologically distinct Staphylococcus aureus and Bacillus subtilis species, using live cells and purified peptidoglycan. The mature surface of live cells is characterized by a landscape of large (up to 60 nm in diameter), deep (up to 23 nm) pores constituting a disordered gel of peptidoglycan. The inner peptidoglycan surface, consisting of more nascent material, is much denser, with glycan strand spacing typically less than 7 nm. The inner surface architecture is location dependent; the cylinder of B. subtilis has dense circumferential orientation, while in S. aureus and division septa for both species, peptidoglycan is dense but randomly oriented. Revealing the molecular architecture of the cell envelope frames our understanding of its mechanical properties and role as the environmental interface13,14, providing information complementary to traditional structural biology approaches.


Conflict of interest statement

Competing interests

The authors declare no financial or non-financial competing interests.

Figures

Extended Data Figure 1
Extended Data Figure 1. S. aureus cells and sacculi: cell wall fine structure and other cell wall components.
a, Overview image of individual S. aureus wild type (WT) live cells trapped inside silicon holes. Topographic data scale (DS) = 1100 nm. b, Individual cell showing mature mesh covering the top surface, high pass filtered, filter size = 0.23 μm, vertical. c, Higher resolution image within b with blue dashed box denoting the location of Fig 1b in the main text. DS = 35 nm. d, Example of mesh from another cell. DS = 58 nm. e, S.aureus tarO mutant cells (this mutant lacks wall teichoic acids - WTAs) trapped in silicon holes (provided by NuNano – see Methods for sample preparation). DS = 2033 nm. f, Higher resolution image on an individual cell showing the mature mesh. DS = 580 nm, 3D details: Z aspect ratio = 1.0, Pitch = 16.5°, Plot type = height. g, Higher resolution image from f showing the mature mesh. DS = 34 nm, (comparison to Fig 1b). h, Concentric rings on tarO mutant (comparison to ED2e), DS = 46 nm. Direct comparison between the WT and tarO mutant shows that there is no substantial difference in the organization of the cell wall in the absence of WTAs and that the features observed in the WT are not WTAs. i, S. aureus ltaS mutant cells in an SH1000 background were purified and a sacculus with its external PG structure facing upwards is shown here. DS = 121 nm. j, Higher resolution image from within i highlighting the nascent PG structure of this sacculus with similar features to those seen in the WT. DS = 14 nm. k, Higher resolution image from within i corresponding to the mature PG structure of this sacculus with no apparent difference from the same structure observed in the WT cells (see Fig 2b as an example). DS = 33 nm. This direct comparison between the WT and ltaS mutant shows that there is no apparent difference in the organization of the cell wall in the absence of LTAs (lipoteichoic acids) and that the features observed in the WT are not attributable to LTAs or WTAs so must be peptidoglycan. l, 3D view of the S. aureus cell that images m-n were taken from. DS = 398 nm, 3D details: Z aspect ratio = 0.5, Pitch = 35°, Light rotation = 36°, Light Pitch = 40°, Light Intensity = 60%, Plot type = mixed. m, Image showing periodic features along the glycan chain direction (white arrows pointing at single glycan strands clearly showing the periodicity). DS = 14 nm. n, Higher resolution image from m (dashed white square) showing the 3.7 nm periodicity. DS = 10 nm. o, Profile taken along the blue rectangle in n, showing a 4 nm separation between adjacent features. We suggest the periodic bumps are uncross-linked penta-peptide side chains presented at the surface every helical repeat. p, Schematic of the helical repeat of peptidoglycan, with statistics from 24 measurements similar to those in o, mean ± s.d. is 3.7 ± 0.8 nm for the periodicity. This is in agreement with NMR data, (see reference in the main text). The morphologies from a-d and l were also detected each in at least 5 other biological independent repeats, similar features to those in m-n in at least 3 biological repeats (see repository); from e-g two biological independent repeats were performed. h-k come from one biological repeat.
Extended Data Figure 2
Extended Data Figure 2. S. aureus live cell architecture.
a, At the interface between the most recent division plane and the mature cell wall we find a sharp topographic step between the mature (mesh) and recently synthesised cell wall (concentric rings), see black arrows. DS = 535 nm, 3D details: Z aspect ratio = 1, Pitch = 21°, Light rotation = 103°, Light Pitch = 49°, Light Intensity = 70%, Plot type = mixed. b, Same image as a but processed with a Plane Fit at 3rd order showing the sharp interface in more detail. DS= 27 nm. c, profile from taken along the dotted black line in a, showing a sharp change in height at the interface between the mesh and the rings (see red arrow corresponding to red arrow head in a). d-g are a series of images, each from a different cell, showing the presumed time evolution of the ring architecture. Samples naturally contained cells with a distribution of times since their last division, and hence showing differing levels of maturation of the peptidoglycan at the extracellular surface of the most recent division plane. d, Recently revealed outer septal surface showing dense concentric rings. The blue dashed box shows the location of Fig 1e in the main text. DS = 18 nm. e, Image of a different cell showing what is probably the next stage of maturation. The rings are still prominent (white arrows), but show larger spacing, greater height variation and pores have appeared in the surface. Features oriented approximately along the radial direction are also apparent. DS = 23 nm. f, A different cell showing the subsequent stage where, underneath the rings, the pores of the mesh have started to appear. DS = 38 nm. g, The last stage of maturation of the cell wall is the completely disordered mesh without any traces of former ring structures. DS = 30 nm. The morphologies from a-b were also detected in at least 1 other biological independent repeat (see repository) and from d-g were also detected each in at least 2 other biological independent repeats (see repository).
Extended Data Figure 3
Extended Data Figure 3. Mechanistic insight into peptidoglycan hydrolysis and synthesis.
a, Sacculi of S. aureus WT imaged in air, with different fragments containing single layers of PG (green dashed arrows) and double layers (black dotted arrow), DS = 75 nm. b, Sacculi from S. aureus sagB mutant in an SH1000 background imaged in air. The fragments have two distinct regions with different thicknesses (pink and orange arrow heads). These are distinct from the double layer fragments (black dotted arrow), DS = 75 nm. c, Graph comparing the thickness of the cell wall in air and liquid between the sagB mutant and the wild type. The box-plot consists of boxes from 25-75 percentile, middle line represents the median, black star represents the mean value, error bars are maximum/minimum values excluding any outliers (using 1.5 inter-quartile range). The two different regions of the sagB cell wall are separately binned and labelled ‘sagB thin’ and ‘sagB thick’. Measurements were taken using the same approach as the values for graph Fig 2k in the main text and ED4. Number of sacculi measured n = 25 for each bin. Mean values ± s.d. are: ‘sagB thin air’ = 12 ± 3 nm, ‘sagB thin liq’ = 24 ± 7 nm, ‘sagB thick air’ = 21 ± 1.5 nm, ‘sagB thick liq’ = 42 ± 5.7 nm, ‘WT air’ and ‘WT liq’ corresponded to the same values as Fig 2k (left data, PG+WTA). All measurements in liquid were performed in buffer 300 mM KCl + 10 mM Tris, pH = 8. d, S. aureus sagB mutant sacculus in liquid with its external surface facing upwards. This sacculus is clearly divided into two sections, the region on the left is thinner than the region on the right. This irregularity in height was visualised in several sacculi from cells with this mutation. DS = 64 nm. e, Higher resolution image from the thicker section in d corresponding to the finer mature CW architecture. This mesh is still in an early transition from rings, with some features reminiscent of rings visualised following the same orientation (blue arrows). These sorts of structures are uncommon on WT sacculi at the same stage in the cell cycle (exponential phase OD600 = 0.5-0.7). However, in the sagB mutant it was more common to find this early transition from rings to mesh. DS = 11 nm. f, Higher resolution image from the thinner section in d showing the finer nascent CW architecture (i.e. rings). Inset shows a lower resolution image of the ring architecture in a different sacculus. The features from this image are not significantly different from WT nascent PG architecture, such as Fig 2d in the main text. However, almost every sacculus containing nascent architecture in the sagB mutant had this part of the cell wall being thinner than the rest of the sacculus, something not seen in the WT. DS = 9 nm, inset DS = 29 nm. g, Sacculus fragment with the inner CW architecture facing upwards, DS = 14 nm. h, Higher resolution image from g showing the fine inner structure of the sagB mutant, with no clear difference from the very tight and disordered structure seen in WT sacculi (see Fig 2f from the main text for example). DS = 4 nm. i, Sacculi from S. aureus pbp3 mutant cells in an SH1000 background. Here we show the fine external structure, with no apparent difference between this and the S. aureus WT mature external structure. It is important to highlight that PBP3 is not an essential peptidoglycan synthesis enzyme, and the cells can survive without it and still maintain their spheroid shape. DS = 55 nm. j, The fine structure of an S. aureus pbp3 mutant sacculus with the internal peptidoglycan surface exposed, which is similar to that seen in wild type S. aureus. DS = 4 nm. k, Sacculus from S. aureus pbp4 mutant cells in an SH1000 background showing nascent peptidoglycan structure, with the concentric rings facing upwards. It is important to highlight that PBP4 is not an essential peptidoglycan synthesis enzyme either, and the cells can survive without it and still maintain their spheroid shape. DS = 28 nm. l, Higher resolution image taken within k showing the fine structure of the nascent peptidoglycan surface, the concentric rings. There is no significant difference compared to the S. aureus WT nascent structure, except the fraction of sacculi with rings in a random area is higher in this sample than WT. DS = 8 nm. m, Sacculus showing a small area of the mature peptidoglycan structure (green long arrow), with its external surface facing upwards, the rest of the sacculus is covered by concentric rings already in the late phase of the transition to mesh (black short arrow pointing to the centre of the concentric rings, boundary with the mature structure, red dashed line) and the newest generation fragment with rings (blue arrow head, boundary with oldest rings marked with red dotted line). It is important to highlight this is the first time two perpendicular planes of rings have been visualized at exponential phase in our experience. OD600= 0.6. DS = 79 nm. n, Higher resolution image from m showing the fine structure of the mature external CW of an S. aureus pbp4 mutant, with no apparent difference between this and the S. aureus WT mature external structure (see ED1 and Fig 2b from the main text). DS = 44 nm. o, Sacculus showing the fine internal structure of S. aureus pbp4 mutant cell wall, with no apparent difference compared to the S. aureus WT internal peptidoglycan architecture (see Fig 2f from the main text). DS = 10 nm. These data show that removal of non-essential PBPs makes only relatively minor differences to the wall architecture.
Extended Data Figure 4
Extended Data Figure 4. S. aureus sacculi.
a, Height image of the same sacculus shown in Fig 2a in the main text. This sacculus has been broken on the left side and emptied of all of the cell’s contents, allowing the difference in PG structure between the internal and external surfaces to be clearly seen. Imaging buffer: 10 mM Tris pH 7.8 + 300 mM KCl. DS = 192 nm. b, Same sacculus as a but imaged in air (dried with nitrogen flow). DS = 84 nm. c, Higher resolution image from a taken in buffer showing the mature mesh, white arrows (1-6, lower regions on the image), blue arrows (7-13, higher regions on the image). DS = 33 nm. d, Image of the same region of mesh as in c but in air. This morphology has been previously termed “knobbles” (see reference in the main text). Arrows were manually placed to point to the corresponding features as 1-13 in c. DS = 11 nm. e, Image of sacculus fragment in buffer conditions 10 mM Tris pH 7.8 + 300 mM KCl. The height of the sacculus (32.4 nm) was measured using the 1D statistical analysis from Gwyddion™ software (see details in Methods). f, The same sacculus fragment as e but imaged in air with an overall height of 17.5 nm measured in the same way as e. Both images (e, f) have the same data scale (DS = 65 nm). The same process was repeated with 24 other sacculi to produce the thickness data for Fig 2k in the main text, using a positioning marker either on the sample or substrate beneath to enable the same fragments to be located in both air and liquid. g-j, Analysis of the septation process. g, A graph showing decreasing aperture size in the septum with constant septum diameter (n = 5 measures) of septation aperture for each septum shown in circles. The centre values represent the mean value and the error bar the maximum value excluding outliers. Septa 2, 3 and 5 being h to j respectively. Images h-j show different stages of septal growth, each image collected from a separate S. aureus sacculus. Images are presented in order of apparent septation progress, with the internal aperture in the middle of the septa getting smaller for cells at later stages of septation. DS: h, 548 nm, i, 512 nm, j, 627 nm. The area corresponding to Fig 2h in the main text was taken from the blue dashed box in h. The black arrow in j indicates the internal aperture in the centre of this nearly completed septum. Images h-j were taken from cells grown at OD600 ~ 0.1, because this condition provided a higher number of partially-formed septa in the sample. k, Higher resolution image from a of the internal structure of S. aureus cell wall, showing a randomly orientated dense mesh. DS = 10 nm.
Extended Data Figure 5
Extended Data Figure 5. Quantitative analysis of pores.
a, Image ED2g of the mature PG structure from an S. aureus live cell image represented in 3D and then tilted. The lateral resolution is lost and no clear information about the pores is visible with this representation. Therefore, a new analysis method was designed. The first step is to measure the maximum depth of this 3D image, the Zmax is calculated neglecting the areas below 0.3% and above 99% because they might contain artefacts and signal errors from the AFM. b, a two dimensional sectioning process is performed in the XY plane going down from Zmax highlighting a set of certain depths. c, Slices were taken at intervals of approximately 3% of the total Zmax, including slices with the selected depths from b. d, All slices of different depths were super-imposed on top of the original image ED2g, five of the slices are highlighted in different colours (blue = 5 nm, green = 10 nm, orange = 15 nm, purple = 20 nm and white = 23 nm) showing the different areas covered by different depths. This is the complete image from which Fig 1c in the main text was cropped. e, After converting all the slices into a stack of images in ‘.tiff’ format, AvizoLite™ software was used to represent the pores’ shape in 3D (view from the bottom) and the chosen set of depths were marked with the same colours as in d; a black arrow highlights the deepest pore in this image. f, This procedure was repeated for the mature PG structure from B. subtilis live cell, image ED7d. The 2D version of f, analogous to d, is shown in Fig 3d in the main text. Again the deepest pore in the 3D representation is marked with a black arrow. g-h Show a direct comparison of lateral slices in the XZ plane, so that the lateral profile of the pores can be visualised. Peptidoglycan is coloured grey in these images. The lateral slice from S. aureus is extracted from the red dashed line marked in d and for B. subtilis it corresponds to the black dashed line in Fig 3d in the main text. i-k show the steps followed to quantitatively compare the area of the pores on the outside of the cell and the inside of purified peptidoglycan. i shows the raw data extracted from the AFM. j, The image has been processed with the Nanoscope Analysis software (3rd order Plane-fit) to remove the offset, tilt and curvature of the cell. The image has been converted to greyscale, and a despeckle filter (3x3 median filter) has been applied with ImageJ/Fiji (see reference in Methods). k, A 2D slice in the XY plane was made at a depth of 50% of Zmax for 6 images of live S. aureus and 4 images of internal S. aureus sacculi using the ImageJ/Fiji threshold tool. Slices were then binarised with pores in black and peptidoglycan in white. The “analyse particle” tool from ImageJ/Fiji was used to measure the pores. This outputs a list of individual pores with their associated area and a number for each pore. l, In some cases, in particular when several pores lie within a larger depression on the surface, pores are artificially merged. These were manually removed from the dataset by comparing the binary image with the grey scale image. Correctly assigned (retained) pores are shown in blue, three artificially merged (discarded) pores are shown in black. m-o, Histograms of pore area. m, Pore area histogram calculated for 310 pores from 6 separate images for the external surface of live S. aureus cells. The bin width is 150 nm2. n, A subset of the same dataset as m (denoted by the blue dashed box) binned at 10 nm2 intervals. o, Pore area histogram calculated for 158 pores from 4 separate images of the internal surface of S. aureus sacculi, binned at 2 nm2 intervals. The distributions of pore area are non-normal and positively skewed for both the internal and external surfaces. 90% of the pores in the external surface have area < 900 nm2 (grey dashed line in m). For the internal surface, 90% of the pores have area < 47 nm2 (grey dashed line in o). The mode and quantiles Q1-3 (25, 50 and 75% respectively) are marked on the figure distributions in n and o with dashed lines.
Extended Data Figure 6
Extended Data Figure 6. Tomogram of purified frozen hydrated S. aureus sacculus.
S. aureus WT cells were purified and treated with HF to remove all WTA, so that only a pure PG sacculus was imaged. Tomograms were captured of five sacculi, an example of a single sacculus is given in Supporting Information (see ‘Video_SI1’). a, Shows a 13 nm thick tomogram slice from the first stop point on ‘Video_SI1’ which corresponds to the external CW surface showing disordered structures throughout the area of the sacculus (see blue arrows). b, shows a 13 nm thick tomogram slice from the second stop point on ‘Video_SI1’ corresponding to the other side of the CW, the smooth internal structure which is in agreement with the AFM data presented in Fig 2. c, shows an intermediate 13 nm thick tomogram slice between a and b where the outline of the CW exterior surface is visualized showing a disordered structure presumably formed by pores. d, as c with the exterior surface highlighted in yellow, examples of individual pores analyzed are indicated by blue arrows. e, Graph plotting the area of each pore vs the cumulative fraction of the total pore area of all pores analysed. The blue dots correspond to measures from the AFM images of S. aureus cells, measured at a height of 50% of the total image height scale (data also presented in Fig 2i), the black dashed line is the linear fit to these data. The orange squares are individual measurements of pore diameter from image d converted into pore area by assuming the pores are circular, the black dotted line is the linear fit to these data, showing a similar slope to the AFM data. Red stars show 50% of the cumulative area, i.e. half of the total pore area consists of pores smaller/larger than this value. The values calculated from the linear equations for both types of data are: 39 nm for AFM data and 42 nm for the Cryo-EM data. This slight difference is most likely due to the lack of smaller pores analysed by Cryo-EM, which is highlighted with a transparent green area in the graph. Total pores analysed by AFM were n = 311, from n = 6 images and by Cryo-EM were n = 30, from 1 image. For more details on the ‘Video_SI1’ see SI1. f, The same tomogram slice as ED6a highlighting a region of the sacculus that is smooth on both the inside and the outside. Cryo-EM does not discern the ring structure as it views in transverse section, but we suggest that this region of the sacculus is most likely made up of rings. g, Shows the region highlighted in yellow in f, which has been traced with a spline function which was then used to straighten the section. h, Shows the same tomogram slice as ED6a highlighting in yellow a region with a rough external surface, which we suggest corresponds to the mesh architecture observed with AFM. i, Shows the yellow region of h straightened as in g. j, AFM image of a sacculus showing two distinguishable areas (reproducing Fig2c), the top part consists of a smooth surface with occasional pores, where the glycan strands are organized as concentric rings. On the bottom part of the sacculus, the mature CW shows a highly topographic surface. k, Shows f cropped to the same size as the AFM profile shown in l. l, AFM profile in yellow from the red dashed line in j, showing an almost flat surface. m, Shows i cropped to the same size as the AFM profile in n. n, AFM profile taken along the blue dotted line in j. We note the qualitative similarity between the two data sets, despite the very different contrast mechanisms of the two techniques. o, Shows an example tomogram slice from a tomogram of a different sacculi. p, The region of the cell wall highlighted in yellow, straightened as in g above. q, Another example AFM image of the mesh architecture. r, The area indicated with the blue box in p, cropped to the same size as the AFM line profile below, highlighting the rough texture of the external cell wall. s, Profile taken along the blue dashed line in q.
Extended Data Figure 7
Extended Data Figure 7. B. subtilis live cells and sacculi.
a, High pass filtered image (filter size 0.2 μm, horizontal) of B. subtilis cell cylinder in exponential phase attached to a Cell-Tak coated substrate, inset (I) shows the unfiltered height data. DS = 1417 nm. b-d, Higher resolution images of mature cell wall (mesh) within image a in locations marked with white dashed squares. DS = 31 nm, 27 nm and 21 nm respectively. The external surface of B. subtilis is covered by disordered mesh all along the cylinder with the exception of the newly synthesised poles (which have concentric ring architecture). e, Image of a sacculus from a B. subtilis cell, showing the internal surface of a pole. We can differentiate between poles and completely formed septa because of the folded material on top (blue arrow). No septa were observed with this feature. DS = 130 nm. f, Higher resolution image from within e showing the fine structure of the internal pole, similar to the internal structure of S. aureus suggesting that this architecture is characteristic of the spherical part of Gram positive cells. DS = 87 nm. g, External part of the pole facing upwards with the interface between the pole and the rest of the cylinder indicated by blue arrows. DS = 118 nm. We presume this image corresponds to a mature pole, and that the concentric rings have become mesh, suggesting that the structural reorganization in time from rings to mesh also occurs in B. subtilis poles. h, Example of newly synthesised pole facing upwards with a sharp interface between the pole and the rest of the cylinder (blue arrows). This pole displays very tight concentric rings in contrast to g and similar to Fig 3e-f in the main text. DS = 800 nm. i, The same image as h but processed with Gwyddion and JPK software (flattened to 0th order with mask drawn manually over the sacculus, path level to remove lines), allowing the concentric rings (white arrow) to be visualised more clearly. The results from images e-i support a common process of synthesis and maturation of cell wall on the spherical parts of Gram positive bacteria in both spherical and rod-shaped species. Images e-i were taken with a JPK NanoWizard 3 in QI mode (see Methods). Images e-h were processed with Gwyddion (see reference 34), image i was processed with JPK data processing software, the colour palettes are different. j, Image showing two fragments from B. subtilis sacculi. The one on the left corresponds to the internal structure facing upwards (white arrow head), the fragment on the right has the external structure of the cylinder, mesh, facing upwards (blue arrow).The assumed cylindrical axis is marked (red dashed arrow). DS = 118 nm. k, Higher resolution image from within j of internal cell wall. Some larger pores are visualised here and there is some predominant orientation indicated by the angle distribution of the fibres shown in the inset (I), in agreement with the cylindrical axis (red dashed arrow). The method for obtaining these distributions is explained in ED8. DS = 46 nm. l, Example of B. subtilis sacculus fragments showing the two different structures: the internal cell wall in the two fragments (white arrow heads) and the top part of the cylinder corresponding to the external cell wall (blue arrow). DS = 146 nm. The distinction between this image and that shown in j is that these fragments are part of the cylinder that once belonged to the same cell, the blue dashed box marks the area corresponding to Fig 3i in the main text, the assumed cylindrical axis is marked (red dashed arrow). m, Higher resolution image from l of internal cell wall. This strongly aligned structure (see Inset, I) is the most commonly found in these sacculi in contrast with k. As the fragments in l are not totally broken, we assume this will be more similar to the native structure of cell wall. DS = 19 nm. n-p, Images of the different structures from B. subtilis sacculi that have been HF treated so the WTA have been removed: n, mesh seen on the external surface (DS = 30 nm), o, strands inside (DS = 30 nm), circumferential axis direction given by the red dotted line, strand orientation Inset, I) and p, partially-formed septum (DS = 130 nm). This shows that none of the previous structures were due to teichoic acid organization, which is consistent with our findings for S. aureus cells.
Extended Data Figure 8
Extended Data Figure 8. B. subtilis strand orientation analysis and mechanistic insights
a, B. subtilis mreB mbl mreBH, rsgI mutant sacculus image of the internal structure of cell wall, with a defined ridge (green arrow). This mutant lacks the MreB family of proteins, which leads to a spheroidal shape. DS= 411 nm. b, Higher resolution image from a showing the fine structure of the internal surface of a B. subtilis mreB mbl mreBH, rsgI mutant sacculus, with a disordered structure (see Inset, I, indicating a broad distribution of strand orientations) similar to the internal structure of S. aureus, suggesting that when Gram positive cells cannot maintain a rod shape, no cylindrical orientation is required. DS = 52 nm. c, Data used to obtain the orientation distributions for the glycan strands. Lines were hand drawn over the images along the clearly visible strands, using short straight strokes. A custom MATLAB routine (SI2) was then used to obtain the orientation distribution of these lines. The routine successfully recognised ~ 70% of the lines and determined their orientation. d, The mutations of the MreB family, shown in a-c, was created in a B. subtilis rsgI background strain. We prepared a purified sample from this B. subtilis rsgI mutant as a control. This image corresponds to the internal CW structure. DS = 76 nm. e, Higher resolution image from within d showing glycan strand orientation along the short axis of the rod morphology of the bacteria (dashed red arrow and inset, I). This sample had the same characteristics and structures as the WT strain. DS = 23 nm. f, Data used to plot the orientation distribution rose from inset in e. g, As an additional control, a sacculi sample of B. subtilis WT was grown as the mutants. This image shows another internal CW structure from a broken sacculus. DS = 125 nm. h, Higher resolution image from within g showing glycan strand orientation cylindrical along the short axis of the rod morphology of the bacteria (see dashed red arrow and inset, I). DS = 16 nm. i, The same strand orientation analysis as shown in h was applied to the external surface of B.subtilis cells (Fig. 3c in the main text), the angle distribution is broad (inset, I), indicating the glycan strands on the external surface have no predominant orientation in contrast with the internal surface. j, Data used to plot the orientation distribution rose from the inset in i, using the same procedure as c and f. This experiment provides mechanistic insight into the cylindrical orientation architecture in the inside of the rod-shaped of Gram-positive species B. subtilis. The protein complex of MreB, Mbl and MBH is vital for the synthesis of the peptidoglycan in this cylindrical architecture.
Extended Data Figure 9
Extended Data Figure 9. B. subtilis septa.
This figure compares images of B. subtilis cell wall fragments acquired in liquid with images of the same fragments acquired in air, and allows our current findings to be understood in the context of our previous study (reference from the main text). a and b, B. subtilis septa at different stages of formation, imaged in liquid. DS = 70 nm and 158 nm respectively. In both cases a disordered mesh structure is apparent with pores penetrating deep into the cell wall. c and d, corresponding images from the same septa as a, b in the same orientation in air. DS = 31 nm and 60 nm respectively. Some features that were observed in our previous work, such as the concentric rings around the circumference of the septa (green arrow heads), and the ridges around the outer diameter of the septa (blue arrow), were identified. We attribute these features to the superposition of the mesh structures on both sides of the septa, with the concentric rings formed in the middle between them, coupled with the influence of differential drying. The experiment of correlating S. aureus sacculi in ambient and liquid environment (ED4) to measure the difference in thickness, was repeated for B. subtilis sacculi fragments and also showed a significant difference. e and f, Examples of single layer fragments, marked 1 and 2, imaged in water and in air. The thickness of each individual fragment was measured using the 1D statistical analysis from Gwyddion™ software (see details in Methods). g, Graph showing the thickness for 19 sacculi measured in both air and liquid. There is a significant increase in thickness in liquid after a two-tailed paired t test was performed (p value = 1.2·10-9, see Methods). The box-plot consists of boxes from 25-75 percentile, middle line represents the median, black star indicates the mean value, error bars are maximum/minimum values excluding any outliers (using 1.5 inter-quartile range). Mean value ± s.d. are: ‘air’ 9 ± 1 nm and ‘liquid’ 34 ± 5 nm. These results are in agreement with sacculi thickness measured by TEM of B. subtilis (Fig 4 in reference in the main text). h, Higher resolution image from Fig 3j in the main text. The internal surface of this partially-formed septum is composed of randomly orientated mesh. Large pores are present going partially through the cell wall (blue arrows). DS = 137 nm. i, In contrast to h in this partially-formed septum most of the material has been synthesised already, the pores are not as deep or wide as in h (yellow arrows). DS = 160 nm. These two septa differ in the size of their aperture by 100 nm, meaning they are probably representing consecutive stages of septal formation. The structural difference between them suggests that there is more than one type of synthesis happening simultaneously: one happening at the leading edge of the aperture making it smaller, the other responsible for in-filling the pores going partially through the cell wall as seen in h, finally resulting in the tighter mesh seen in i.
Extended Data Figure 10
Extended Data Figure 10. Gram positive bacterial cell wall molecular architecture schematic
Schematic diagram showing proposed peptidoglycan organisation derived from AFM imaging for both S. aureus and B. subtilis. Drawings top-centre and bottom-left indicate areas of distinct morphology within the cell wall during the division process. Insets show schematised representative AFM images of the different architectures within the cell wall, all displayed at the same scale.
Figure 1
Figure 1
AFM images of peptidoglycan in living S. aureus. a, Entire cell, high-pass filtered (filter size = 0.25 μm, horizontal), blue arrow head: mesh, white arrow: rings. Inset (I): Unfiltered image of the same area. Topographic height data scale (DS) = 902 nm. b, Image of the external surface of mature S. aureus cell wall showing a porous gel structure, white arrow head indicates a feature consistent with a single glycan chain, green dotted arrows examples of strand convergence, and blue arrows multi-strand fibres. DS = 29 nm. c, Depth analysis of pores including the area of image b (colour scale: Grey 0 nm, Blue = 5 nm, Green = 10 nm, Orange = 15 nm, Purple = 20 nm, White = 23 nm). Profile shows a section through the image at the black dotted line on c, coloured lines indicate depths as above, black area shows outline of pores. d, Ring architecture. DS = 22 nm. Inset (I): raw data. DS = 476 nm. e, Dense rings, white arrows indicating examples of likely individual chains. DS = 23 nm. f, Cross-section showing spacing between strands from boxed area in e. g, Histogram of strand width, full width at half maximum (FWHM) from image b, n = 60 strands, dotted line shows mean value. Images b, d and e have been plane-fitted to remove cell curvature. For sample size and data reproducibility, see Methods.
Figure 2
Figure 2
S. aureus sacculus architecture. a, 3D image of entire sacculus with external (white arrow) and internal (black arrow) surfaces, black dotted area see (ED4). 3D details: see Methods. Data scale (DS) = 205 nm. b, Sacculus external mature cell wall from within a. DS = 29 nm. c, Sacculus fragment with external surface facing upwards. White arrow: mesh, black arrow: rings. DS = 80 nm. d, Rings structure. Dotted line: location of profile (inset) showing the width of a likely single glycan. DS = 12 nm. e, Sacculus fragment internal surface upwards. White arrow: early septal growth. DS = 330 nm. f, Internal sacculus structure from within e. DS = 13 nm. g, Partially-formed septum, cytoplasmic facing surface upwards. DS = 389 nm. h, Inner surface of partially-formed septum (ED4). Inset: orientation diagram (-90 to 90) from MATLAB analysis (ED8). DS = 12 nm. i, Graph showing area of each pore vs the cumulative fraction of the total pore area of all pores. Red stars show 50% of cumulative area, i.e. half the total hole area consists of holes smaller/larger than this value. n = 601 pores, from 10 images (histograms in ED5). j, Histogram of strand width, measured at FWHM from image f, n = 45 strands. Red dotted line indicates the mean. k, Thickness in liquid and air before (left, n = 25 sacculi) and after (right, n = 10 sacculi) removal of wall teichoic acids, using a paired, two-tailed t test: p = 2.4·10-15 (left) and p = 8.3·10-6 (right), boxes represent 25-75% percentile with centre-line Median, black stars show Mean and bars minimum/maximum. l, Images of the same sacculus fragment in air (left) and liquid (right) with same DS = 50 nm. See ED4. For sample size and data reproducibility, see Methods.
Figure 3
Figure 3
AFM images of peptidoglycan of living B. subtilis and extracted sacculi. a, Cells immediately post-division, division site (green arrow). Data scale (DS) = 324 nm. b, Topographic image of mature B. subtilis cell wall from within e. White arrow a likely single glycan chain. DS = 22 nm. c, Depth analysis of pores from image ED7d (colour scale: Blue = 5 nm, Green = 10 nm, Orange = 15 nm). Profile taken at the black dotted line on c, coloured lines indicate depths as above. DS = 23 nm. d, Histogram of strand width, measured at FWHM from image c and a similar image, n = 111 strands, dotted line shows the mean. e, 3D image of pole showing concentric rings: blue arrows show orientation of rings; black arrow indicates mature mesh. 3D details: see Methods. DS = 760 nm. f, Image of the interface between disordered mesh and rings from within e. Blue arrows: same location as in e. DS = 52 nm. g, Mature sacculus, DS = 29 nm. h, Cell pole. DS = 18 nm. i, Internal surface of sacculus from cylinder region. Strands orientated vertically along the short axis of the cell (arrow). DS = 22 nm. j, Partially-formed septum flat on the surface. DS = 223 nm. k, Cytoplasmic facing side of a partially-formed septum from within inset. DS = 30 nm. Inset: partially-formed septum. DS = 157 nm. For sample size and data reproducibility, see Methods.

Similar articles

Cited by

References

    1. Turner RD, Vollmer W, Foster SJ. Different walls for rods and balls: The diversity of peptidoglycan. Mol Microbiol. 2014;91:862–874. - PMC - PubMed
    1. Vollmer W, Seligman SJ. Architecture of peptidoglycan: more data and more models. Trends Microbiol. 2010;18:59–66. - PubMed
    1. Rojas ER, et al. The outer membrane is an essential load-bearing element in Gram-negative bacteria. Nature. 2018;559:617–621. - PMC - PubMed
    1. Matias VRF, Beveridge TJ. Native cell wall organization shown by cryo-electron microscopy confirms the existence of a periplasmic space in Staphylococcus aureus. J Bacteriol. 2006;183:1011–1021. - PMC - PubMed
    1. Beeby M, Gumbart JC, Roux B, Jensen GJ. Architecture and assembly of the Gram-positive cell wall. Mol Microbiol. 2013;88:664–672. - PMC - PubMed

Publication types

MeSH terms