. 2020 May 25:8:490.
doi: 10.3389/fbioe.2020.00490. eCollection 2020.

The Construction and Analysis of lncRNA-miRNA-mRNA Competing Endogenous RNA Network of Schwann Cells in Diabetic Peripheral Neuropathy

Affiliations

The Construction and Analysis of lncRNA-miRNA-mRNA Competing Endogenous RNA Network of Schwann Cells in Diabetic Peripheral Neuropathy

Cheng Wang et al. Front Bioeng Biotechnol. .

Abstract

Background: Diabetes mellitus is a worldwide disease with high incidence. Diabetic peripheral neuropathy (DPN) is one of the most common but often ignored complications of diabetes mellitus that cause numbness and pain, even paralysis. Recent studies demonstrate that Schwann cells (SCs) in the peripheral nervous system play an essential role in the pathogenesis of DPN. Furthermore, various transcriptome analyses constructed by RNA-seq or microarray have provided a comprehensive understanding of molecular mechanisms and regulatory interaction networks involved in many diseases. However, the detailed mechanisms and competing endogenous RNA (ceRNA) network of SCs in DPN remain largely unknown.

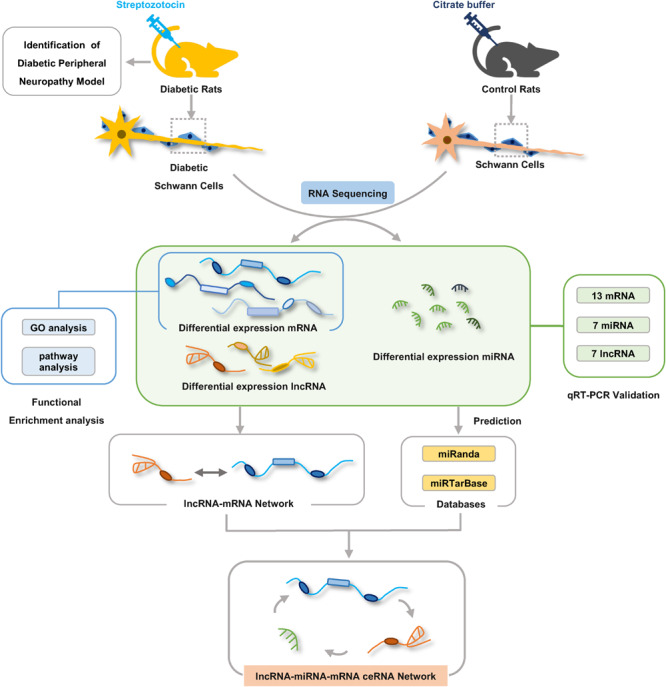
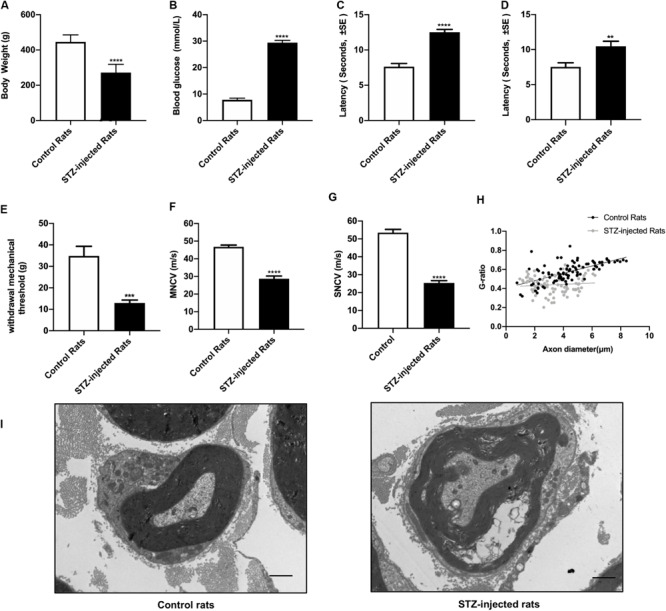
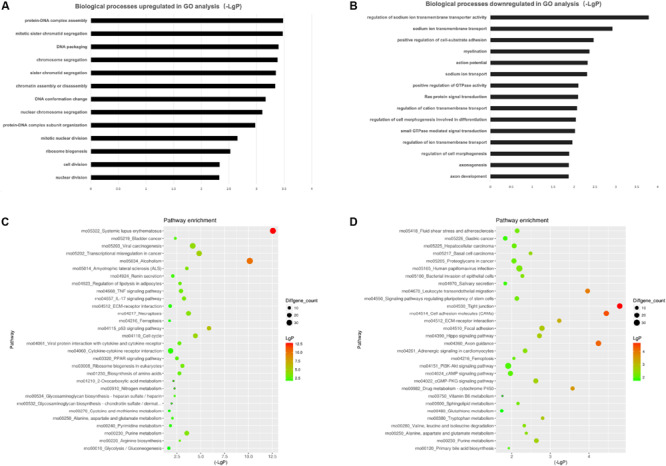
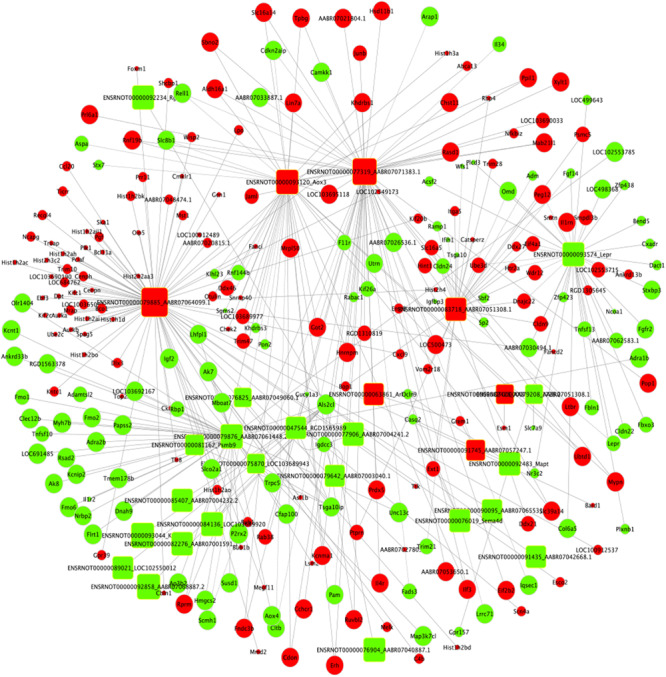
Methods: Whole-transcriptome sequencing technology was applied to systematically analyze the differentially expressed mRNAs, lncRNAs and miRNAs in SCs from DPN rats and control rats. Gene ontology (GO) and KEGG pathway enrichment analyses were used to investigate the potential functions of the differentially expressed genes. Following this, lncRNA-mRNA co-expression network and ceRNA regulatory network were constructed by bioinformatics analysis methods.

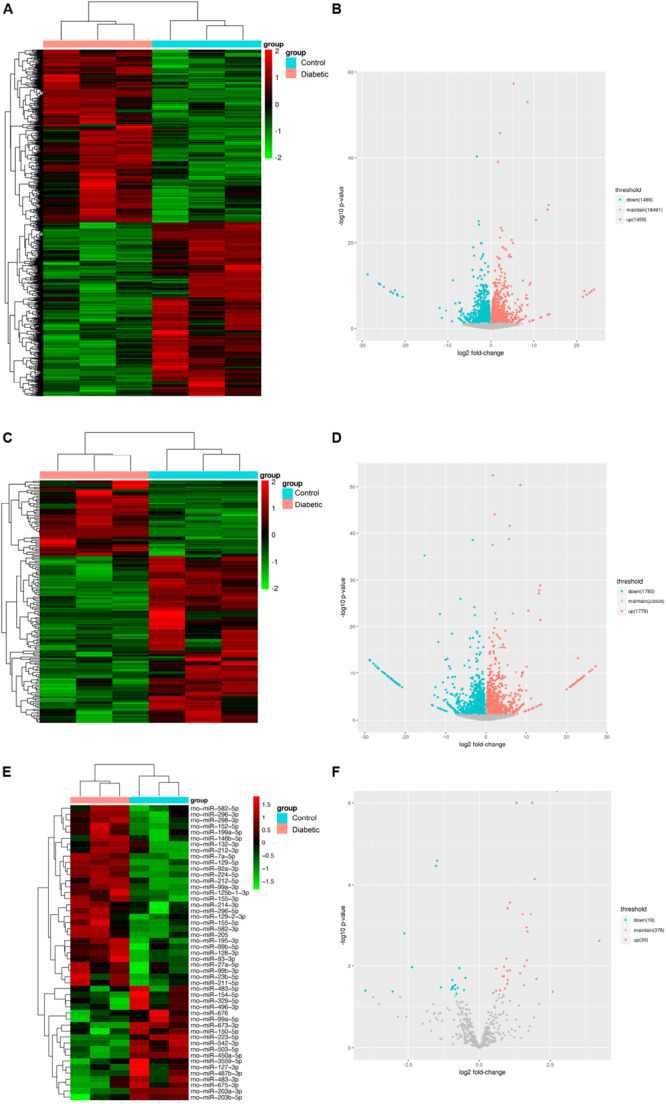
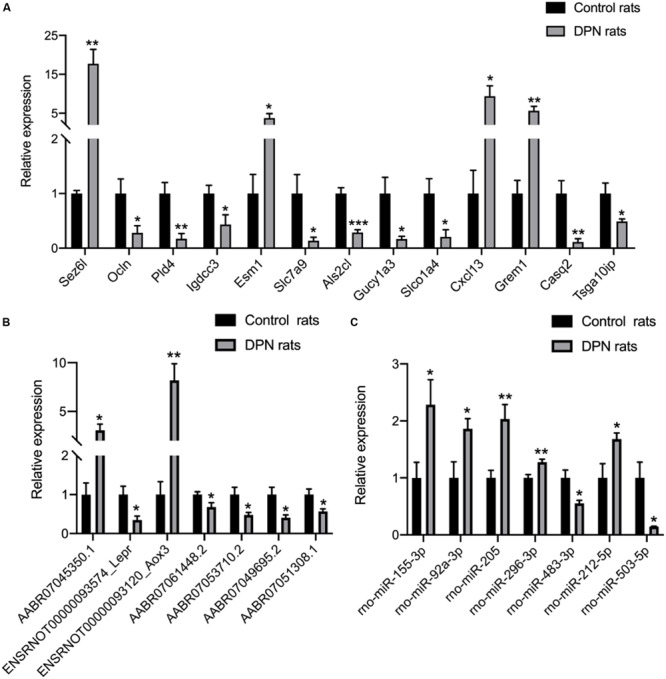
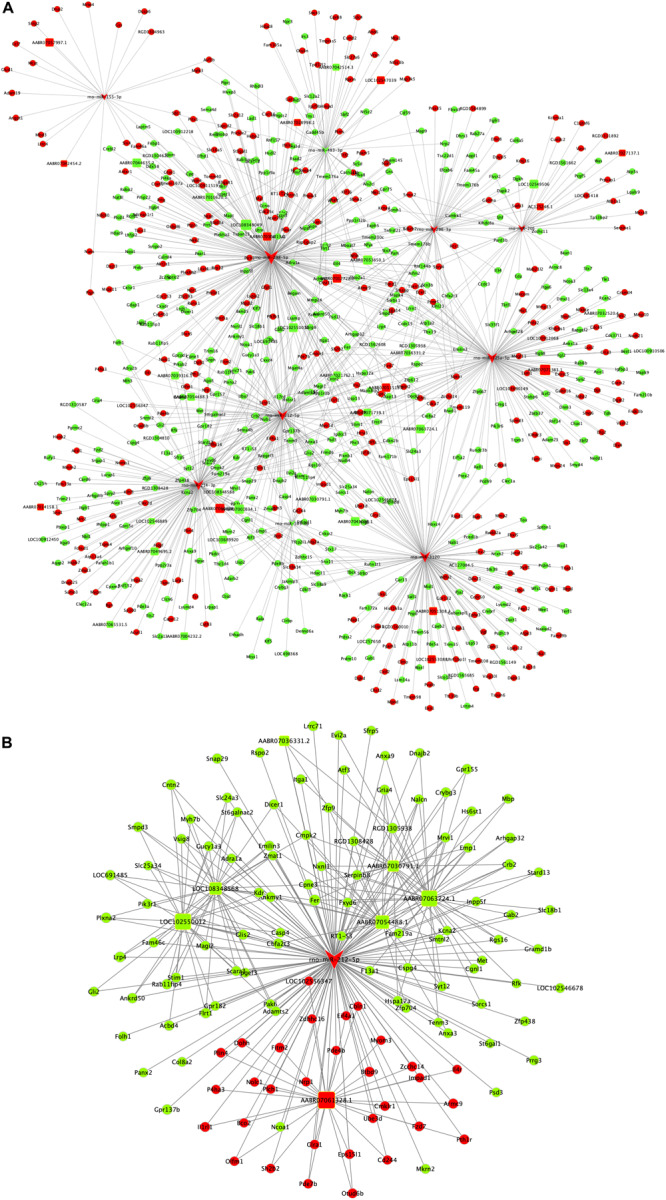
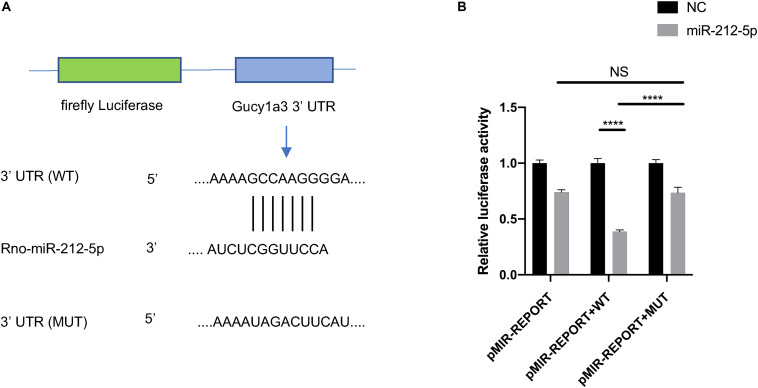
Results: The results showed that 2925 mRNAs, 164 lncRNAs and 49 miRNAs were significantly differently expressed in SCs from DPN rats compared with control rats. 13 mRNAs, 7 lncRNAs and 7 miRNAs were validated by qRT-PCR and consistent with the RNA-seq data. Functional and pathway analyses revealed that many enriched biological processes of GO terms and pathways were highly correlated with the function of SCs and the pathogenesis of DPN. Furthermore, a global lncRNA-miRNA-mRNA ceRNA regulatory network in DPN model was constructed and miR-212-5p and the significantly correlated lncRNAs with high degree were identified as key mediators in the pathophysiological processes of SCs in DPN. These RNAs would contribute to the diagnosis and treatment of DPN.

Conclusion: Our study has shown that differentially expressed RNAs have complex interactions among them. They also play critical roles in regulating functions of SCs involved in the pathogenesis of DPN. The novel competitive endogenous RNA network provides new insight for exploring the underlying molecular mechanism of DPN and further investigation may have clinical application value.

Keywords: RNA sequencing; Schwann cells; competing endogenous RNA; diabetic peripheral neuropathy; lncRNA; mRNA; miRNA.


Figures

FIGURE 1
FIGURE 1
The workflow of experiments and bioinformatic analysis. Male Sprague-Dawley rats were treated with streptozotocin (STZ) or citrate buffer and after 8 weeks Schwann cells were isolated from sciatic nerves of rats for RNA-seq analysis. Gene ontology and KEGG pathway enrichment analyses were used to investigate the potential functions of the differentially expressed genes. lncRNA–mRNA co-expression network and ceRNA regulatory network were constructed by bioinformatics analysis methods.
FIGURE 2
FIGURE 2
Evaluation of streptozotocin (STZ)-injected diabetic peripheral neuropathy (DPN) rat models. The differences between streptozotocin (STZ)-treated rats and control rats were calculated. The non-fasting blood glucose levels (B) were significantly higher in STZ-injected rats compared with control rats. The body weight (A), withdrawal threshold (E) and the motor and sensory nerve conduction velocities (F,G) in STZ-injected rats significantly decreased. The latency of hot plate test (C), tail flick test (D), and g-ratio of myelinated nerve fibers (H) significantly increased compared with controls (mean ± SEM, n = 10 per group, *p < 0.05, **p < 0.01, ***p < 0.001, ****p < 0.0001). The detail of myelinated fibers was showed in (I). Scale bars: 1.0 μm.
FIGURE 3
FIGURE 3
Identification of SCs. The morphology of Schwann cells (A) was observed under light microscope. SCs were immunolabeled for S100β (B) and nucleic acid was signed with DAPI (C). Image (D) was merged from (B,C). Scale bar: 100 μm.
FIGURE 4
FIGURE 4
Identification of mRNAs, lncRNAs, and miRNAs differentially expression in Schwann cells from streptozotocin (STZ)-treated rats and control rats. Hierarchical clustering analysis showed all differentially expressed mRNAs (A), lncRNAs (C), and miRNAs (E). Red color represented relatively high expression and green color represents relatively low expression. Volcano plots of normalized expression levels for differentially expressed mRNAs (B), lncRNAs (D) and miRNAs (F). The red points in the plots represented the upregulated RNAs with statistical significance and the blue points in the plots represented the downregulated RNAs with statistical significance (P-value < 0.05 and fold change > 1.2 or <0.83).
FIGURE 5
FIGURE 5
Confirmation of RNA-seq data in Schwann cells from streptozotocin (STZ)-treated rats and control rats by qRT-PCR. Thirteen mRNAs (A) were consistent with the RNA-seq results. Seven lncRNAs (B) were consistent with the RNA-seq results. Seven miRNAs (C) were consistent with the RNA-seq results. Results were presented as mean ± SEM of five independent experiments (*p < 0.05, **p < 0.01, ***p < 0.001, ****p < 0.0001). RNA samples used for qRT-PCR analysis were independent of RNA-seq samples.
FIGURE 6
FIGURE 6
Gene ontology (GO) analysis and KEGG pathway analysis. GO annotation of biological processes (BP) related to upregulated and downregulated mRNAs (A,B) of DPN model. KEGG pathway enrichment analysis of upregulated and downregulated mRNAs (C,D) of DPN model.
FIGURE 7
FIGURE 7
Sub-lncRNA–mRNA regulatory network was established based on 147 mRNAs and 9 lncRNAs. lncRNA and mRNA were indicated to round rectangle and ellipse, respectively. The red nodes represented upregulated RNAs and green nodes represented downregulated RNAs. The size of a node indicated the degree of node in the network.
FIGURE 8
FIGURE 8
Competing endogenous RNA network in DPN model. The competing endogenous RNA network is based on miRNA-target relationship and co-expressed interactions between mRNA and lncRNA. The whole competing endogenous RNA network (A) in the DPN model. The sub competing endogenous RNA network (B) consists of miR-212-5p, 7 lncRNAs and 125 mRNAs. miRNA was indicated to V-shape, lncRNAs were indicated to round rectangle and mRNAs were indicated to ellipse. The red nodes represented upregulated RNAs and green nodes represented downregulated RNAs. The size of a node indicated the degree of node in the network.
FIGURE 9
FIGURE 9
The interaction between Gucy1a3 and miR-212-5p. Potential binding sites of miR-212-5p and 3′ UTR of Gucy1a3 mRNA predicted by TargetScan (A). Dual-Luciferase activity assay showed that miR-212-5p could bind with the 3′ UTR of Gucy1a3 mRNA (B). (*p < 0.05, **p < 0.01, ***p < 0.001, ****p < 0.0001).

References

    1. Barabási A.-L. (2009). Scale-free networks: a decade and beyond. Science 325 412–413. 10.1126/science.1173299 - DOI - PubMed
    1. Bartel D. P. (2004). MicroRNAs: genomics, biogenesis, mechanism, and function. Cell 116 281–297. - PubMed
    1. Baum P., Kosacka J., Estrela-Lopis I., Woidt K., Serke H., Paeschke S., et al. (2016). The role of nerve inflammation and exogenous iron load in experimental peripheral diabetic neuropathy (PDN). Metabolism 65 391–405. 10.1016/j.metabol.2015.11.002 - DOI - PubMed
    1. Bonfanti C., Rossi G., Tedesco F. S., Giannotta M., Benedetti S., Tonlorenzi R., et al. (2015). PW1/Peg3 expression regulates key properties that determine mesoangioblast stem cell competence. Nat. Commun. 6:6364. 10.1038/ncomms7364 - DOI - PMC - PubMed
    1. Chaplan S. R., Bach F. W., Pogrel J. W., Chung J. M., Yaksh T. L. (1994). Quantitative assessment of tactile allodynia in the rat paw. J. Neurosci. Methods 53 55–63. - PubMed