. 2020 May 29;6(22):eaaz6919.
doi: 10.1126/sciadv.aaz6919. eCollection 2020 May.

Temporal pressure enhanced topical drug delivery through micropore formation

Affiliations

Temporal pressure enhanced topical drug delivery through micropore formation

Daniel Chin Shiuan Lio et al. Sci Adv. .

Abstract

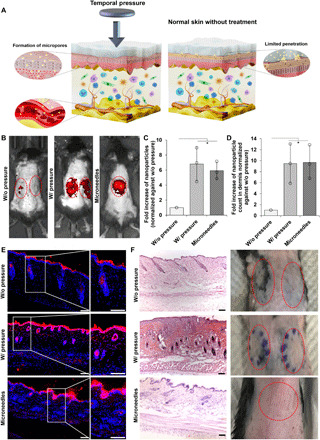
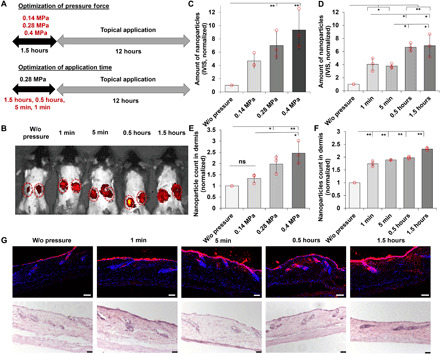
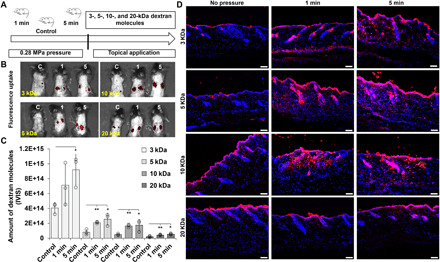
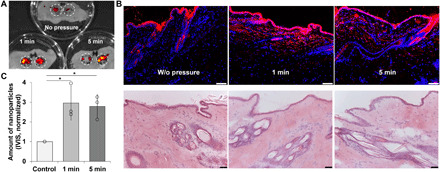
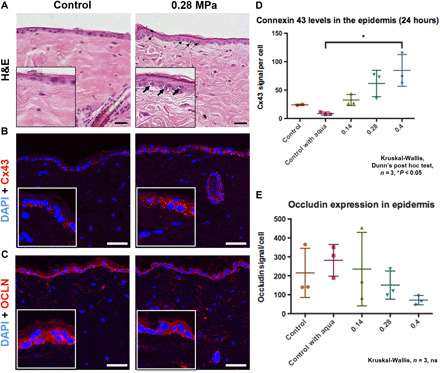
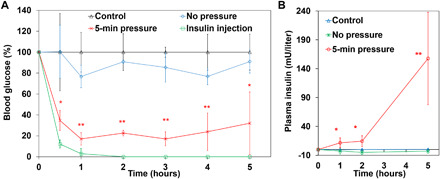
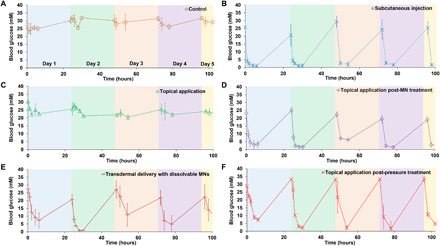
Transdermal drug delivery uses chemical, physical, or biochemical enhancers to cross the skin barrier. However, existing platforms require high doses of chemical enhancers or sophisticated equipment, use fragile biomolecules, or are limited to a certain type of drug. Here, we report an innovative methodology based on temporal pressure to enhance the penetration of all kinds of drugs, from small molecules to proteins and nanoparticles (up to 500 nm). The creation of micropores (~3 μm2) on the epidermal layer through a temporal pressure treatment results in the elevated expression of gap junctions, and reduced expression of occludin tight junctions. A 1 min treatment of 0.28-MPa allows nanoparticles (up to 500 nm) and macromolecules (up to 20 kDa) to reach a depth of 430-μm into the dermal layer. Using, as an example, the delivery of insulin through topical application after the pressure treatment yields up to 80% drop in blood glucose in diabetic mice.


Figures

Fig. 1
Fig. 1. Temporal pressure enhanced transdermal delivery.
(A) Schematic diagram demonstrating the effect of temporal pressure application leading to the occurrence of microphysiological changes, allowing the delivery of drugs across the skin barrier. (B) Representative images of mice with topically applied fluorescent nanoparticles (NPs) after the pressure and MN treatment. (C) Quantification of the fluorescent signal in (A). (D) Quantification of NPs in the dermis. (E) Fluorescence imaging [blue, 4′,6-diamidino-2-phenylindole (DAPI); red, NPs] of histological skin samples in (A). (F) Left: H&E staining of skin samples. Right: The appearance of mouse skin with or without the pressure treatment and MN. Scale bars, 100 μm. n = 3, all data are means ± SD, *P < 0.05. Photo credit: Daniel Chin Shiuan Lio, School of Chemical and Biomedical Engineering, Nanyang Technological University.
Fig. 2
Fig. 2. Optimization of temporal pressure application.
(A) Overview of the procedure performed to optimize pressure and application time. (B) Representative IVIS images of the mice treated with 0.28 MPa for different application times. (C) Quantification of fluorescent signal in IVIS imaging of mice treated with different pressures (0.14, 0.28, and 0.4 MPa). (D) Quantification of the fluorescent signal in IVIS imaging of mice treated with the same pressure (0.28 MPa) but with different duration (1 min, 5 min, 0.5 hours, and 1.5 hours). (E) Quantification of the fluorescent signal in the dermis of mouse skin treated with different pressures (0.14, 0.28, and 0.4 MPa). ns, not significant. (F) Quantification of fluorescent signal in the dermis of mouse skin treated with the same pressure (0.28 MPa) but with different durations (1 min, 5 min, 0.5 hours, and 1.5 hours). (G) Fluorescence imaging (blue, DAPI; red, NPs) and H&E staining of mouse skin treated with the same pressure (0.28 MPa) but with different durations (1 min, 5 min, 0.5 hours, and 1.5 hours). Scale bars, 100 μm. n = 3, *P < 0.05 and **P < 0.01. Photo credit: Daniel Chin Shiuan Lio, School of Chemical and Biomedical Engineering, Nanyang Technological University.
Fig. 3
Fig. 3. Topical delivery of dextran molecules after pressure treatment.
(A) Schematic of experiments. (B) IVIS image of mice after topical delivery of dextran molecules after the pressure treatment (C → no pressure, 1 → 1 min pressure treatment, 5 → 5 min pressure treatment). (C) Normalized quantification of dextran in treated skin in (B). (D) Fluorescence imaging (blue, DAPI; red, NPs) of histological skin samples in (B). Scale bars, 100 μm. n = 3, all data are means ± SD, *P < 0.05 and **P < 0.01. Photo credit: Daniel Chin Shiuan Lio, School of Chemical and Biomedical Engineering, Nanyang Technological University.
Fig. 4
Fig. 4. Transdermal delivery of NPs in rabbit skin with the temporal pressure treatment.
(A) IVIS fluorescence imaging of excised rabbit skin after pressure treatment and application of NPs. Circled areas represent the area of interest. (B) Fluorescence imaging (blue, DAPI; red, NPs) and H&E staining of rabbit skin after the treatment. (C) Quantification of NP fluorescence signal in (A). Scale bars, 100 μm. n = 3, all data are means ± SD, *P < 0.05. Photo credits: Daniel Chin Shiuan Lio, School of Chemical and Biomedical Engineering, Nanyang Technological University.
Fig. 5
Fig. 5. Micropore formation and altered junction protein expression in pressure-treated mouse skin.
(A) H&E staining of the mouse skin after the pressure treatment. The staining was performed 12 hours after the pressure treatment. Confocal images of pressure treated skin stained with DAPI (blue) and Cx43 (red) antibodies (B) and occludin (C). ImageJ quantification of Cx43 (D) and occludin (E) expression in the epidermis layer. Scale bars, 50 μm. n = 3, all data are means ± SD, *P < 0.05.
Fig. 6
Fig. 6. Blood glucose control in normal mice with topically delivered insulin after the pressure treatment.
(A) The change of blood glucose in the mouse circulation with topically delivered insulin after the pressure treatment, no pressure, and insulin injection over a period of 5 hours. (B) Quantification of insulin in the blood circulation after the pressure treatment and topical delivery of insulin over a period of 5 hours. n = 3, all data are means ± SD, *P < 0.05 and **P < 0.01.
Fig. 7
Fig. 7. Assessing temporal pressure as a method to topically administer insulin, daily, for 5 days.
Blood glucose control in diabetic mice for a period of 5 days with (A) control, (B) subcutaneous injection of insulin, (C) topical application of insulin, (D) topical application of insulin after MN treatment, (E) transdermal delivery of insulin with dissolvable MNs, and (F) topical application of insulin after pressure treatment. n = 3, all data are means ± SD.

References

    1. Prausnitz M. R., Langer R., Transdermal drug delivery. Nat. Biotechnol. 26, 1261–1268 (2008). - PMC - PubMed
    1. Karande P., Jain A., Mitragotri S., Discovery of transdermal penetration enhancers by high-throughput screening. Nat. Biotechnol. 22, 192–197 (2004). - PubMed
    1. Bos J. D., Meinardi M. M. H. M., The 500 Dalton rule for the skin penetration of chemical compounds and drugs. Exp. Dermatol. 9, 165–169 (2000). - PubMed
    1. Tenjarla S. N., Tenjarla S. N., Holbrook J. H., Pvranajoti P., Pegg C., Lowe K. D., Jackson T. E., Smith A., Evaluating the irritation potential of skin penetration enhancers in the hairless Guinea pig. J. Toxicol. Cutaneous Ocul. Toxicol. 14, 299–307 (2008).
    1. Paudel K. S., Milewski M., Swadley C. L., Brogden N. K., Ghosh P., Stinchcomb A. L., Challenges and opportunities in dermal/transdermal delivery. Ther. Deliv. 1, 109–131 (2010). - PMC - PubMed

Publication types

LinkOut - more resources