. 2020 May 29;6(22):eaba4901.
doi: 10.1126/sciadv.aba4901. eCollection 2020 May.

Mycobacterium tuberculosis clinical isolates carry mutational signatures of host immune environments

Affiliations

Mycobacterium tuberculosis clinical isolates carry mutational signatures of host immune environments

Qingyun Liu et al. Sci Adv. .

Abstract

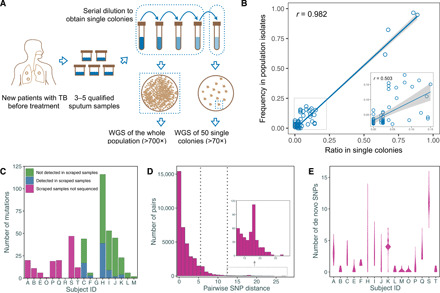
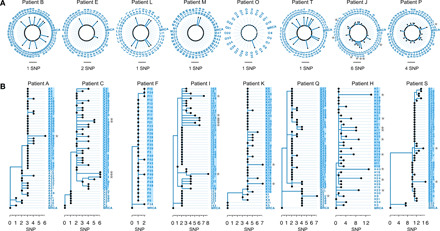
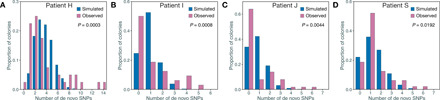
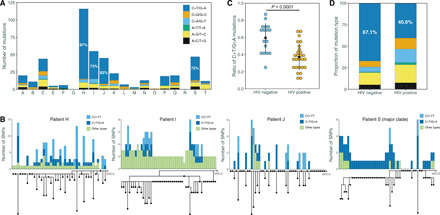
Mycobacterium tuberculosis (Mtb) infection results in a spectrum of clinical and histopathologic manifestations. It has been proposed that the environmental and immune pressures associated with different contexts of infection have different consequences for the associated bacterial populations, affecting drug susceptibility and the emergence of resistance. However, there is little concrete evidence for this model. We prospectively collected sputum samples from 18 newly diagnosed and treatment-naïve patients with tuberculosis and sequenced 795 colony-derived Mtb isolates. Mutant accumulation rates varied considerably between different bacilli isolated from the same individual, and where high rates of mutation were observed, the mutational spectrum was consistent with reactive oxygen species-induced mutagenesis. Elevated bacterial mutation rates were identified in isolates from HIV-negative but not HIV-positive individuals, suggesting that they were immune-driven. These results support the model that mutagenesis of Mtb in vivo is modulated by the host environment, which could drive the emergence of variants associated with drug resistance in a host-dependent manner.


Figures

Fig. 1
Fig. 1. Schematic diagram of the sampling approach and genetic diversity of the Mtb population within the host.
(A) We repeatedly collected three to five sputum samples from new and treatment-naïve patients with TB. All sputum samples from a single individual were mixed together and processed with a standard procedure and then serially diluted. The target dilutions were spread onto five plates, while the remaining undiluted samples were mixed together and spread onto two plates. WGS, whole-genome sequencing. (B) The correlation between the frequencies of single-nucleotide polymorphisms (SNPs) in scraped samples and the relative single-colony samples was tested by Pearson’s correlation coefficient (r); the small inset shows an enlargement of the dashed box on the left. (C) A bar plot showing the numbers of de novo SNPs that were detected in colony samples in different patients with the number of SNPs that were not detected in the corresponding scraped whole population samples highlighted. (D) A histogram showing the distribution of pairwise SNP distance between any two single colonies from the same patient with the two dashed lines indicating the two commonly used SNP thresholds for defining transmission clusters. (E) A violin plot showing the distribution of numbers of de novo SNPs in single colonies from each patient.
Fig. 2
Fig. 2. Phylogenetic trees of Mtb populations from different patients.
All trees are rooted to the inferred ancestral genome and all the “inherited SNPs” were excluded before the phylogenetic reconstruction. The length of solid lines represents the number of de novo SNPs. (A) “Starlike expansion” trees for these patients are shown in a circle format. Trees for patients G and R were not shown because no de novo SNPs were detected. (B) “Stepwise growth” trees for these patients are shown in rectangular format. Gray stars indicate those colonies with excessive de novo SNPs and the taxa names with blue backgrounds highlight the recently expanded populations.
Fig. 3
Fig. 3. Comparison of the distribution of de novo SNP numbers between simulated and observed populations.
(A to D) The comparisons of the Mtb populations from patients H, I, J, and S, respectively. The height of histograms shows the proportions of colonies with the relative number of de novo SNPs. The P values indicate the hypergeometric test for 0.9-quantile SNP numbers for the simulated and observed populations.
Fig. 4
Fig. 4. Oxidative damage mutations are the source of excessive de novo SNPs.
(A) The proportions of different mutation types in the samples from patients H, I, J, and S showed a deviation from the average level. (B) Integration of phylogenetic tree and mutation composition histograms for patients H, I, J, and S. For patient S, only the major clade (the 48 colonies) is shown here. Different colors refer to different mutation types. The gray dot “MRCA” represents the reconstructed ancestor of each Mtb population. For patients H, J, and S, the MRCA strains were detected in the single colonies. (C) A comparison of C-T mutation ratio between samples from HIV-negative and HIV-positive hosts (P < 0.0001 by t test), with each dot representing one patient. (D) The bar plot shows the ratio of C-T mutations in all samples from HIV-negative and HIV-positive hosts, respectively.

References

    1. Gengenbacher M., Kaufmann S. H., Mycobacterium tuberculosis: Success through dormancy. FEMS Microbiol. Rev. 36, 514–532 (2012). - PMC - PubMed
    1. Dookie N., Rambaran S., Padayatchi N., Mahomed S., Naidoo K., Evolution of drug resistance in Mycobacterium tuberculosis: A review on the molecular determinants of resistance and implications for personalized care. J. Antimicrob. Chemother. 73, 1138–1151 (2018). - PMC - PubMed
    1. Kempker R. R., Kipiani M., Mirtskhulava V., Tukvadze N., Magee M. J., Blumberg H. M., Acquired drug resistance in Mycobacterium tuberculosis and poor outcomes among patients with multidrug-resistant tuberculosis. Emerg. Infect. Dis. 21, 992–1001 (2015). - PMC - PubMed
    1. McGrath M., Gey van Pittius N. C., van Helden P. D., Warren R. M., Warner D. F., Mutation rate and the emergence of drug resistance in Mycobacterium tuberculosis. J. Antimicrob. Chemother. 69, 292–302 (2014). - PubMed
    1. Ford C. B., Shah R. R., Maeda M. K., Gagneux S., Murray M. B., Cohen T., Johnston J. C., Gardy J., Lipsitch M., Fortune S. M., Mycobacterium tuberculosis mutation rate estimates from different lineages predict substantial differences in the emergence of drug-resistant tuberculosis. Nat. Genet. 45, 784–790 (2013). - PMC - PubMed

Publication types